

Validity of heart rate derived core temperature estimation during simulated firefighting tasks
- PMID: 38110650
- PMCID: PMC10728086
- DOI: 10.1038/s41598-023-49929-x
Validity of heart rate derived core temperature estimation during simulated firefighting tasks
Abstract
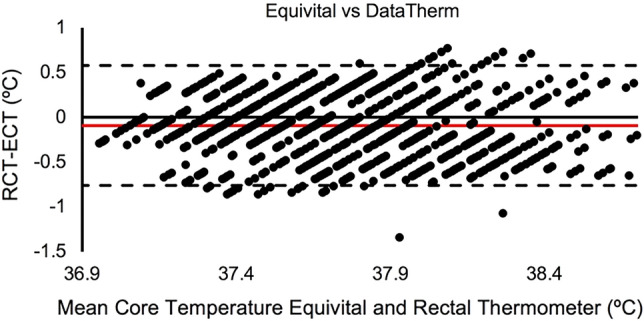
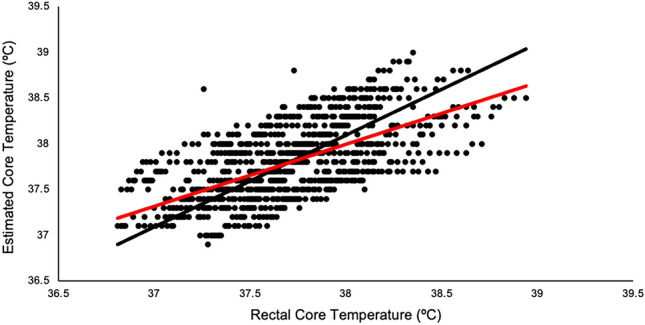
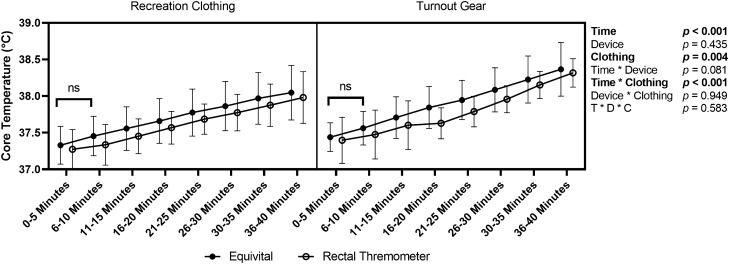
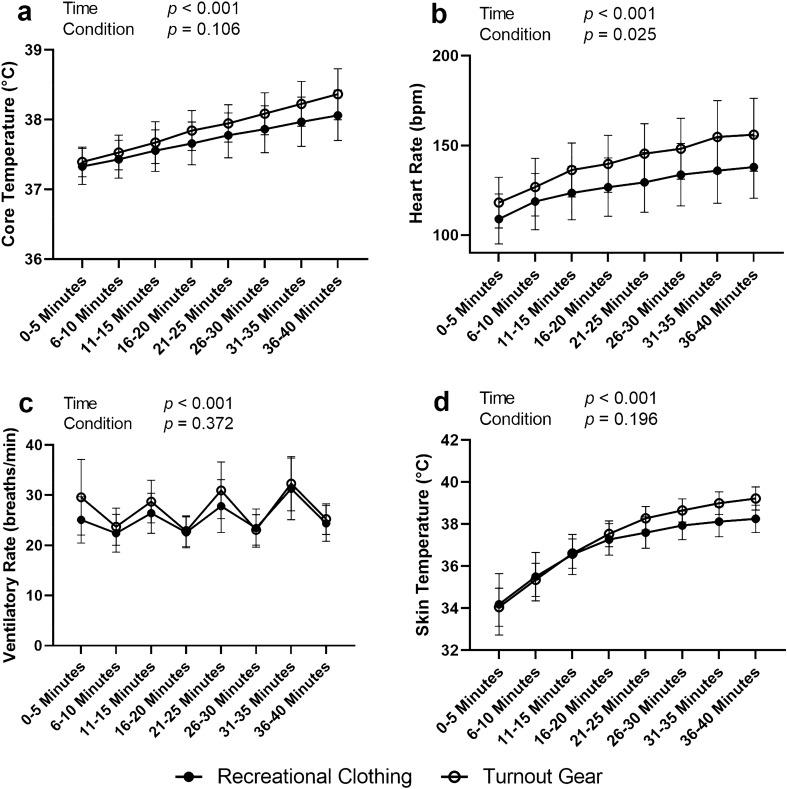
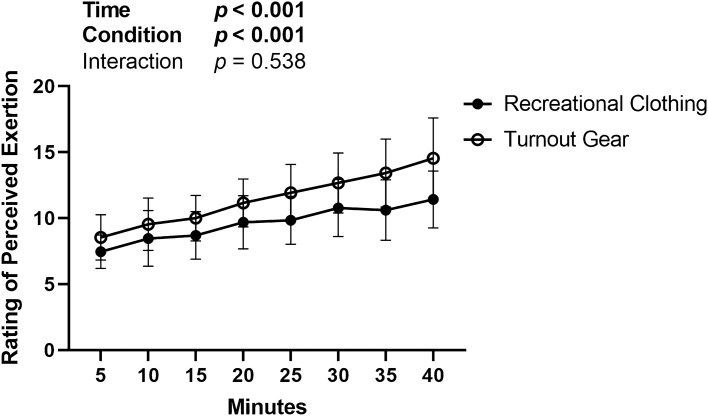
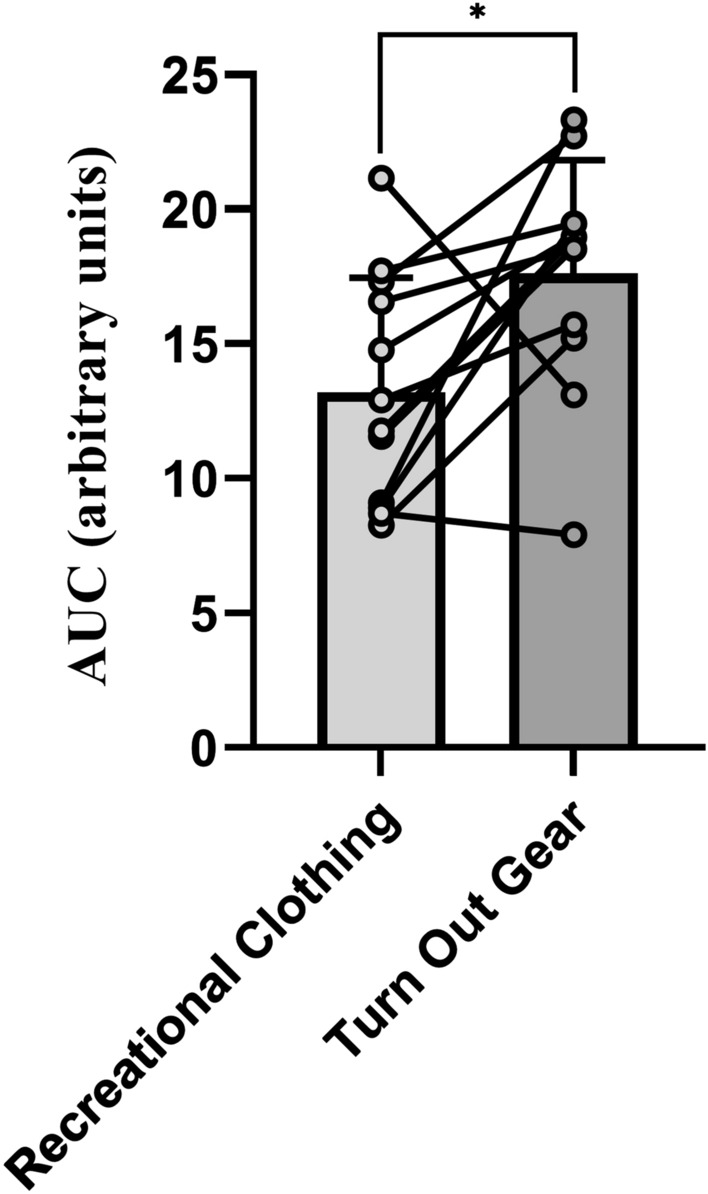
Rectal core temperature monitoring can help fire services mitigate heat injury but can be invasive and impractical. EQ02 + LifeMonitor provides a non-invasive estimation of core temperature. Therefore, the primary purpose of this study was to determine the validity of the EQ02 + LifeMonitor compared to the gold standard rectal thermometer core temperature assessment, as well as the potential influence of turnout gear on the estimated and physiological strain experienced during these activities. Thirteen participants completed simulated firefighting tasks with and without turnout gear, involving four rounds of a 5-min walk on a treadmill at 2.8 mph/2.5% grade and 20 deadlifts over 5 min in an environmental chamber set to 40.6 °C; 50% humidity. During each trial participants wore both an EQ02 + LifeMonitor and DataTherm II rectal thermometer. The results from the devices were statistically equivalent (p < 0.001), yet there was a statistically significant difference in the value (~ 0.1 °C; p < 0.001). There was a significant effect of devices [p < 0.001] and time [p < 0.001], but no interaction effect [p = 0.70] on core temperature drift. Estimated core temperature was marginally different from that measured via the DataTherm II. The EQ02 on average overestimated core temperature. Heart rate, rating of perceived exertion, and area under the curve of core temperature were significantly elevated due to turnout gear [ps < 0.025], but not core temperature skin temperature, or ventilatory rate [ps > 0.372]. These results suggest the EQ02 + LifeMonitor may be a viable, non-invasive alternative for assessing core temperature compared to rectal temperature monitoring, especially during rigorous, intermittent activities. Turnout gear does however increase heart rate, cumulative core temperature, and perceived exertion. Additionally, the validity of the estimated core temperature is not impacted by the use turnout gear. This is likely due to significant changes in heart rate, which allowed the heart-rate derived estimate of core temperature to remain consistent with changes in DataTherm II rectal temperatures.
© 2023. The Author(s).
Conflict of interest statement
The authors declare no competing interests.
Figures
References
-
- Carballo-Leyenda B, et al. Wildland firefighters’ thermal exposure in relation to suppression tasks. Int. J. Wildland Fire. 2021;30(7):475. doi: 10.1071/WF20076. - DOI
-
- Willi JM, et al. Characterizing a firefighter’s immediate thermal environment in live-fire training scenarios. Fire Technol. 2016;52(6):1667–1696. doi: 10.1007/s10694-015-0555-1. - DOI
-
- Gledhill N, Jamnik VK. Characterization of the physical demands of firefighting. Can. J. Sport Sci. 1992;17(3):207–213. - PubMed
MeSH terms
LinkOut - more resources
Full Text Sources
