. 2024 Jan;9(1):200-213.
doi: 10.1038/s41564-023-01544-2. Epub 2023 Dec 18.

Commensal production of a broad-spectrum and short-lived antimicrobial peptide polyene eliminates nasal Staphylococcus aureus

Affiliations

Commensal production of a broad-spectrum and short-lived antimicrobial peptide polyene eliminates nasal Staphylococcus aureus

Benjamin O Torres Salazar et al. Nat Microbiol. 2024 Jan.

Erratum in

Abstract

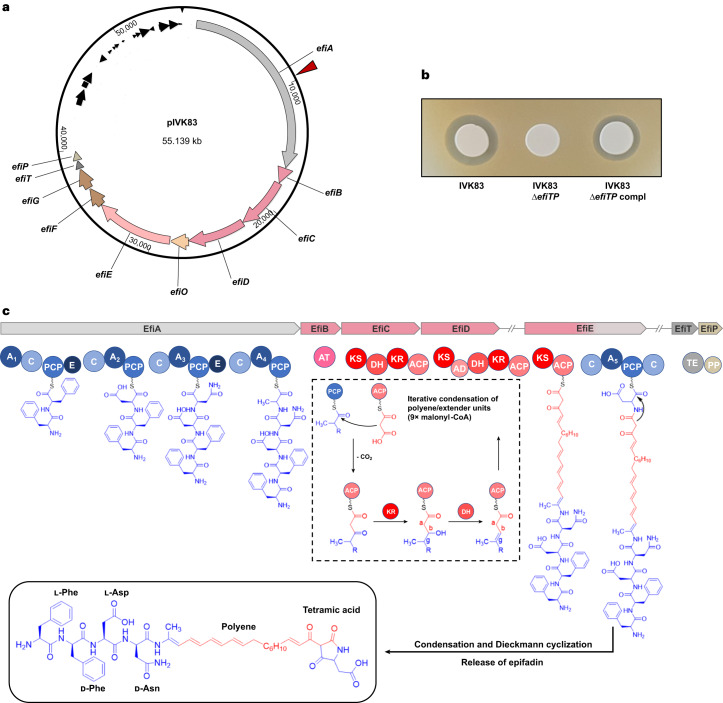
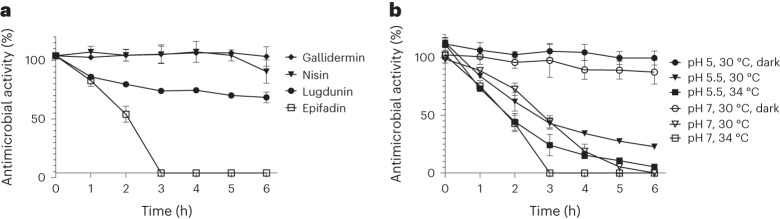
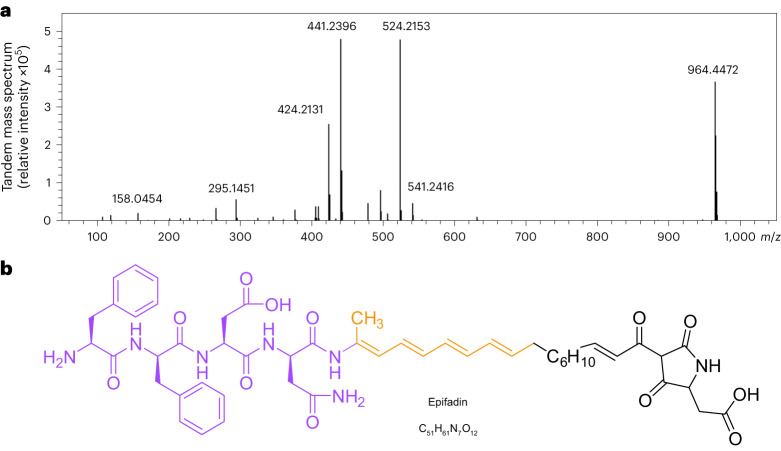
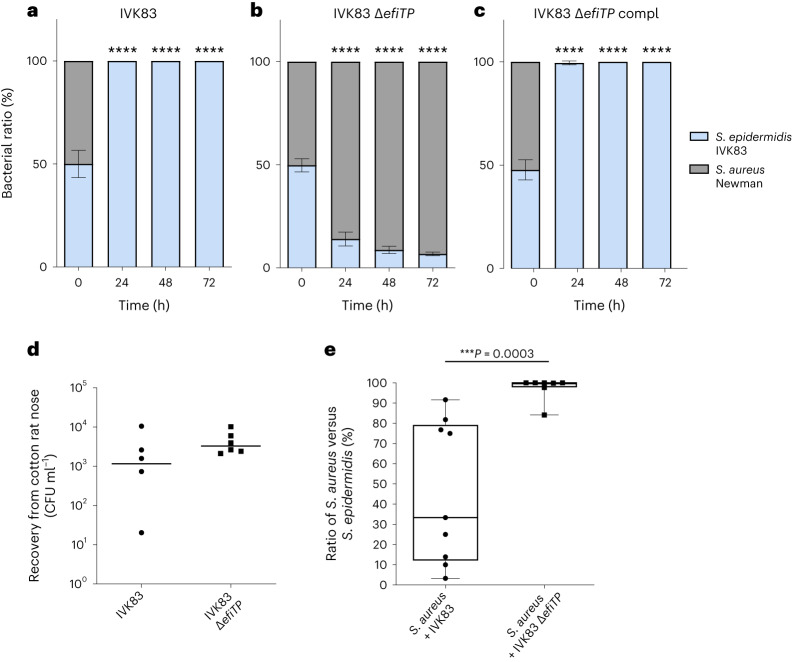
Antagonistic bacterial interactions often rely on antimicrobial bacteriocins, which attack only a narrow range of target bacteria. However, antimicrobials with broader activity may be advantageous. Here we identify an antimicrobial called epifadin, which is produced by nasal Staphylococcus epidermidis IVK83. It has an unprecedented architecture consisting of a non-ribosomally synthesized peptide, a polyketide component and a terminal modified amino acid moiety. Epifadin combines a wide antimicrobial target spectrum with a short life span of only a few hours. It is highly unstable under in vivo-like conditions, potentially as a means to limit collateral damage of bacterial mutualists. However, Staphylococcus aureus is eliminated by epifadin-producing S. epidermidis during co-cultivation in vitro and in vivo, indicating that epifadin-producing commensals could help prevent nasal S. aureus carriage. These insights into a microbiome-derived, previously unknown antimicrobial compound class suggest that limiting the half-life of an antimicrobial may help to balance its beneficial and detrimental activities.


Conflict of interest statement

The authors declare no competing interests.

Figures

Fig. 1
Fig. 1. Plasmid and epifadin BGC composition, biosynthetic modules and domain organization of the epifadin NRPS–PKS enzymes of IVK83.
a, Plasmid map of pIVK83 (~55 kbp) harbouring the epifadin operon (~40 kbp). The cluster consists of genes encoding a putative NRPS (efiA), three PKS (efiB, efiC and efiD), a hybrid PKS/NRPS (efiE), a putative NAD(P)- or FAD-dependent oxidoreductase (efiO) located between efiD and efiE, a thioesterase (efiT), a phosphopantetheinyl transferase (efiP) and two ABC transporter genes (efiF and efiG). Red arrow indicates the insertion site of Tn917, generating an epifadin-deficient mutant. b, Antimicrobial activity of IVK83 wild type (WT), isogenic ΔefiTP mutant and complemented strain towards S. aureus USA300. c, Domain organization of the NRPS and PKS EfiA, EfiB, EfiC, EfiD, EfiE, EfiT and EfiP involved in epifadin biosynthesis and proposed biosynthesis pathway, in which the first A-domain is responsible for the iterative integration of two phenylalanine residues in l- and d-conformation, respectively. Functional domains: A, adenylation; C, condensation; PCP, peptidyl carrier protein; E, epimerization; KS, ketosynthase; DH, dehydratase; KR, ketoreductase; AD, trans-AT docking; TE, thioesterase; PP, 4′-phosphopantetheinyl transferase. In the final structure of epifadin, the given tetramic acid additionally undergoes keto-tautomerization. NRPS and PKS modules and their domains as well as their products are depicted in blue and red, respectively.
Fig. 2
Fig. 2. High instability of epifadin under in vivo-like conditions.
S. epidermidis IVK83 culture supernatants containing epifadin were precipitated with HCl, freeze-dried and extracted with DMSO. This extract was diluted in TSB, incubated for the indicated time periods with constant shaking under the respective conditions and subsequently tested for activity towards S. aureus USA300 LAC. a, Stability of epifadin compared with other antibacterial agents under standard laboratory conditions (37 °C, pH 7, laboratory light exposure). b, In vivo-like conditions with laboratory light exposure at pH 7 (nasal condition) or pH 5.5 (skin condition) and reduced temperatures; incubation of epifadin under exclusion from light enabled further purification and activity determination. Conditions at pH 7, 37 °C and 0 h were used as reference for 100% stability. Data shown represent the mean ± s.d. of three independent experiments. Source data
Fig. 3
Fig. 3. Detection, isolation and absorption spectrum of epifadin.
Chromatogram and absorption spectrum of epifadin on RP-HPLC column. a,b, HPLC-UV chromatograms (λ = 383 nm) of DMSO–PA extract of IVK83 wild type (a) and ΔefiTP mutant (b). A prominent peak (black arrow) of epifadin is only present in the wild-type sample with a retention time of ~15 min at 383 nm. c, UV chromatogram (383 nm) of the epifadin peak is shown. UV spectra of the active compound at 15.2 min and 15.6 min from 190 nm to 450 nm are shown (methanol as a solvent causes a strong absorbance at 200 nm). The absorption maxima of the epifadin peak are indicated (peptide bond, 210–230 nm; phenylalanine, 280 nm; and polyene moiety, 330–410 nm).
Fig. 4
Fig. 4. Molecular mass and structure of epifadin.
a, MS/MS spectrum of intact epifadin (HR-ESI(+) TOF MS) indicates a mass of intact epifadin of 964.4472 Da. b, Purple moiety elucidated by NMR and MS, orange moiety by NMR and tetramic acid moiety (black, inferred from genetic, 1D-NMR, 2D-NMR and HR-MS data in accordance with detailed MS mechanistic considerations; the structure is not depicted in its keto-tautomeric form).
Fig. 5
Fig. 5. Broad antimicrobial activity of epifadin-producing S. epidermidis IVK83.
Sizes of inhibition zones caused by IVK83 on lawns of test strains listed on the left are given in colour code: grey (no inhibition), green (below 1 mm), yellow (1–3 mm) or red (3–5 mm). The numbers of isolates with a specific degree of susceptibility to epifadin among all tested isolates are given behind species names. The IVK ΔefiTP mutant mediated no inhibition.
Fig. 6
Fig. 6. Epifadin-producing S. epidermidis IVK83 restricts S. aureus growth in vitro and in vivo in cotton rats.
ac, In vitro competition assays on TSA: S. aureus growth is inhibited by IVK83 wild type (WT) (grey or light blue bars, respectively) after 24 h of incubation on TSA (a); in contrast, the mutant IVK83 ΔefiTP is overgrown by S. aureus over time (b); complementation (pRB474Compl) restored the wild-type phenotype (c). Data points represent mean values ± s.d. of three independent experiments. Significant differences between starting condition and indicated timepoints were analysed by one-way analysis of variance (****P < 0.0001). d, Nasal colonization capability of IVK83 wild type and IVK83 ΔefiTP in cotton rats. Bacterial CFU found in cotton rat noses 5 days after instillation are shown. Horizontal lines represent the median of each group. Data shown represent the median of six individually colonized animals per bacterial strain. e, Epifadin-producing IVK83 reduces S. aureus carriage in cotton rat noses. Percentage of S. aureus cells from cotton rat noses was significantly lower when S. aureus was co-colonized with IVK83 wild type compared with the ΔefiTP mutant 5 days after instillation. Centre lines in the boxplots represent median values of nine and seven individually co-colonized animals, respectively; box edges, 25th and 75th percentiles; whiskers, 1.5× the interquartile range. Significant differences were calculated by the Mann–Whitney test (***P ≤ 0.001). Source data
Extended Data Fig. 1
Extended Data Fig. 1. Comparison of MS/MS spectra of the synthetic and natural peptide amide fragments of epifadin.
a, MS/MS spectrum of the natural peptide amide after decomposition of epifadin. b, MS/MS spectrum of the synthetic peptide amide 2. c, Fragmentation pattern of the synthetic and natural peptide amides 2. Fragmentation pattern for the peptide amide 2 is shown in black. F, phenylalanine; D, aspartate; N, asparagine; CO, carbon monoxide; NH3, ammonia.
Extended Data Fig. 2
Extended Data Fig. 2. Proton NMR spectrum of the synthetic peptide amide FfDn-NH2 (DMSO-d6, 600MHz, 303K).
The integrals of the proton signals are depicted as black curves. The scale shows the chemical shift δ in parts per million (ppm).
Extended Data Fig. 3
Extended Data Fig. 3. 1H-1H-ROESY NMR spectrum of the purified epifadin in DMSO-d6 (700 MHz, 303 K).
The red circles highlight coupling between the NH-proton and the protons of the methyl group of the alanine residue (9.14 ppm/1.95 ppm) and to the proton of the adjacent methine group (9.14 ppm/6.77 ppm). Also, the coupling of the protons of the methyl group from the alanine residue to the methine group is shown (6.77 ppm/1.95 ppm).
Extended Data Fig. 4
Extended Data Fig. 4. 1H NMR spectrum (DMSO-d6, 700 MHz, 303 K) of purified epifadin and its decomposition analyzed by HPLC-MS.
a, DMSO-d6 signal at 2.50 ppm as reference. The integrals of the proton signals are depicted as black curves. The scale shows the chemical shift δ in parts per million (ppm). b,c, The epifadin-enriched material was dissolved in a mixture of acetonitrile and water (1:1) with 0.05% trifluoroacetic acid, resulting in a concentration of 0.2 mg/mL and analyzed by HPLC-ESI-TOF-high resolution MS. The extracted ion chromatograms (EICs) of epifadin (C51H61N7O12 [M+H]+, m/z 964.4451 ± 0.005) are depicted in red (retention time 15.2 min and 15.6 min) and the base peak chromatograms (BPCs) in gray. EICs of the peptide amide (C26H32N6O7 [M+H]+, m/z 541.2405 ± 0.005) are depicted in blue (retention time 7.4 min) accumulating by strong decomposition of epifadin in the mentioned solvent after storage at −20 °C. b, analyzed after purification. c, Analyzed after 14 days of storage at −20 °C.
Extended Data Fig. 5
Extended Data Fig. 5. Deduced fragmentation pattern for the peptide amide and the PKS/NRPS moiety.
From a six-membered transition state a rearrangement results in a neutral loss of the peptide amide moiety. The newly formed allene (m/z 424.2131) decomposes into further fragments.
Extended Data Fig. 6
Extended Data Fig. 6. MS/MS spectra of epifadin showing fragmentation products from ionization in MS.
a, The mass of 964 Da corresponds to the intact proton adduct (m/z 964.4) of epifadin. 524 Da (m/z 524.2) corresponds to the proton adduct of the tetrapeptide EfiA product, and the mass of 441 Da (m/z 441.2) is assigned to the proton adduct of the EfiBCDE product (expansion shows also minor signals of peptide fragments). [M+H]+, monoisotopic positively charged ion; F, phenylalanine; D, aspartate; N, asparagine; CO, carbon monoxide. b, The fragmentation pattern for the peptide moiety in epifadin is shown. Numbering of amino acids and carbon atoms of PKS chain in red.
Extended Data Fig. 7
Extended Data Fig. 7. Epifadin is bactericidal for susceptible bacterial cells but does not inhibit mammalian cells.
a, Time-dependent elimination of S. aureus by epifadin. Incubation of S. aureus USA300 LAC with epifadin concentrations of 24 µg/mL and 12 µg/mL led to a fast decline of CFUs reaching the detection limit of 1 × 10³ CFU/mL after 210 min. Data represent means with SEM of three independent experiments. b,c, Cell viability assay. HeLa cells incubated with epifadin do not show increased cell death compared to mock-treated cells (DMSO treatment set as 100%) even at high concentrations of 12 µg/mL. Cycloheximide (CHM) was included as a positive control. Only at concentration of 24 µg/mL, epifadin shows a significant effect on cell viability, still leaving 84% of HeLa cells intact. Data points represent the mean ± SD of three independent experiments. Significant differences between lowest compound concentrations and higher concentrations were analyzed by one-way ANOVA (*P < 0.05; **P < 0.01; ***P < 0.001; ****P < 0.0001). Exact p values for the CHM treated HeLa cells were 0.0192 (6.25 × 10⁻² µg/ml), 0.0009 (0.125 µg/ml), 0.0001 (0.25 µg/ml). Source data
Extended Data Fig. 8
Extended Data Fig. 8. Epifadin-producing S. epidermidis IVK83 restricts S. aureus growth in vitro.
ac, in vitro competition assays in TSB. a, S. aureus growth is inhibited by IVK83 wild type (grey or light blue bars, respectively) already after 24 h of incubation in TSB inoculated at ratios of ~50:50. b, in contrast, the mutant IVK83 ΔefiTP is overgrown by S. aureus over time when inoculated at a 50:50 ratio. c, Complemented strain overgrew S. aureus for 48 h, after 72 h, ratio of complemented strain and S. aureus were similar to starting conditions. Data points represent mean value ± SD of three independent experiments. Significant differences between the starting condition and the indicated time points were analyzed by one-way ANOVA (**P < 0.01; ***P < 0.001; ****P < 0.0001). Source data
Extended Data Fig. 9
Extended Data Fig. 9. Structures of semi-synthetic derivatives of peptide amide and MS/MS spectra.
a) methyl ester of natural peptide amide and b) acetylated natural peptide amide.
Extended Data Fig. 10
Extended Data Fig. 10. Epifadin leads to depolarization of the bacterial membrane and rapid cell lysis of S. aureus.
(a) S. aureus USA300 JE2 cells were applied to an agarose pad, onto which 2 µL of extracts (50 mg/mL) of the epifadin producer IVK83 (left) or ΔefiTP (right) had been previously spotted. Image acquisition was started in the surrounding of the respective extract spot 15 min after S. aureus application. The agarose contained FM4-64 (red, 0.25 µg/mL, membrane dye) and Sytox Green (green, 0.25 µM, only visible upon membrane barrier malfunction). Representative micrographs are depicted, all adjusted in the Sytox green channel to the same settings for qualitative comparison. White scale bar, 5µm. (b) Time-resolved effects of extracts of IVK83 wild type and ΔefiTP on the membrane potential of S. aureus NCTC8325 as monitored by DiOC2(3) staining. CCCP (5 µM), positive control; DMSO, untreated control. Mean and s.d. of two biological with two technical replicates (n = 4). Black arrow, time point of compound addition. Source data

References

    1. Bomar, L., Brugger, S. D. & Lemon, K. P. Bacterial microbiota of the nasal passages across the span of human life. Curr. Opin. Microbiol.41, 8–14 (2018). 10.1016/j.mib.2017.10.023 - DOI - PMC - PubMed
    1. Paller, A. S. et al. The microbiome in patients with atopic dermatitis. J. Allergy Clin. Immunol.143, 26–35 (2019). 10.1016/j.jaci.2018.11.015 - DOI - PMC - PubMed
    1. Totté, J. E. et al. Prevalence and odds of Staphylococcus aureus carriage in atopic dermatitis: a systematic review and meta-analysis. Br. J. Dermatol.175, 687–695 (2016). 10.1111/bjd.14566 - DOI - PubMed
    1. Lee, Y. B., Byun, E. J. & Kim, H. S. Potential role of the microbiome in acne: a comprehensive review. J. Clin. Med.8, 987 (2019). 10.3390/jcm8070987 - DOI - PMC - PubMed
    1. Lee, A. S. et al. Methicillin-resistant Staphylococcus aureus. Nat. Rev. Dis. Prim.4, 18033 (2018). 10.1038/nrdp.2018.33 - DOI - PubMed

MeSH terms

Substances