Clinical Trial
. 2024 Apr;26(2):310-321.
doi: 10.1007/s11307-023-01878-7. Epub 2023 Dec 18.

Evaluation and Application of a PET Tracer in Preclinical and Phase 1 Studies to Determine the Brain Biodistribution of Minzasolmin (UCB0599)

Affiliations
Clinical Trial

Evaluation and Application of a PET Tracer in Preclinical and Phase 1 Studies to Determine the Brain Biodistribution of Minzasolmin (UCB0599)

Joël Mercier et al. Mol Imaging Biol. 2024 Apr.

Abstract

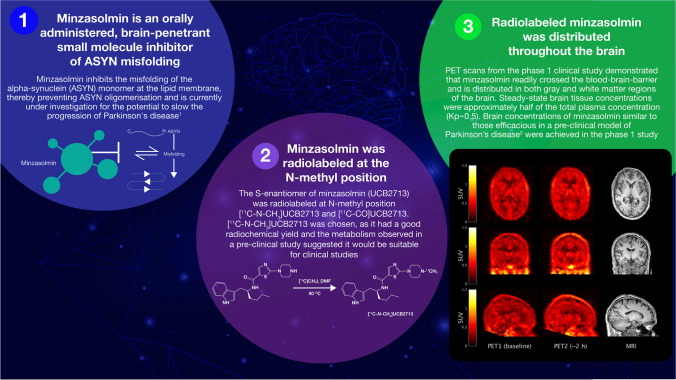
Purpose: Minzasolmin (UCB0599) is an orally administered, small molecule inhibitor of ASYN misfolding in development as a potential disease-modifying therapy for Parkinson's disease. Here we describe the preclinical development of a radiolabeled tracer and results from a phase 1 study using the tracer to investigate the brain distribution of minzasolmin.

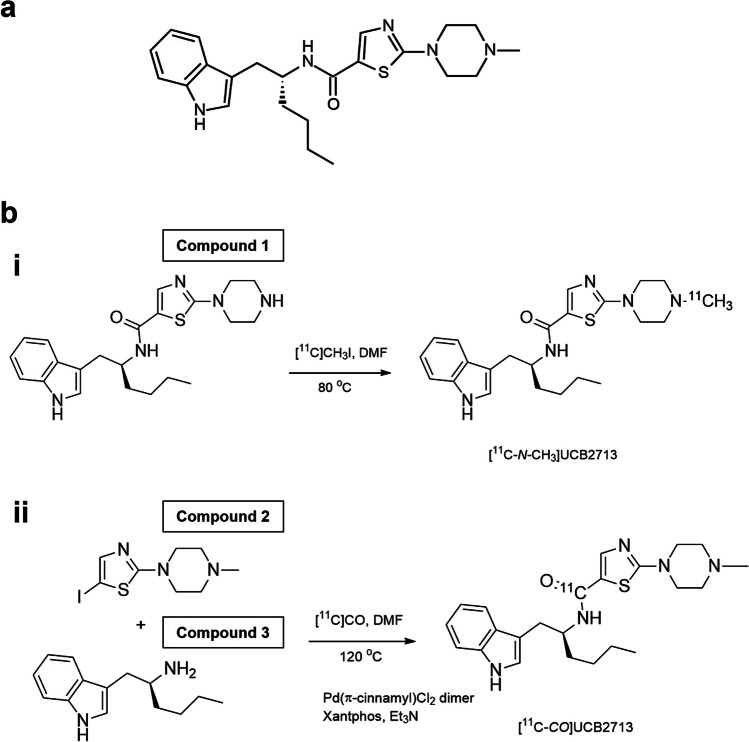
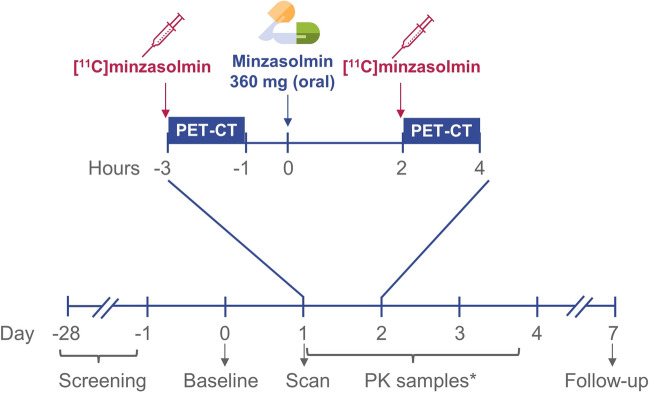
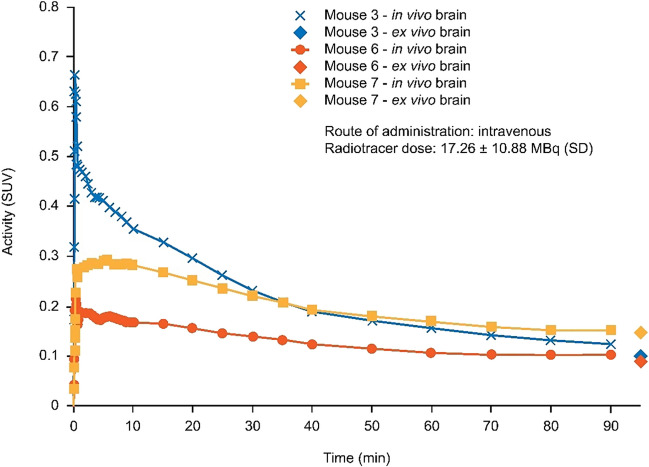
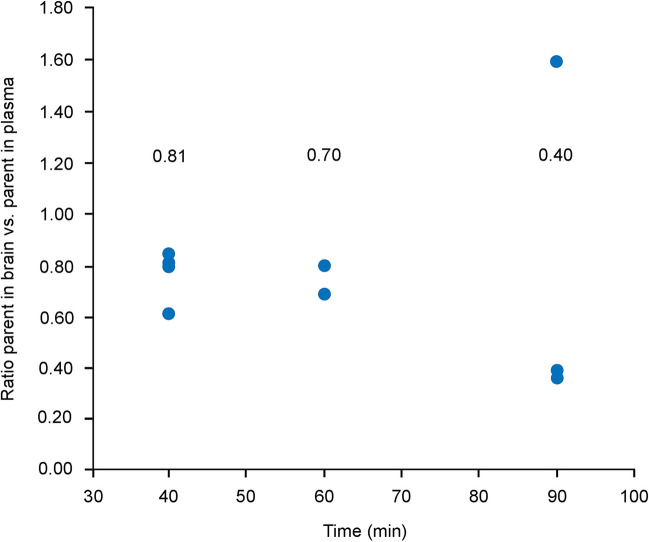
Procedures: In the preclinical study, two radiolabeling positions were investigated on the S-enantiomer of minzasolmin (UCB2713): [11C]methylamine UCB2713 ([11C-N-CH3]UCB2713) and [11C]carbonyl UCB2713 ([11C-CO]UCB2713). Male C57 black 6 mice (N = 10) received intravenous [11C-N-CH3]UCB2713; brain homogenates were assessed for radioactivity and plasma samples analyzed by high-performance liquid chromatography. Positron emission tomography-computed tomography (PET-CT) was used to image brains in a subset of mice (n = 3). In the open-label, phase 1 study, healthy volunteers were scanned twice with PET-CT following injection with [11C]minzasolmin radiotracer (≤ 10 µg), first without, then with oral dosing with non-radiolabeled minzasolmin 360 mg.

Primary objective: to determine biodistribution of minzasolmin in the human brain; secondary objectives included minzasolmin safety/tolerability.

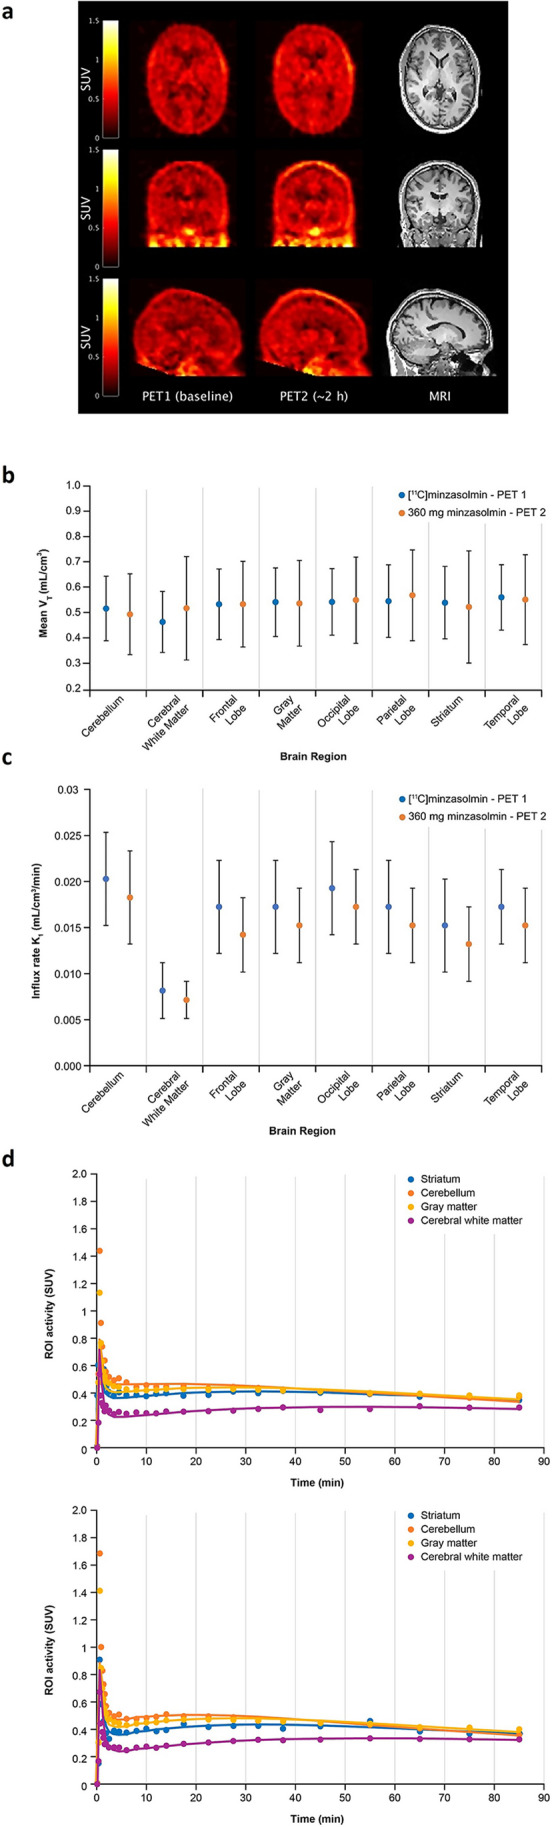
Results: Preclinical data supported the use of [11C]minzasolmin in clinical studies. In the phase 1 study, PET data showed substantial drug signal in the brain of healthy volunteers (N = 4). The mean estimated whole brain total distribution volume (VT) at equilibrium across all regions of interest was 0.512 mL/cm3, no difference in VT was observed following administration of minzasolmin 360 mg. Treatment-emergent adverse events (TEAEs) were reported by 75% (n = 3) of participants. No drug-related TEAEs, deaths, serious adverse events, or discontinuations were reported.

Conclusion: Following positive preclinical results with the N-methyl labeled PET tracer, [11C]minzasolmin was used in the phase 1 study, which demonstrated that minzasolmin readily crossed the blood-brain barrier and was well distributed throughout the brain. Safety and pharmacokinetic findings were consistent with previous early-phase studies (such as UP0077, NCT04875962).

Keywords: Alpha-synuclein; Brain distribution; Minzasolmin; PET tracers; PET-imaging; Parkinson’s disease; Phase 1 study.


Conflict of interest statement

RPM, JM, AOC, FXM, RN, and MW are all employees of UCB Pharma and may hold or have access to stock options. MB, ML, MG, JWS, and CO were employees of UCB Pharma at the time this work was conducted and may hold or have access to stock options. CP, MH, and GS are all employees of Invicro. VVA is an independent consultant.

Figures

Fig. 1
Fig. 1
a Chemical structure of minzasolmin. UPAC Nomenclature: N-[(1R)-1-(1H-indol-3-ylmethyl)pentyl]-2-(4-methylpiperazin-1-yl)thiazole-5-carboxamide. Molecular weight: 425.6, b Radiosynthesis of [11C-N-CH3]UCB2713 on the N-piperazine site (i) and [11C-CO]UCB2713 by [11C]aminocarbonylation (ii). Compound 1 N-[(1R)-1-(1H-indol-3-ylmethyl)pentyl]-2-piperazin-1-yl-thiazole-5-carboxamide, Compound 2 5-iodo-2-(4-methylpiperazin-1-yl)thiazole, Compound 3 (2S)-1-(1H-indol-3-yl)hexan-2-amine, [11C-CO]UCB2713 [11C]carbonyl UCB2713, [11C-N-CH3]UCB2713 [11C]methylamine UCB2713, DMF dimethylformamide, Et3N triethylamine.
Fig. 2
Fig. 2
Study design figure for TM0017. *PK samples were taken at 0 h (up to 5 min before dosing), and 0.25 h, 0.5 h, 1 h, 1.5 h, 2 h, 3 h, 4 h, 6 h, 8 h, 10 h, 12 h, 15 h, 24 h, 36 h, and 48 h after 360 mg oral minzasolmin. h hours, min minutes, PET-CT positron emission tomography-computed tomography, PK pharmacokinetics.
Fig. 3
Fig. 3
[11C]UCB2713 time activity curve in the brain (mouse) and ex vivo brain activity. In vivo experiments included PET/CT scan of the brain, performed on the three mice euthanized at 90 min post-administration of [11C]UCB2713; ex vivo experiments were performed on all 10 mice with samples of brain homogenate. min minute, PET-CT positron emission tomography-computed tomography, SD standard deviation, SUV standard uptake volume.
Fig. 4
Fig. 4
The ratio of parent ([11C]UCB2713) in brain:plasma over time. Median values are included above each group. min minute.
Fig. 5
Fig. 5
a TM0017—orthogonal cross-sections of co-registered PET and MR images from a representative participant. From left to right column images are PET Scan 1 (Baseline), PET Scan 2 (approximately 2 h post-dose), and structural (T1 weighted) MRI. The PET images are shown as SUV summed from 10 to 90 min. b Mean VT of [11C]minzasolmin by selected brain region of participants in the TM0017 phase 1 study (error bars are one standard deviation from the mean). c Mean brain uptake rate for each brain region assessed from total plasma concentrations (least-squares mean, error bars are one standard deviation from the mean). Blue = PET Scan 1, orange = PET Scan 2. d TACs for PET Scan 1 (Baseline) and PET Scan 2 (approximately 2 h post-dose) for selected ROI (striatum, cerebellum, gray matter, and cerebral white matter). h hour, K1 mean brain influx rate, min minute, MRI magnetic resonance imaging, PET positron emission tomography, ROI region of interest, SUV standard uptake value, T1 longitudinal relaxation time, TAC time activity curve, VT the estimated whole brain total distribution volume at equilibrium.
Fig. 6
Fig. 6
Summary of the preclinical and clinical studies ASYN alpha-synuclein, h hour, Kp partition coefficient, MRI magnetic resonance imaging, PET position emission tomography, SUV standard uptake value.

References

    1. Jankovic J, Tan EK. Parkinson’s disease: etiopathogenesis and treatment. J Neurol Neurosurg Psychiatry. 2020;91:795–808. doi: 10.1136/jnnp-2019-322338. - DOI - PubMed
    1. Simon DK, Tanner CM, Brundin P. Parkinson disease epidemiology, pathology, genetics, and pathophysiology. Clin Geriatr Med. 2020;36:1–12. doi: 10.1016/j.cger.2019.08.002. - DOI - PMC - PubMed
    1. Chen SW, Drakulic S, Deas E et al (2015) Structural characterization of toxic oligomers that are kinetically trapped during alpha-synuclein fibril formation. Proc Natl Acad Sci U S A 112:E1994–2003 - PMC - PubMed
    1. Fanning S, Selkoe D, Dettmer U. Parkinson’s disease: proteinopathy or lipidopathy? NPJ Parkinsons Dis. 2020;6:3. doi: 10.1038/s41531-019-0103-7. - DOI - PMC - PubMed
    1. Spillantini MG, Schmidt ML, Lee VM, Trojanowski JQ, Jakes R, Goedert M. Alpha-synuclein in Lewy bodies. Nature. 1997;388:839–840. doi: 10.1038/42166. - DOI - PubMed

Publication types

Associated data

LinkOut - more resources