. 2024 Feb;11(6):e2308537.
doi: 10.1002/advs.202308537. Epub 2023 Dec 18.

Engrailed-1 Promotes Pancreatic Cancer Metastasis

Affiliations

Engrailed-1 Promotes Pancreatic Cancer Metastasis

Jihao Xu et al. Adv Sci (Weinh). 2024 Feb.

Abstract

Engrailed-1 (EN1) is a critical homeodomain transcription factor (TF) required for neuronal survival, and EN1 expression has been shown to promote aggressive forms of triple negative breast cancer. Here, it is reported that EN1 is aberrantly expressed in a subset of pancreatic ductal adenocarcinoma (PDA) patients with poor outcomes. EN1 predominantly repressed its target genes through direct binding to gene enhancers and promoters, implicating roles in the activation of MAPK pathways and the acquisition of mesenchymal cell properties. Gain- and loss-of-function experiments demonstrated that EN1 promoted PDA transformation and metastasis in vitro and in vivo. The findings nominate the targeting of EN1 and downstream pathways in aggressive PDA.

Keywords: ERK signaling; Engrailed-1; apoptosis; cancer progression; cancer therapeutics; developmental transcription factor; epigenetic reprogramming; metastasis; pancreatic ductal adenocarcinoma.


Conflict of interest statement

The authors declare no conflict of interest.

Figures

Figure 1
Figure 1
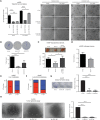
EN1 expression is associated with PDA progression and patient poor prognosis. A) Organoid survival assay of KPC tumor (mT)‐ and metastasis (mM)‐derived organoids. Organoids were dissociated into single cells, plated and grown in 10% FBS DMEM (reduced media) for 5 days. Scale bars, 1 mm. B) RNA‐seq based En1 mRNA expression in organoids from Oni et al. (GSE66348). Each dot represents an organoid line. C) 7 TFs (BATF, EN1, FOXA1, GATA5, PAX9, PRRX2, TRERF1) were introduced in mT3 organoids and subjected to organoid survival assay. Each TF was withdrawn from the 7 TFs combination. Scale bars, 1 mm. D) mT3 organoids with En1 cDNA were subjected to organoid survival assay either in the reduced media or in the complete media for 5 days. E,F) EN1 IHC of the indicated tissue sections, including primary tumor and peritoneal metastatic lesions from KPC mice (E) and mT3 organoids orthotopic injection models (F). Scale bars, 100 µm. G) Microarray based EN1 mRNA expression in cell lines and human PDA tissues from Moffitt et al. (GSE71729). H) EN1 mRNA normalized read count from PDA patient‐derived organoids (PDOs) in Tiriac et al. (phs001611.v1.p1). I) EN1 is associated with patient poor prognosis. Pancreatic cancer patients (TCGA‐PAAD) were stratified based on EN1 expression (EN1‐high n = 20 versus ‐low n = 129). p‐value was determined by logrank (Mantel‐Cox) test. J) Top 20 significantly enriched hallmarks of GSEA in EN1‐high versus ‐low patients from TCGA‐PAAD. Normalized enrichment score (NES) is shown. (K) GSEA of epithelial‐to‐mesenchymal transition signatures in EN1‐high versus ‐low pancreatic cancer patients or cell lines from TCGA‐PAAD, Moffitt et al. (GSE71729), Bian et al. (GSE89792), and Tiriac et al. (phs001611.v1.p1) NES, p‐value, and FDR q‐value were determined by GSEA. L) Normalized EN1 gene counts in progenitor and squamous PDA subtypes from Bailey et al. (GSE49149 and GSE36924). A dotted line indicates a cutoff to determine EN1 high versus low to perform Fisher's exact test (p‐val < 0.05). The cutoff was determined by a median value of EN1 expression in the squamous subtype. (M) GSEA of squamous (left) and progenitor (right) signatures in EN1‐high versus ‐low pancreatic cancer patients from Bian et al. (GSE89792). NES, p‐value, and FDR q‐value were determined by GSEA. Unless otherwise indicated, p‐values were determined by student's t test (two‐tail) and *, **, ***, **** indicated p‐val < 0.05, < 0.01, <0.001, <0.0001, respectively.
Figure 2
Figure 2
EN1 promotes aggressive characteristics in PDA cells. A) mT3‐2D cells with (En1) and without (empty) En1 cDNA overexpression were subjected to Boyden‐chamber invasion assay for 24 h, and the cells migrating to across the transwell were stained by SYTO 13 (right) and quantified per 4x image field (left). n = 3, mean ± SEM. B) mT3‐2D empty and En1 cells were subjected to wound‐healing assay, and the percentage of wound closure was monitored (right) and quantified (left) at 0‐ and 24‐hour post‐scratching. n = 3, mean ± SEM. C) mT3‐2D cells with En1 cDNA were subjected to anchorage‐independent tumor spheroid formation assay for 72 hours, and the numbers of spheroids were monitored (right) and quantified (left). n = 3, mean ± SEM. D) mT3‐2D empty (n = 7) and En1 (n = 4) cells were subjected to organotypic tumor‐on‐a‐chip assay (left) for 7 days, and the distance of the cell migrated toward to endothelial vessel was monitored (middle) and quantified (right) (n = 8 per time point, mean ± SD). p<0.001; p‐value were determined by Two‐way ANOVA. Scale bar, 200 µm. E) mT3‐2D cells with En1 cDNA were subject for tail‐vein injection (n = 5 per group) in C57BL/6 syngeneic mice. After 4 weeks, the animals were sacrificed, and the lung lobes were imaged (right) and quantified (left) for tumor area per lung lobe. n = 5, mean ± SD. F) CFPAC1 empty and EN1 cells were subject for colony formation assay for 7 days, and the colonies were stained by crystal violet (right) and quantified (left) by percentage growth area. n = 9, mean ± SD. (G) CFPAC1 empty and EN1 cells were subject for anchorage‐independent tumor spheroid formation assay for 7 days, and the numbers of spheroids were monitored (right) and quantified (left). n = 9, mean ± SD. Scale bars, 350 µm. Unless otherwise indicated, p‐values were determined by student's t test (two‐tail) and * and ** indicate p‐val < 0.05, and < 0.01, respectively.
Figure 3
Figure 3
EN1 deficiency attenuates PDA progression. A) mM3P organoids with scramble (shScr) and two En1 (shEn1) shRNA constructs were subjected to organoid survival assay for 4 days. Depletion of EN1 impaired organoid survival in the reduced media and En1 cDNA rescued the EN1‐depletion phenotype (middle). The complete media was served as control (right). Quantification of organoid survival (left). n = 3, mean ± SD. Scale bars, 1 mm. B) shScr and shEn1 mM3P organoids were subjected to colony formation assay for 7 days, and the colonies were stained by crystal violet (top) and quantified (bottom) by percentage growth area. n = 3, mean ± SD. C) 5×10 cells of dissociated shScr and shEn1 mM3P organoids were subjected to subcutaneous transplantation in athymic NU/NU mice. The animals were sacrificed at 4‐weeks post transplantation. EN1 depletion reduced the primary tumor burden and En1 cDNA rescued the phenotype. Representative images of the subcutaneous tumors (top) and quantification (bottom) of the tumor volume. n = 5 per group, mean ± SD. (D‐F) 5×10 cells of dissociated shScr and shEn1 mM3P organoids were subjected to orthotopic transplantation in athymic NU/NU mice for 7 weeks. The primary tumor weight D), the number of animals with liver metastases E), and the number of lungs micrometastasis (n>10) F) were quantified. The mean ± SD is shown (n = 5 for shScr and n = 4 for shEn1). G) shScr and shEN1 SUIT2 cells were subjected to colony formation assay for 5 days, and the colonies were stained with crystal violet (top) and quantified (bottom) for the percentage growth area. n = 3, mean ± SD. H) shScr and shEN1 SUIT2 cells were subjected to anchorage‐independent tumor spheroid formation assay for 7 days, and the numbers of spheroids were monitored (left) and quantified (right). n = 3, mean ± SD. Scale bars, 350 µm. Unless otherwise indicated, p‐values were determined by unpaired student's t test (two‐tail) and *, **, ***, **** indicate p‐val < 0.05, < 0.01, <0.001, <0.0001, respectively.
Figure 4
Figure 4
Identifying genomic targets of EN1 in murine PDA cells. A) Density plots of CUT&RUN‐seq signal of the EN1 DNA‐binding peaks in mT4‐2D and mT5‐2D cells with FLAG‐En1 cDNA. B) Genome‐wide distribution of the common EN1 peaks between mT4‐2D FLAG‐EN1 and mT5‐2D FLAG‐EN1 cells (n = 20271). C) Homer motif analysis for the de novo motifs using the overlapping mT4‐2D and mT5‐2D EN1 peaks. D) Gene ontology (GO) analysis using the Database for Annotation, Visualization, and Integrated Discovery (DAVID). The top 15 enriched pathways in biological functions were shown. E) GSEA of the genes associated with En1 peaks in EN1‐high versus ‐low pancreatic cancer patients from Yang et al. (GSE62452). The genes associated with top 1500 EN1 peaks among 20271 common peaks were used for GSEA. NES, p‐value, and FDR q‐value were determined by GSEA.
Figure 5
Figure 5
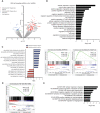
Identifying transcriptional targets of EN1 in PDA cells. A) Volcano plot representing RNA‐seq of mM3P and mM15 organoids with scramble (shScr) and two En1 (shEn1) shRNA constructs. Differentially expressed gene (DEG) analysis identified 154 DEGs. Among the DEGs, 120 genes were upregulated (red), and 32 genes were downregulated (blue) upon En1 depletion; among which, 92 DEGs (dark red or dark blue) were the direct EN1 targets. DEG‐direct EN1 target genes involved in cell death pathways were annotated. B) GO analysis of the DEGs using DAVID. Top 20 significantly enriched biological functions were shown. C) Normalized enrichment score (NES) of the GSEA Hallmark gene set in mM3P and mM15 organoids upon En1 knock‐down. The top 16 significantly enriched hallmarks (left) and examples of the GSEA plots (right) are shown. Hallmark_Apoptosis and Hallmark_Myc_Targets_V2 gene sets were enriched in shEn1 and shScr, respectively. D) GSEA of the genes associated with top 1500 EN1 peaks revealed that putative EN1 target genes were up‐regulated upon En1 depletion in mM organoids. E) GO analysis of the EN1 direct target genes using DAVID. Among the genes associated with En1 peaks, commonly up‐regulated genes upon En1 depletion were identified as direct targets of EN1.
Figure 6
Figure 6
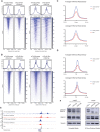
EN1 modulates gene promoter and enhancer activities to promote PDA progression. A) Density plots of H3K4me3 (left) and H3K27ac (right) CUT&RUN‐seq signals at EN1 genomic binding sites in mT3‐2D empty | FLAG‐En1 cells. B) Density plots of H3K4me3 (left) and H3K27ac (right) CUT&RUN‐seq signals at EN1 peak‐associated gene promoters and the transcription start sites (TSS) in mT3‐2D empty | FLAG‐En1 cells. C) Averaged density plots of H3K4me3 (left) and H3K27ac (right) CUT&RUN‐seq signals at EN1 genomic binding sites in mT4‐2D, mT5‐2D, and mT8‐2D empty | FLAG‐EN1 cells. D) Averaged density plots of H3K4me3 (left) and H3K27ac (right) CUT&RUN‐seq signals at EN1 peak‐associated gene promoters and the TSS in mT4‐2D, mT5‐2D, and mT8‐2D empty | FLAG‐EN1 cells. E) Representative gene browser track of H3K27ac, H3K4me3, and EN1 CUT&RUN‐seq signal at Dusp1 gene in mT3‐2D empty (blue) and FLAG‐EN1 (red) cells. F) Western blot analysis to determine the protein expression of phospho‐ERK1/2 (Thr202/Tyr204) and total ERK1/2 in mM3P organoids with scramble (shScr) and two independent En1 (shEn1) shRNA constructs. Blots on the left showed organoids cultured in the complete organoid media and on the right showed organoids cultured in the reduced media for 24 h before harvesting. Band intensity was determined by ImageJ.
Figure 7
Figure 7
EN1 promotes PDA progression in genetically engineered mouse models and PDA patients. A) Schematic representation of the genetically engineered mouse models with Kras+/LSL‐G12D, Trp53+/LSL‐R172H, Pdx1‐Cre (KPC) and En1flox/flox (KPEC) alleles. B) Kaplan‐Meier plot of KPC (n = 52) and KPEC (n = 66) mice survival. The median survival of KPC mice is 147 days and the median survival of KPEC mice is 212 days. ****p<0.0001 was determined by Log‐rank (Mantel‐Cox) test and GehIBreslow‐Wilcoxon test. C) Bar plot representing the percentage of abnormal pancreata (red) and normal pancreata (blue) from the KPC mice (n = 10) and KPEC mice (n = 10) at 120‐day age. Representative H&E staining of KPC pancreas (bottom left, scale bar, 300 µm) and KPEC pancreas (bottom right, scale bar, 300 µm). D) Quantification of the number of mice bearing tumors at 120‐day age from KPC (n = 10) and KPEC (n = 10) mice. E) IHC staining of EN1 in 19 human pancreatic and metastatic specimens from rapid autopsies (left). Representative image of a primary tumor EN1 IHC staining from patient #55 (Top right, scale bar, 100 µm). Representative image of a liver metastasis EN1 IHC staining from patient #55 (Bottom right, scale bar, 100 µm). F) Kaplan‐Meier plot of patient days survived after diagnosis corresponding to EN1‐high (n = 27) versus ‐low (n = 8) from the tissue microarray IHC. *p<0.05 was determined by Log‐rank (Mantel‐Cox) test and Gehan‐Breslow‐Wilcoxon test.

References

    1. Siegel R. L., Miller K. D., Wagle N. S., Jemal A., CA Cancer J Clin. 2023, 73, 17. - PubMed
    1. Maitra A., Hruban R. H., Annu Rev Pathol 2008, 3, 157. - PMC - PubMed
    1. Yachida S., Jones S., Bozic I., Antal T., Leary R., Fu B., Kamiyama M., Hruban R. H., Eshleman J. R., Nowak M. A., Velculescu V. E., Kinzler K. W., Vogelstein B., Iacobuzio‐Donahue C. A., Nature 2010, 467, 1114. - PMC - PubMed
    1. Wang S. S., Xu J., Ji K. Y., Hwang C.‐I.l, Biomolecules 2021, 11, 1082. - PubMed
    1. Somerville T. D. D., Xu Y., Miyabayashi K., Tiriac H., Cleary C. R., Maia‐Silva D., Milazzo J. P., Tuveson D. A., Vakoc C. R., Cell Rep. 2018, 25, 1741. - PMC - PubMed

Publication types

MeSH terms