

Dynamics of chromatin accessibility and genome wide control of desiccation tolerance in the resurrection plant Haberlea rhodopensis
- PMID: 38110858
- PMCID: PMC10729425
- DOI: 10.1186/s12870-023-04673-2
Dynamics of chromatin accessibility and genome wide control of desiccation tolerance in the resurrection plant Haberlea rhodopensis
Abstract
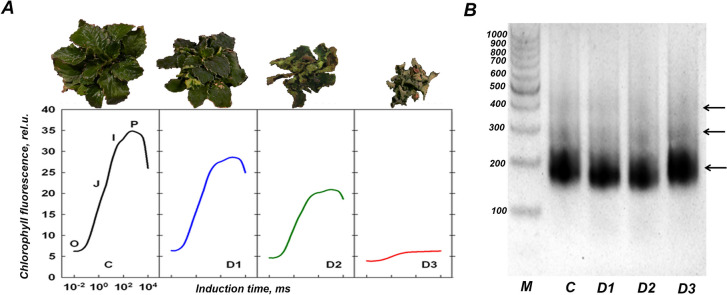
Background: Drought is one of the main consequences of global climate change and this problem is expected to intensify in the future. Resurrection plants evolved the ability to withstand the negative impact of long periods of almost complete desiccation and to recover at rewatering. In this respect, many physiological, transcriptomic, proteomic and genomic investigations have been performed in recent years, however, few epigenetic control studies have been performed on these valuable desiccation-tolerant plants so far.
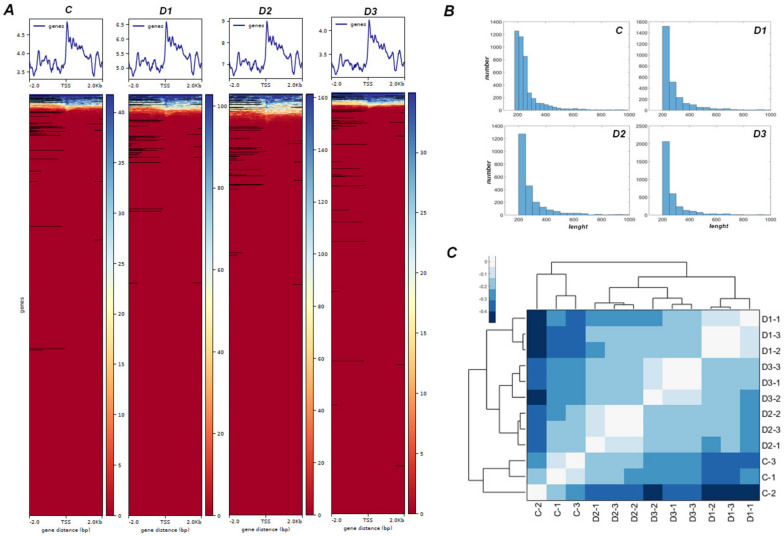
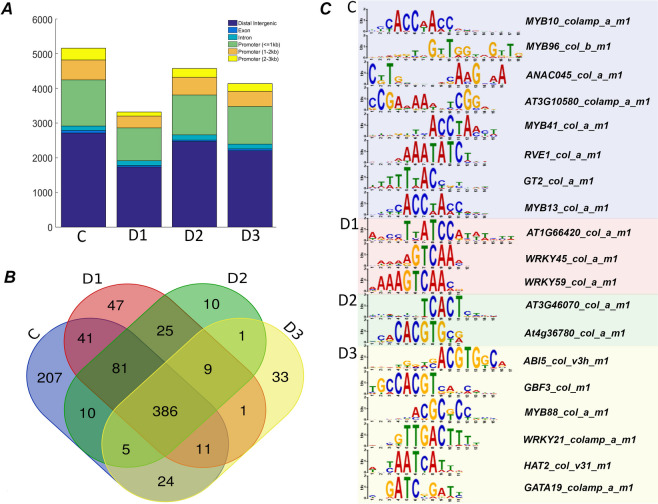
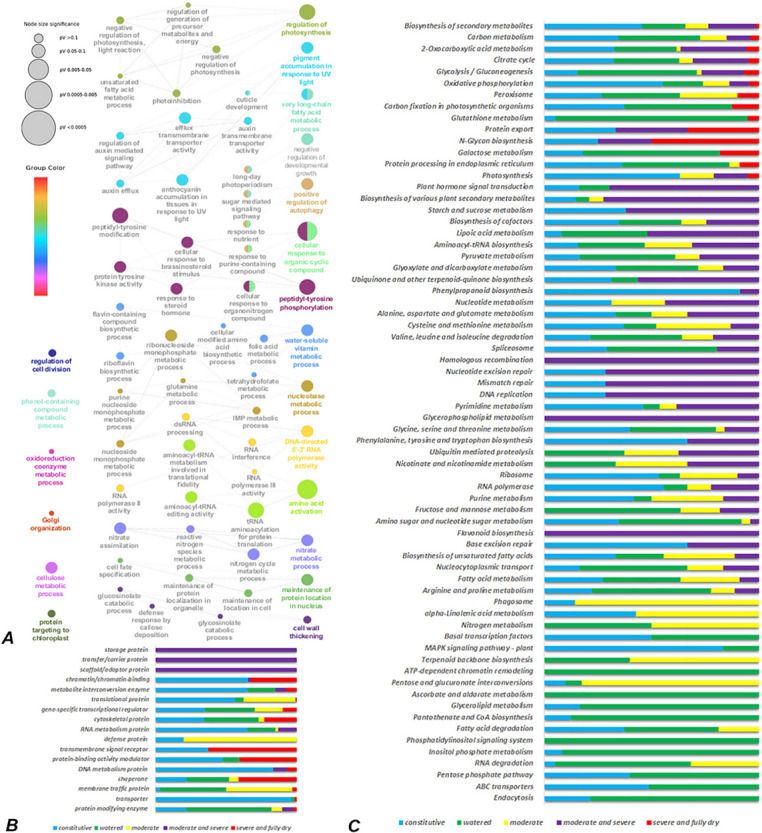
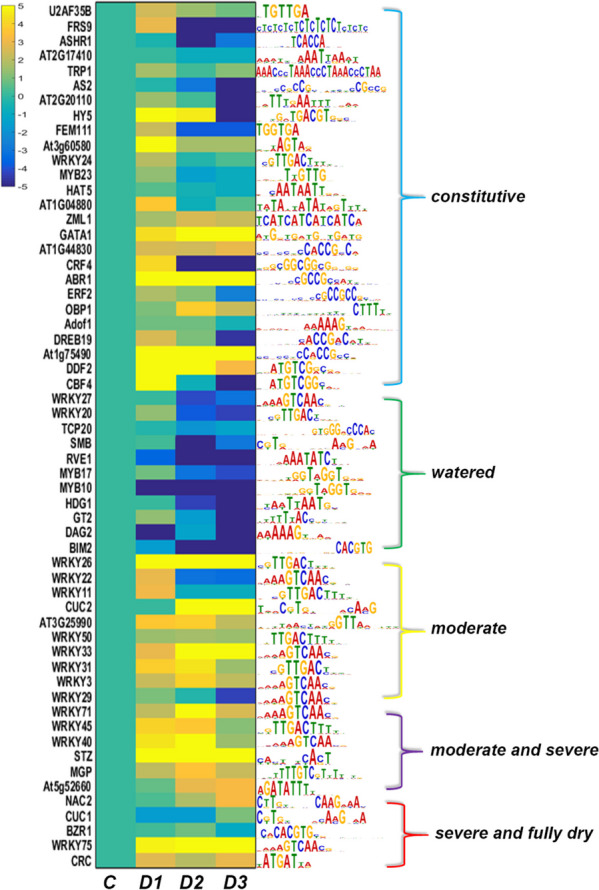
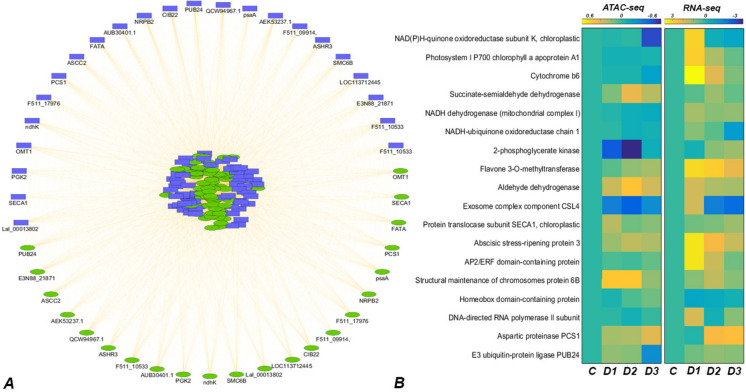
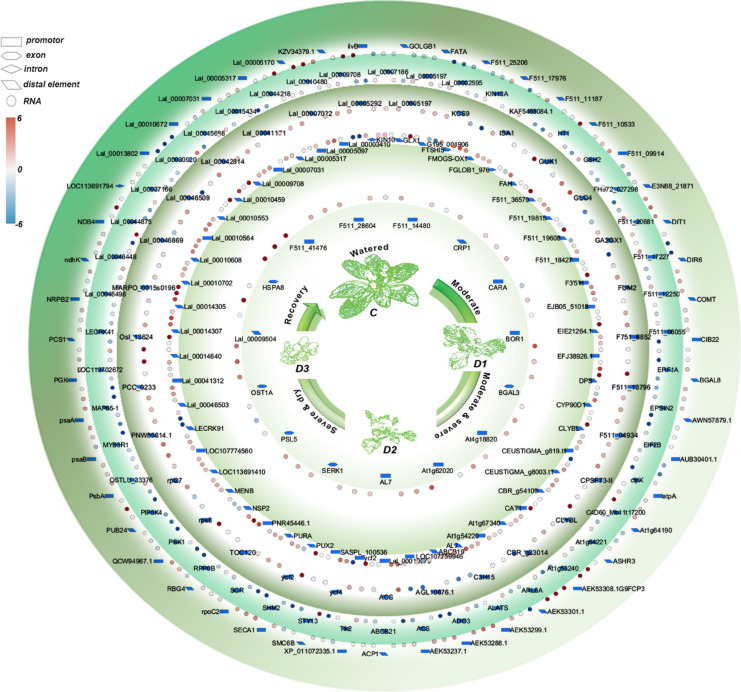
Results: In the present study, for the first time for resurrection plants we provide evidences about the differential chromatin accessibility of Haberlea rhodopensis during desiccation stress by ATAC-seq (Assay for Transposase Accessible Chromatin with high-throughput sequencing). Based on gene similarity between species, we used the available genome of the closely related resurrection plant Dorcoceras hygrometricum to identify approximately nine hundred transposase hypersensitive sites (THSs) in H. rhodopensis. The majority of them corresponds to proximal and distal regulatory elements of different genes involved in photosynthesis, carbon metabolism, synthesis of secondary metabolites, cell signalling and transcriptional regulation, cell growth, cell wall, stomata conditioning, chaperons, oxidative stress, autophagy and others. Various types of binding motifs recognized by several families of transcription factors have been enriched from the THSs found in different stages of drought. Further, we used the previously published RNA-seq data from H. rhodopensis to evaluate the expression of transcription factors putatively interacting with the enriched motifs, and the potential correlation between the identified THS and the expression of their corresponding genes.
Conclusions: These results provide a blueprint for investigating the epigenetic regulation of desiccation tolerance in resurrection plant H. rhodopensis and comparative genomics between resurrection and non-resurrection species with available genome information.
Keywords: ATAC-seq; Desiccation tolerance; Epigenetic regulation; Gene expression; Resurrection plants; Transcription factors.
© 2023. The Author(s).
Conflict of interest statement
The authors declare no competing interests.
Figures
Similar articles
-
Proteomics Evidence of a Systemic Response to Desiccation in the Resurrection Plant Haberlea rhodopensis.Int J Mol Sci. 2022 Jul 31;23(15):8520. doi: 10.3390/ijms23158520. Int J Mol Sci. 2022. PMID: 35955654 Free PMC article.
-
Analysis of the complete mitochondrial genome sequence of the resurrection plant Haberlea rhodopensis.Acta Biochim Pol. 2021 May 12;68(2):277-286. doi: 10.18388/abp.2020_5555. Acta Biochim Pol. 2021. PMID: 33979512
-
Molecular mechanisms of desiccation tolerance in resurrection plants.Cell Mol Life Sci. 2012 Oct;69(19):3175-86. doi: 10.1007/s00018-012-1088-0. Epub 2012 Jul 26. Cell Mol Life Sci. 2012. PMID: 22833170 Free PMC article. Review.
-
Sugar ratios, glutathione redox status and phenols in the resurrection species Haberlea rhodopensis and the closely related non-resurrection species Chirita eberhardtii.Plant Biol (Stuttg). 2011 Sep;13(5):767-76. doi: 10.1111/j.1438-8677.2010.00436.x. Epub 2011 Feb 15. Plant Biol (Stuttg). 2011. PMID: 21815981
-
Gesneriads, a Source of Resurrection and Double-Tolerant Species: Proposal of New Desiccation- and Freezing-Tolerant Plants and Their Physiological Adaptations.Biology (Basel). 2023 Jan 10;12(1):107. doi: 10.3390/biology12010107. Biology (Basel). 2023. PMID: 36671798 Free PMC article. Review.
Cited by
-
Resurrection Plants-A Valuable Source of Natural Bioactive Compounds: From Word-of-Mouth to Scientifically Proven Sustainable Use.Metabolites. 2024 Feb 7;14(2):113. doi: 10.3390/metabo14020113. Metabolites. 2024. PMID: 38393005 Free PMC article. Review.
-
Epigenetic Modifications of Hormonal Signaling Pathways in Plant Drought Response and Tolerance for Sustainable Food Security.Int J Mol Sci. 2024 Jul 28;25(15):8229. doi: 10.3390/ijms25158229. Int J Mol Sci. 2024. PMID: 39125799 Free PMC article. Review.
References
-
- Huang J, Ji M, Xie Y, Wang S, He Y, Ran J. Global semi-arid climate change over last 60 years. Clim Dyn. 2016;46:1131–1150. doi: 10.1007/s00382-015-2636-8. - DOI
-
- Porembski S. Evolution. Diversity, and habitats of poikilohydrous vascular plants. In: Lüttge U, Beck E, Bartels D, editors. Plant Desiccation Tolerance. Berlin, Heidelberg: Springer; 2011. pp. 139–156.
MeSH terms
Substances
Grants and funding
LinkOut - more resources
Full Text Sources
