. 2023 Dec 19;20(1):304.
doi: 10.1186/s12974-023-02989-2.

Targeting CB2R in astrocytes for Parkinson's disease therapy: unraveling the Foxg1-mediated neuroprotective mechanism through autophagy-mediated NLRP3 degradation

Affiliations

Targeting CB2R in astrocytes for Parkinson's disease therapy: unraveling the Foxg1-mediated neuroprotective mechanism through autophagy-mediated NLRP3 degradation

Hong Zhu et al. J Neuroinflammation. .

Abstract

Background: Inflammasomes in astrocytes have been shown to play a crucial role in the pathogenesis of neurodegenerative diseases such as Parkinson's disease (PD) and Alzheimer's disease (AD). Cannabinoid Receptor 2(CB2R), a G protein-coupled receptor (GPCR), is considered a promising therapeutic target in inflammation-related disorders. This study aims to explore the role of CB2R in regulating NOD-like receptor family pyrin domain containing 3 (NLRP3)-mediated neuroinflammation in astrocytes.

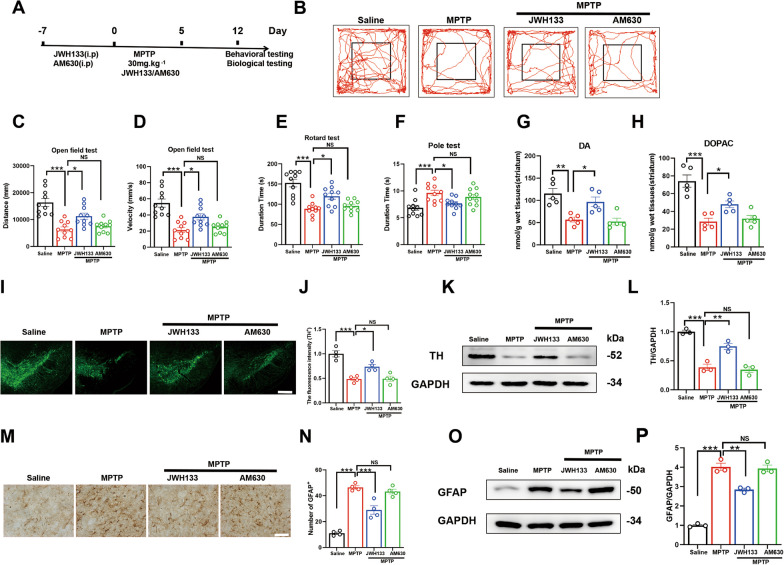
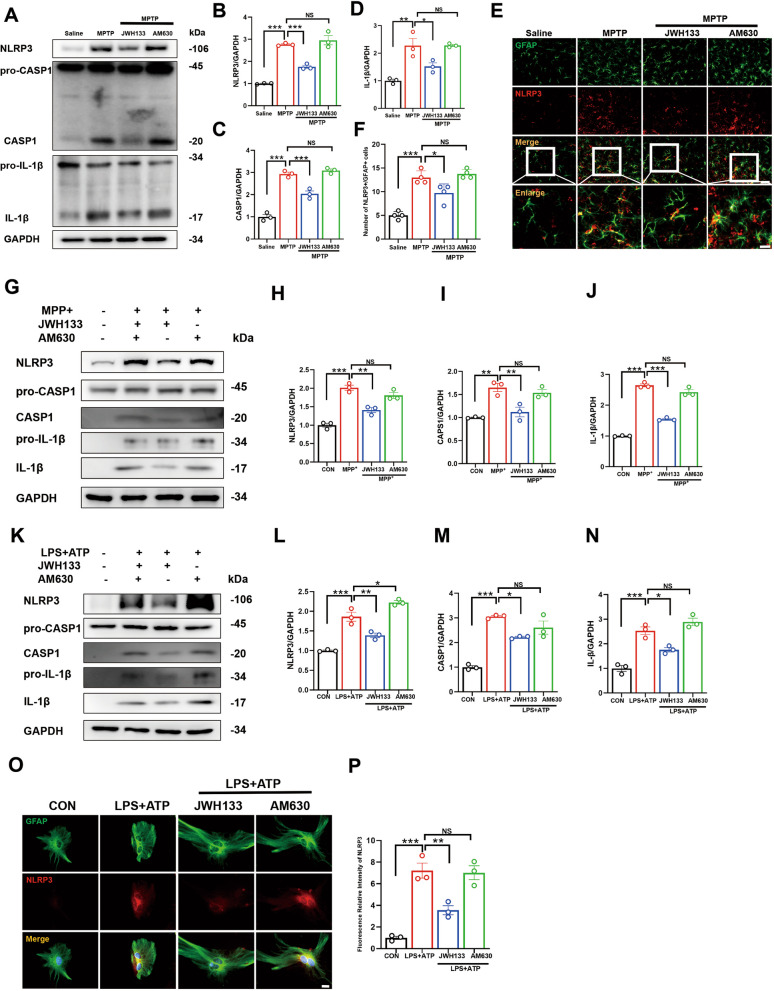
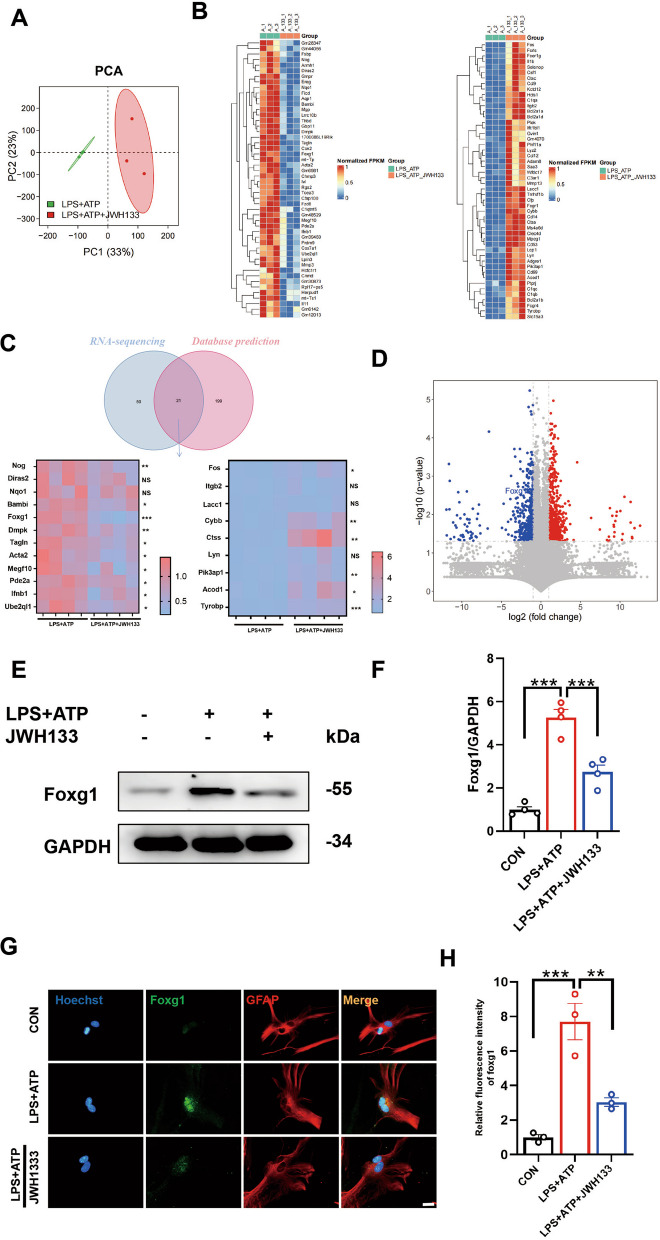
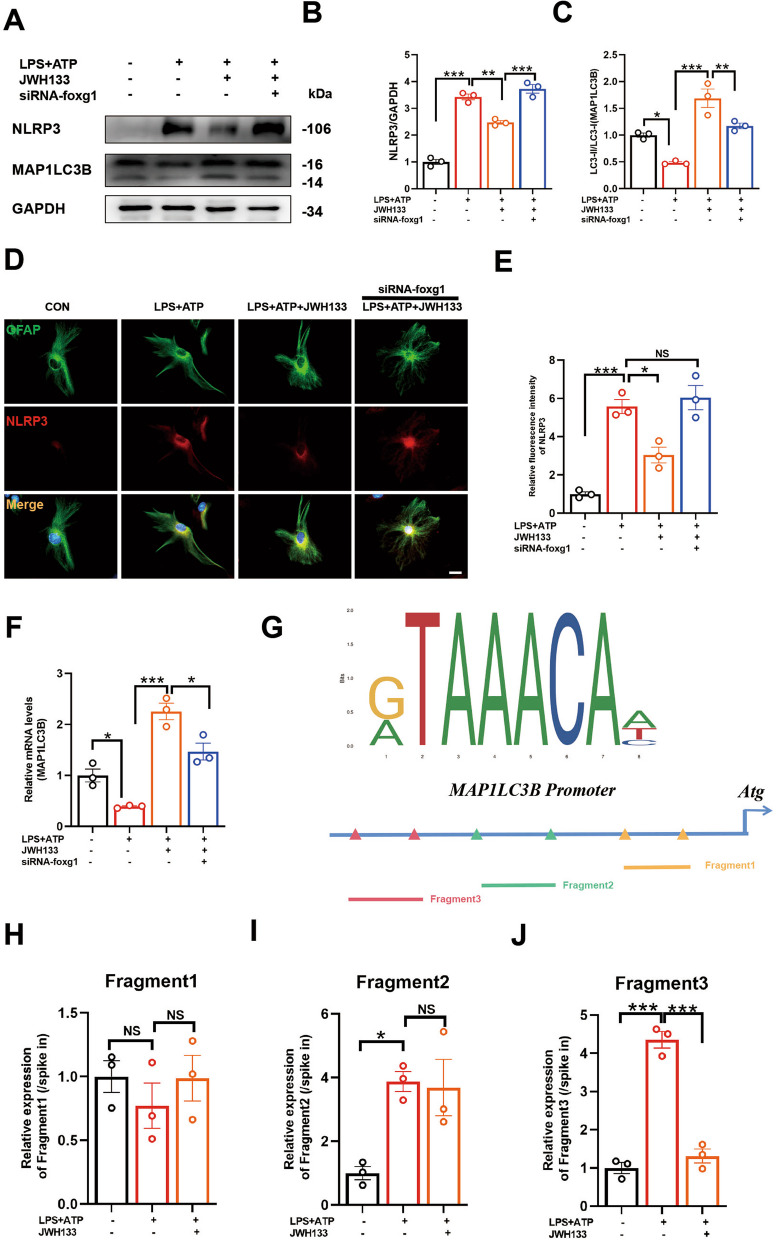
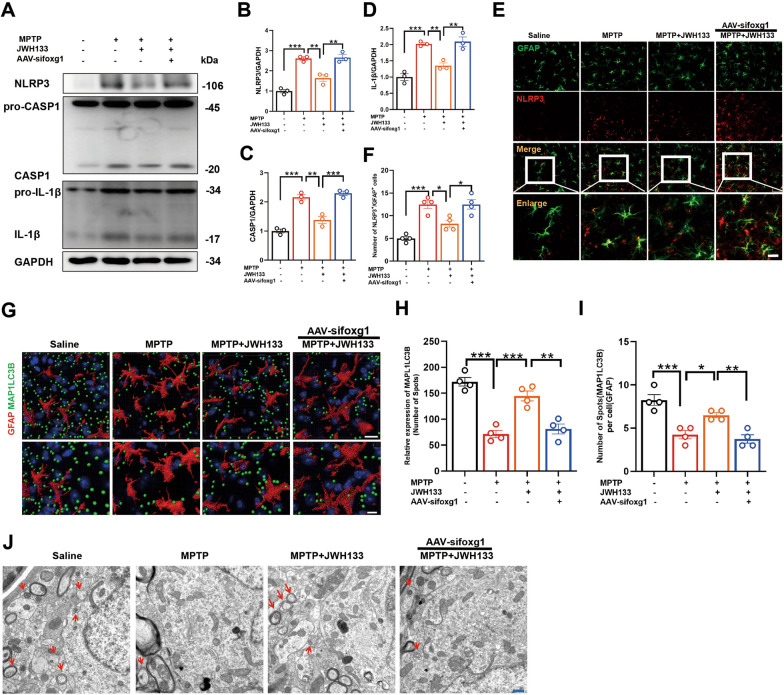
Methods: In an in vivo animal model, specific targeting of astrocytic CB2R was achieved by injecting CB2R-specific adenovirus (or fork head box g1(foxg1) adenovirus) to knock down CB2R or administering CB2R agonists, inhibitors, etc., in the substantia nigra pars compacta (SNc) of mice. A PD mouse model was established using 1-methyl-4-phenyl-1,2,3,6-tetrahydropyridine (MPTP) induction. Animal behavioral tests, western blot, immunofluorescence, and other experiments were performed to assess the loss of midbrain tyrosine hydroxylase (TH) neurons, activation of astrocytes, and activation of the NLRP3 pathway. Primary astrocytes were cultured in vitro, and NLRP3 inflammasomes were activated using 1-methyl-4-phenylpyridinium (MPP+) or lipopolysaccharide (LPS) and adenosine triphosphate (ATP). Western blot and ELISA experiments were conducted to assess the release of inflammatory factors. Transcriptomic sequencing and CUT&RUN techniques were employed to study the CB2R regulation of the foxg1 binding site on the autophagy molecule microtubule-associated protein 1 light chain 3 beta (MAP1LC3B).

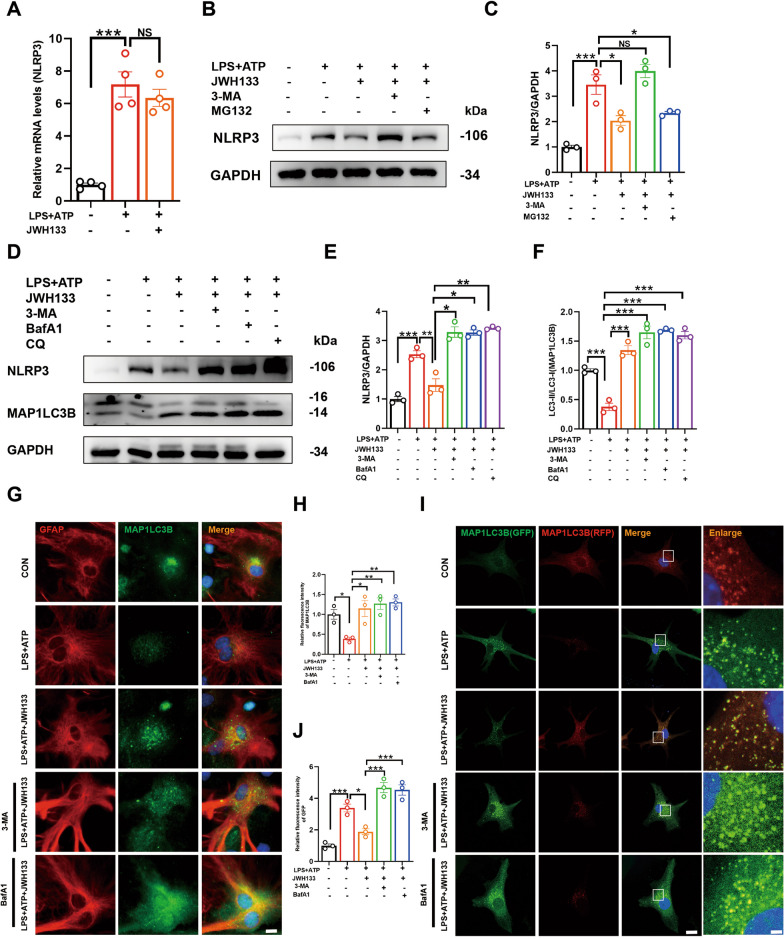
Results: Astrocytic CB2R knockdown impaired the motor abilities of MPTP-induced mice, exacerbated the loss of TH neurons, and induced activation of the NLRP3/Caspase-1/interleukin 1 (IL-1β) pathway. Activation of CB2R significantly alleviated motor impairments in mice while reducing NLRP3 deposition on astrocytes. In vitro cell experiments showed that CB2R activation attenuated the activation of the NLRP3/Caspase-1/IL-1β pathway induced by LPS + ATP or MPP+. Additionally, it inhibited the binding of foxg1 to MAP1LC3B, increased astrocytic autophagy levels, and facilitated NLRP3 degradation through the autophagy-lysosome pathway.

Conclusion: Activation of CB2R on astrocytes effectively mitigates NLRP3-mediated neuroinflammation and ameliorates the disease characteristics of PD in mice. CB2R represents a potential therapeutic target for treating PD.

Keywords: Autophagy; CB2R; NLRP3; Parkinson disease.


Conflict of interest statement

The authors declare that they have no competing interests.

Figures

Fig. 1
Fig. 1
Knockdown of CB2R on astrocytes exacerbates the pathology of MPTP-induced PD mice. A Schematic representation of the experimental procedure. The CB2R -AAVs were injected into the midbrain of mice, and after 4 weeks, the mice were induced with MPTP to establish a subacute PD model. Behavioral and biological tests were performed in the following weeks. B The trajectory of the mice in the open field test, with statistical data for distance traveled and velocity shown in C and D, respectively (n = 10). Time recorded for each mouse in the pole test (E) and rotarod test (F), respectively (n = 10). G, H Determination of DA and DOPAC neurotransmitter levels in the striatum of mice by HPLC (n = 5). I Immunohistochemistry staining for TH-positive neurons in the midbrain of mice (scale bar, 200 μm and 100 μm), with stereological counts shown in J (n = 5). K Detection of TH protein expression in the midbrain of mice by western blot, with quantification shown in L (n = 3). M Immunofluorescence detection of activated astrocytes in the midbrain of mice using GFAP as a marker (scale bar, 200 μm and 100 μm), with fluorescence quantification shown in N (n = 4). O Detection of GFAP protein expression in the midbrain of mice by Western blot, with quantification shown in P (n = 3). NS means not significant, *P < 0.05, **P < 0.01, ***P < 0.001 compared with the corresponding group, as determined by the two-way ANOVA followed by Tukey’s post hoc test
Fig. 2
Fig. 2
Activation of CB2R as a key mechanism for alleviating neurodegeneration in MPTP-induced PD mice. A Subcutaneous injection of MPTP to establish a subacute PD model. During MPTP administration, the relevant groups were also given JWH133 (3 μg) or AM630 (3 μg). Behavioral and biological tests were performed in the following weeks. B The trajectory of the mice in the open field test, with distance traveled and time shown in C and D, respectively (n = 10). Time recorded for each mouse in the rotarod test (E) and pole test (F), respectively (n = 10). G, H Determination of DA and DOPAC neurotransmitter levels in the striatum of mice by HPLC (n = 5). I Immunofluorescence staining for TH-positive neurons in the midbrain of mice (scale bar, 200 μm), with statistics of data shown in J (n = 4). K Detection of TH protein expression in the midbrain of mice by Western blot, with quantification shown in L (n = 3). M Immunohistochemistry staining for activated astrocytes in the midbrain of mice (scale bar, 200 μm and 100 μm), with quantification shown in N (n = 4). O Detection of GFAP protein expression in the midbrain of mice by western blot, with quantification shown in P (n = 3). NS means not significant, *P < 0.05, **P < 0.01, ***P < 0.001 compared with the corresponding group, as determined by the one-way ANOVA
Fig. 3
Fig. 3
CB2R activation mitigates neuroinflammation in PD through inhibition of the NLRP3/Caspase-1/IL-1β Pathway. A Detection of protein levels for NLRP3, Caspase-1, pro-Caspase-1, IL-1β, and pro-IL-1β in the midbrain tissue by Western blot, with quantification shown in panels B, C, and D (n = 3). E Immunofluorescence staining for GFAP (green) and NLRP3 (red) in midbrain tissue of mice, with quantification shown in panel F (n = 4). Cells were treated with JWH133 (1 μM) or AM630 (1 μM) for one hour prior to stimulation with 100 μM MPP+ for 24 h. G Detection of protein levels for NLRP3, pro-Caspase-1, Caspase-1, IL-1β, and pro-IL-1β in the cells by western blot, with quantification shown in panels HJ (for 3 independent experiments). Cells were treated with JWH133 or AM630 for 1 h prior to incubation with 100 ng/mL LPS for 6 h, and then stimulated with ATP for 30 min before harvesting cell protein. K Detection of protein levels for NLRP3, pro-Caspase-1, Caspase-1, IL-1β, and pro-IL-1β in the cells by western blot, with quantification shown in panels LN (for 3 independent experiments). O Immunofluorescence staining for GFAP (green) and NLRP3 (red) in astrocytes and the fluorescence intensity statistics of NLRP3 in P (for 3 independent experiments). NS means not significant, *P < 0.05, **P < 0.01, ***P < 0.001 compared with the corresponding group, as determined by the one-way ANOVA
Fig. 4
Fig. 4
A key mechanism for CB2R-induced degradation of NLRP3 protein via autophagolysosomal pathway. A validation of NLRP3 mRNA levels in cells by Q-PCR (for 4 independent experiments). Primary astrocytes were pre-treated with 3-MA(5 mM) or MG132 (10 μM) for 2 h, followed by treatment with JWH133 for 1 h, and then stimulated with LPS (100 ng/mL, 6 h) and ATP (5 mM, 30 min). Protein levels of NLRP3 in cells were detected by Western blotting (B, C, for 3 independent experiments). Primary astrocytes were pre-treated with 3-MA, BafA1 (100 nM), or CQ (10 μM) for 2 h, followed by treatment with JWH133 for 1 h, and then stimulated with LPS (100 ng/mL, 6 h) and ATP (5 mM, 30 min). Expression of NLRP3 and MAP1LC3B proteins in cells was verified by western blotting (D), and quantified in E, F (for 3 independent experiments). G Primary astrocytes were treated in the same manner as described above, and immunofluorescence staining was used to analyze GFAP and MAP1LC3B in cells. Fluorescence analysis was quantified and shown in H (for 3 independent experiments). I Primary astrocytes were transfected with RFP-GFP-MAP1LC3B adenovirus for approximately 72 h, and then treated with drugs before observation under a confocal microscope. Fluorescence quantification analysis is shown in J (for 3 independent experiments). NS means not significant, *P < 0.05, **P < 0.01, ***P < 0.001 compared with the corresponding group, as determined by the one-way ANOVA
Fig. 5
Fig. 5
Foxg1 is a crucial regulatory molecule for CB2R-mediated autophagy promotion. A Principal Component Analysis (PCA) plot depicting the transcriptomic profiles of (specify the samples or conditions being compared). Each data point represents an individual sample, and the plot reveals the multidimensional relationships between samples based on their gene expression patterns. B Differential genes between LPS + ATP vs LPS + ATP + JWH133 groups (downregulated genes on the left, upregulated genes on the right). C The study involves retrieving the intersection between genes in a database and genes associated with sequencing changes. Subsequently, approximately 20 genes from this intersection will be selected for qPCR analysis. D Location of foxg1 among differentially expressed genes in volcano plot. E Western blot analysis was performed to assess the expression of foxg1. The corresponding representative blot is presented in F (for 4 independent experiments.). G Immunofluorescent staining of primary astrocytes (foxg1 is green, GFAP is red), and the fluorescence intensity statistics of foxg1 are shown in H (for 3 independent experiments). NS means not significant, *P < 0.05, **P < 0.01, ***P < 0.001 compared with the corresponding group, as determined by the one-way ANOVA
Fig. 6
Fig. 6
Foxg1 is a crucial regulatory molecule for CB2R-mediated autophagy promotion. A Protein detection of NLRP3 and MAP1LC3B in primary astrocytes. Statistical data for the proteins are presented in B, C, respectively (for 3 independent experiments). D Immunofluorescence staining of primary astrocytes showing GFAP (green fluorescence) marking astrocytes and NLRP3 protein (red fluorescence) detection. Fluorescence intensity data for NLRP3 are shown in E (for 3 independent experiments). F Expression levels of MAP1LC3B mRNA detected using Q-PCR (For 3 independent experiments). G Potential binding sites of foxg1 on the promoter region of MAP1LC3B. Three putative binding sites of foxg1 on the promoter region of MAP1LC3B were identified using cut&run assay (HJ, for 3 independent experiments). NS means not significant, *P < 0.05, **P < 0.01, ***P < 0.001 compared with the corresponding group, as determined by the one-way ANOVA
Fig. 7
Fig. 7
Knockdown of foxg1 exacerbates MPTP-induced PD-like symptoms in mice. A Experimental flow chart. Mice were injected with foxg1 AAVs into the midbrain 30 days prior to the experiment (green indicates midbrain astrocytes marked with GFAP, and red indicates the injected adenovirus, with a scale bar of 50 μm). Approximately 23 days later, mice were intraperitoneally injected with CB2R agonist JWH133 for 7 consecutive days. Subsequently, mice were subcutaneously injected with MPTP for 5 consecutive days, and JWH133 was also injected during these 5 days. Behavioral and biological tests of mice were performed thereafter. B The trajectory of the mice in the open field test, with distance traveled and time shown in C and D (n = 10), respectively. E, F Time recorded for each mouse in the rotarod test and pole test, respectively (n = 10). G Immunohistochemistry staining for TH-positive neurons in the midbrain of mice (scale bar, 200 μm), with stereological counts shown in H (n = 5). I Immunofluorescence detection of activated astrocytes in the midbrain of mice using GFAP as a marker (scale bar, 200 μm in the top panel, 100 μm in the bottom panel), with fluorescence quantification shown in J (n = 4). K, L Western blot detection of TH expression in midbrain and corresponding statistical data (n = 3). NS means not significant, *P < 0.05, **P < 0.01, ***P < 0.001 compared with the corresponding group, as determined by the one-way ANOVA
Fig. 8
Fig. 8
Knockdown of foxg1 hampers autophagic response in astrocytes and inhibits NLRP3 degradation. A Detection of protein levels for NLRP3, Caspase1, pro-Caspase1, IL-1β, and pro-IL-1β in the midbrain tissue by western blot, with quantification shown in panels BD (n = 4). E Immunofluorescence staining for GFAP (green) and NLRP3 (red) in midbrain tissue of mice, with quantification shown in panel FH (n = 4). G Mouse midbrain GFAP (red) and MAP1LC3B (green) immunofluorescence staining, the captured image was processed by imaris software, and the fluorescence statistics are shown in H, I (n = 4). J Autophagosomes (marked by red arrows) observed by transmission electron microscope in mouse midbrain tissue. NS means not significant, *P < 0.05, **P < 0.01, ***P < 0.001 compared with the corresponding group, as determined by the one-way ANOVA
Fig. 9
Fig. 9
Targeting CB2R in astrocytes for Parkinson's disease therapy: unraveling the foxg1-mediated neuroprotective mechanism through autophagy-mediated NLRP3 degradation. activation of CB2R reduced the binding of foxg1 to the promoter region of MAP1LC3B, thereby promoting the transcription of MAP1LC3B and increasing the autophagic level in astrocytes. This led to an enhanced autophagic degradation of NLRP3 and a reduction in the release of caspase-1 and IL-1β. As a result, neurodegeneration was alleviated in PD mice. These findings suggest that CB2R activation plays a crucial role in regulating autophagy and may serve as a potential therapeutic target for neurodegenerative disorders

Similar articles

Cited by

References

    1. Ye H, Robak LA, Yu M, Cykowski M, Shulman JM. Genetics and pathogenesis of Parkinson's syndrome. Annu Rev Pathol. 2023;18:95–121. doi: 10.1146/annurev-pathmechdis-031521-034145. - DOI - PMC - PubMed
    1. Wei Y, Lu M, Mei M, Wang H, Han Z, Chen M, Yao H, Song N, Ding X, Ding J, Xiao M, Hu G. Pyridoxine induces glutathione synthesis via PKM2-mediated Nrf2 transactivation and confers neuroprotection. Nat Commun. 2020;11:941. doi: 10.1038/s41467-020-14788-x. - DOI - PMC - PubMed
    1. Liddelow SA, Guttenplan KA, Clarke LE, Bennett FC, Bohlen CJ, Schirmer L, Bennett ML, Münch AE, Chung WS, Peterson TC, Wilton DK, Frouin A, Napier BA, et al. Neurotoxic reactive astrocytes are induced by activated microglia. Nature. 2017;541:481–487. doi: 10.1038/nature21029. - DOI - PMC - PubMed
    1. Kwon HS, Koh SH. Neuroinflammation in neurodegenerative disorders: the roles of microglia and astrocytes. Transl Neurodegener. 2020;9:42. doi: 10.1186/s40035-020-00221-2. - DOI - PMC - PubMed
    1. Zhu J, Hu Z, Han X, Wang D, Jiang Q, Ding J, Xiao M, Wang C, Lu M, Hu G. Dopamine D2 receptor restricts astrocytic NLRP3 inflammasome activation via enhancing the interaction of β-arrestin2 and NLRP3. Cell Death Differ. 2018;25:2037–2049. doi: 10.1038/s41418-018-0127-2. - DOI - PMC - PubMed

MeSH terms