. 2023 Dec 18;24(1):319.
doi: 10.1186/s12931-023-02634-9.

Role of mitochondrial fusion proteins MFN2 and OPA1 on lung cellular senescence in chronic obstructive pulmonary disease

Affiliations

Role of mitochondrial fusion proteins MFN2 and OPA1 on lung cellular senescence in chronic obstructive pulmonary disease

Chenfei Li et al. Respir Res. .

Abstract

Background: Mitochondrial dysfunction and lung cellular senescence are significant features involved in the pathogenesis of chronic obstructive pulmonary disease (COPD). Cigarette smoke (CS) stands as the primary contributing factor to COPD. This study examined mitochondrial dynamics, mitophagy and lung cellular senescence in COPD patients and investigated the effects of modulation of mitochondrial fusion [mitofusin2 (MFN2) and Optic atrophy 1 (OPA1)] on CS extract (CSE)-induced lung cellular senescence.

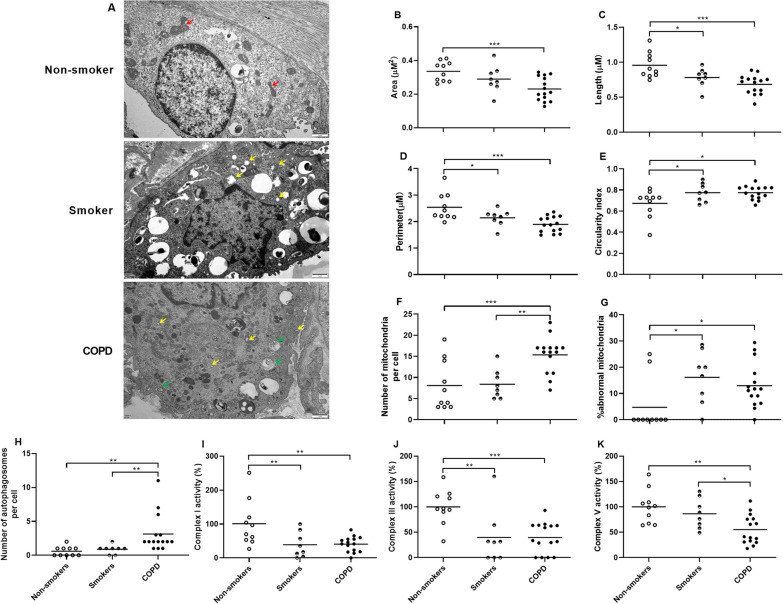
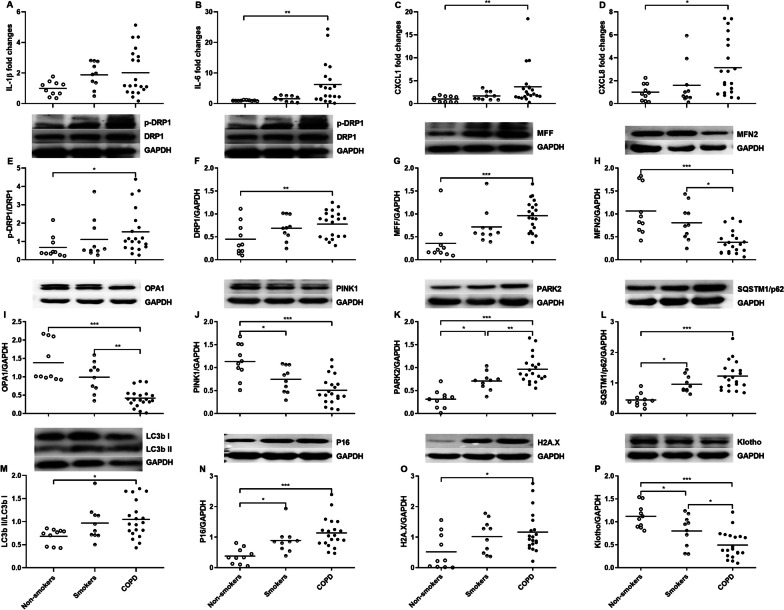
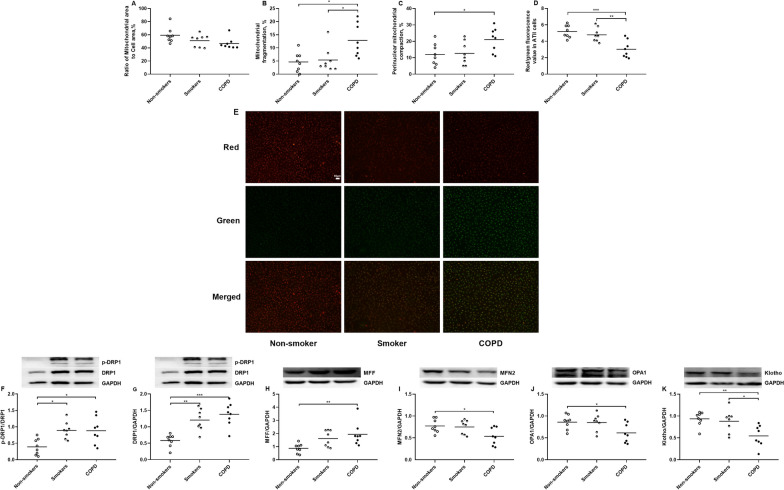
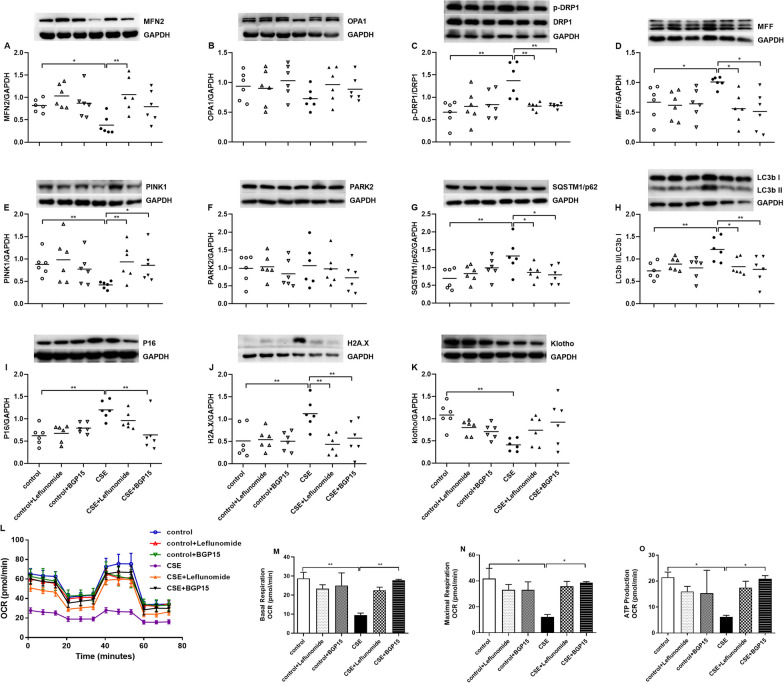
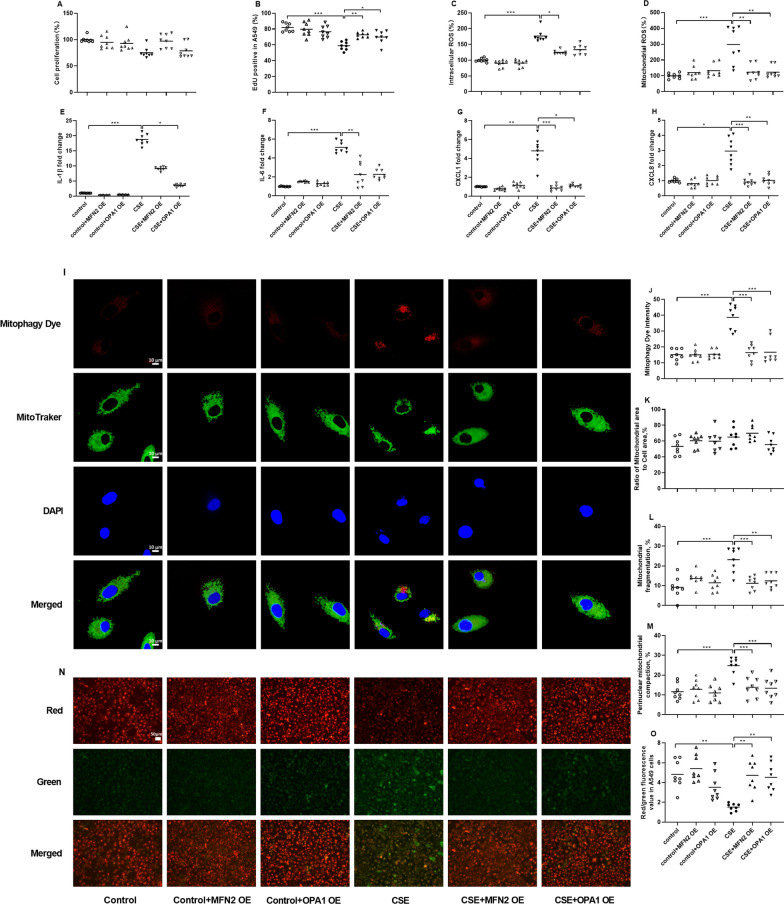
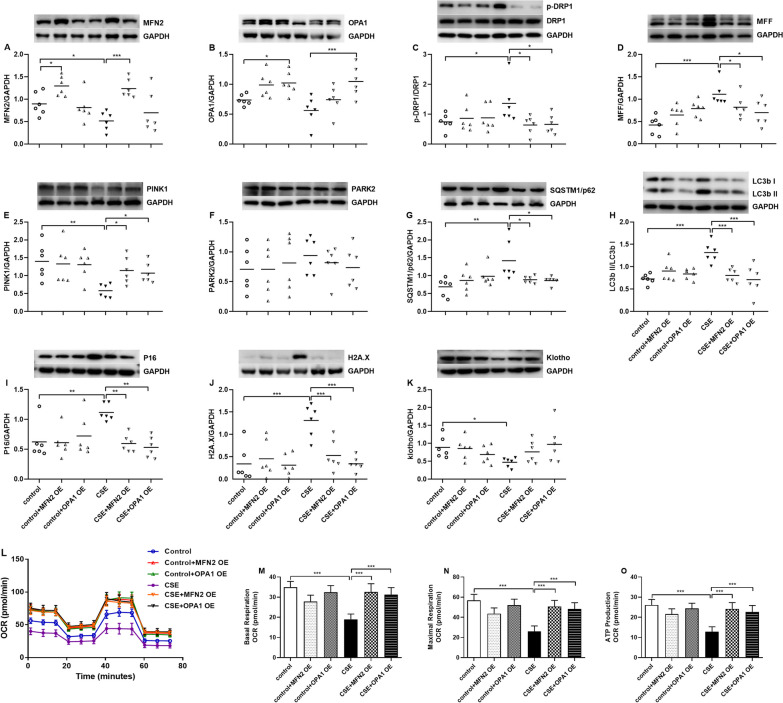
Methods: Senescence-associated secretory phenotype (SASP) component mRNAs (IL-1β, IL-6, CXCL1 and CXCL8), mitochondrial morphology, mitophagy and mitochondria-related proteins (including phosphorylated-DRP1(p-DRP1), DRP1, MFF, MNF2, OPA1, PINK1, PARK2, SQSTM1/p62 and LC3b) and senescence-related proteins (including P16, H2A.X and Klotho) were measured in lung tissues or primary alveolar type II (ATII) cells of non-smokers, smokers and COPD patients. Alveolar epithelial (A549) cells were exposed to CSE with either pharmacologic inducer (leflunomide and BGP15) or genetic induction of MFN2 and OPA1 respectively.

Results: There were increases in mitochondrial number, and decreases in mitochondrial size and activity in lung tissues from COPD patients. SASP-related mRNAs, DRP1 phosphorylation, DRP1, MFF, PARK2, SQSTM1/p62, LC3B II/LC3B I, P16 and H2A.X protein levels were increased, while MFN2, OPA1, PINK1 and Klotho protein levels were decreased in lung tissues from COPD patients. Some similar results were identified in primary ATII cells of COPD patients. CSE induced increases in oxidative stress, SASP-related mRNAs, mitochondrial damage and dysfunction, mitophagy and cellular senescence in A549 cells, which were ameliorated by both pharmacological inducers and genetic overexpression of MFN2 and OPA1.

Conclusions: Impaired mitochondrial fusion, enhanced mitophagy and lung cellular senescence are observed in the lung of COPD patients. Up-regulation of MFN2 and OPA1 attenuates oxidative stress, mitophagy and lung cellular senescence, offering potential innovative therapeutic targets for COPD therapy.

Keywords: Chronic obstructive pulmonary disease (COPD); Cigarette smoke; Lung senescence; Mitochondrial dynamics; Mitophagy.


Conflict of interest statement

The authors declare that they have no competing interests.

Figures

Fig. 1
Fig. 1
Morphology and function of mitochondria of non-smokers (n = 10), smokers (n = 8) and COPD patients (n = 15). Representative ultrastructure of mitochondrial morphology in the alveolar type II (ATII) cell of non-smoker, smoker and COPD patient is obtained by Transmission electron microscopy (TEM) (A). Red arrows indicate elongated mitochondria, yellow arrows indicate abnormal mitochondria (mitochondria with impaired membrane and cristae arrangements) and green arrows indicate autophagosomes. The scale bar is 1 μm. Quantification of mitochondrial morphology including area (B), length (C), perimeter (D), circularity index (E), number of mitochondria per cell (F), percentage of abnormal mitochondria (G) and number of autophagosomes (H) is conducted by Image J analysis. The mitochondrial respiratory chain (MRC) complexes I (I), III (J) and V (K) activities are assessed using an activity assay kit, and data are presented as the percentage changes compared to non-smokers. Data are presented as individual and mean values. *p < 0.05, **p < 0.01, ***p < 0.001
Fig. 2
Fig. 2
Expression of senescence-associated secretory phenotype (SASP) components mRNA and mitochondria- and senescence-related proteins in human lung tissues of non-smokers (n = 10), smokers (n = 10) and COPD (n = 20) patients. Quantitative real-time PCR is employed to measure the mRNA levels of interleukin (IL)-1β (A), IL-6 (B), CXCL1 (C), and CXCL8 (D) in relation to β-actin. Data are displayed as individual and mean values of fold changes compared to non-smokers. Mitochondria-related proteins including phosphorylated-DRP1 (p-DRP1)/DRP1 (E), DRP1(F), MFF (G), MFN2 (H), OPA1 (I), PINK1 (J), PARK2 (K) and SQSTM1/p62 (L) and LC3b II/ LC3b I (M), and senescence-related proteins including P16 (N), H2A.X (O) and Klotho (P) are measured by Western blot. Every panel incorporates an illustrative Western blot image, and data are presented as individual and mean values of each protein. *p < 0.05, **p < 0.01, ***p < 0.001
Fig. 3
Fig. 3
Mitochondrial morphology and mitochondria- and senescence-related proteins expression in primary alveolar type II (ATII) cells of non-smokers, smokers and COPD patients. The area of mitochondria (A), and percentage of mitochondrial fragmentation (B) and perinuclear mitochondrial compaction (C) are assessed by MitoTracker Green. Data are presented as the percentage changes compared to non-smokers. The red/green fluorescence value (D) is used to quantify the mitochondrial membrane potential detected by JC-1 staining. N = 8 in each group. Data are presented as individual and mean values. Representative fluorescent microscopy of JC-1 staining in primary ATII cells of non-smoker, smoker and COPD patient (E). The scale bar is 50 μm. Mitochondria-related proteins including phosphorylated-DRP1 (p-DRP1)/DRP1 (F), DRP1 (G), MFF (H), MFN2 (I), OPA1 (J) and senescence-related protein Klotho (K) are measured by Western blot. N = 8 in each group. Every panel incorporates an illustrative Western blot image, and data are presented as individual and mean values of each protein. *p < 0.05, **p < 0.01, ***p < 0.001
Fig. 4
Fig. 4
Effects of leflunomide (10µM) and BGP15 (15µM) on cell proliferation, oxidative stress, senescence-associated secretory phenotype (SASP) components mRNA levels and mitochondrial morphology in A549 cells in the presence and absence of cigarette smoke extract (CSE). Cell viability (A), cell proliferation (B), intracellular ROS (C) and mitochondrial ROS (D) are respectively detected by CCK-8, Edu staining, DCFH-DA and Mito SOX Red, and data are presented as percentage changes compared to control cells. Quantitative real-time PCR is employed to measure the mRNA levels of IL-1β (E), IL-6 (F), CXCL1 (G) and CXCL8 (H) in relation to β-actin, and data are presented as individual and mean values of fold changes compared to control cells. N = 8 in each group. Representative confocal microscopy images of the mitophagy dye fluorescence and Mito-Tracker Green staining (I, original magnification, ×63). The scale bar is 10 μm. The fluorescent intensity of mitophagy (J), the area of mitochondria (K), and percentage of mitochondrial fragmentation (L) and perinuclear mitochondrial compaction (M) are assessed by MitoTracker Green. Representative fluorescent microscopy images of JC-1 staining (N) and JC-1 values (O). The scale bar is 50 μm. N = 8 in each group. Data are presented as individual and mean values. *p < 0.05, **p < 0.01, ***p < 0.001
Fig. 5
Fig. 5
Effects of leflunomide (10µM) and BGP15 (15µM) on mitochondria-related proteins and senescence-related proteins, and oxygen consumption rate (OCR) in A549 cells in the presence and absence cigarette smoke extract (CSE). Mitochondria-related protein levels of MFN2 (A) and OPA1 (B), phosphorylated-DRP1 (p-DRP1)/DRP1 (C), MFF (D), PINK1 (E), PARK2 (F), SQSTM1/p62 (G) and LC3b II/ LC3b I (H) and senescence-related protein levels of P16 (I), H2A.X (J) and Klotho (K) are measured by Western blot. N = 6 in each group. Every panel incorporates an illustrative Western blot image, and the data are presented as individual and mean values of each protein. Results of mitochondrial activities are presented as oxygen consumption rate (OCR) (L), and graphical analysis of basal (M) and maximal (N) respiration and on ATP production (O). N = 4 in each group. *p < 0.05, **p < 0.01, ***p < 0.001
Fig. 6
Fig. 6
Effects of MFN2 overexpression (OE) and OPA1 OE on cell proliferation, oxidative stress, senescence-associated secretory phenotype (SASP) components mRNA levels and mitochondrial morphology in A549 cells in the presence and absence of cigarette smoke extract (CSE). Cell viability (A), cell proliferation (B), intracellular (C) and mitochondrial ROS (D) are respectively detected by CCK-8, Edu staining, DCFH-DA and Mito SOX Red, and data are displayed as percentage changes compared to control cells. Quantitative real-time PCR is employed to measure the mRNA levels of IL-1β (E), IL-6 (F), CXCL1 (G) and CXCL8 (H) in relation to β-actin, and data are displayed as individual and mean values of fold changes compared to control cells. N = 6 in each group. Representative confocal microscopy images of the mitophagy dye fluorescence and Mito-Tracker Green staining (I, original magnification, ×63). The scale bar is 10 μm. The fluorescent intensity of mitophagy (J), the area of mitochondria (K), and percentage of mitochondrial fragmentation (L) and perinuclear mitochondrial compaction (M) are assessed by MitoTracker Green. Representative fluorescent microscopy images of JC-1 staining (N) and JC-1 values (M). The scale bar is 50 μm. N = 8 in each group. Data are presented as individual and mean values. *p < 0.05, **p < 0.01, ***p < 0.001
Fig. 7
Fig. 7
Effects of MFN2 overexpression (OE) and OPA1 OE on mitochondria-related proteins, senescence-related proteins, and oxygen consumption rate (OCR) in A549 cells in the presence and absence of cigarette smoke extract (CSE). Mitochondria-related protein expression levels of MFN2 (A) and OPA1 (B), phosphorylated-DRP1 (p-DRP1)/DRP1 (C), MFF (D), PINK1 (E), PARK2 (F), SQSTM1/p62 (G) and LC3b II/ LC3b I (H), and senescence-related protein levels of P16 (I), H2A.X (J) and Klotho (K) are measured by Western blot. N = 6 in each group. Every panel incorporates an illustrative Western blot image, and the data are presented as individual and mean values of each protein. Results of mitochondrial activities are presented as oxygen consumption rate (OCR) (L) and graphical analysis of basal (M) and maximal (N) respiration and on ATP production (O). N = 4 in each group. *p < 0.05, **p < 0.01, ***p < 0.001

Similar articles

Cited by

References

    1. GBD 2015 Chronic Respiratory Disease Collaborators Global regional, National deaths, prevalence, disability-adjusted life years, and years lived with disability for Chronic Obstructive Pulmonary Disease and Asthma, 1990–2015: a systematic analysis for the global burden of Disease Study 2015. Lancet Respir Med. 2017;5:691–706. doi: 10.1016/S2213-2600(17)30293-X. - DOI - PMC - PubMed
    1. Ito K, Barnes PJ. COPD as a Disease of accelerated lung aging. Chest. 2009;135:173–80. doi: 10.1378/chest.08-1419. - DOI - PubMed
    1. Hara H, Kuwano K, Araya J. Mitochondrial quality control in COPD and IPF. Cells. 2018;7:86. doi: 10.3390/cells7080086. - DOI - PMC - PubMed
    1. Barnes PJ, Baker J, Donnelly LE. Cellular Senescence as a mechanism and target in chronic lung diseases. Am J Respir Crit Care Med. 2019;200:556–64. doi: 10.1164/rccm.201810-1975TR. - DOI - PubMed
    1. Ni H-M, Williams JA, Ding W-X. Mitochondrial dynamics and mitochondrial quality control. Redox Biol. 2015;4:6–13. doi: 10.1016/j.redox.2014.11.006. - DOI - PMC - PubMed

MeSH terms