. 2023 Dec 18;11(1):201.
doi: 10.1186/s40478-023-01704-9.

Cellular and subcellular localization of Rab10 and phospho-T73 Rab10 in the mouse and human brain

Affiliations

Cellular and subcellular localization of Rab10 and phospho-T73 Rab10 in the mouse and human brain

Vijay Singh et al. Acta Neuropathol Commun. .

Abstract

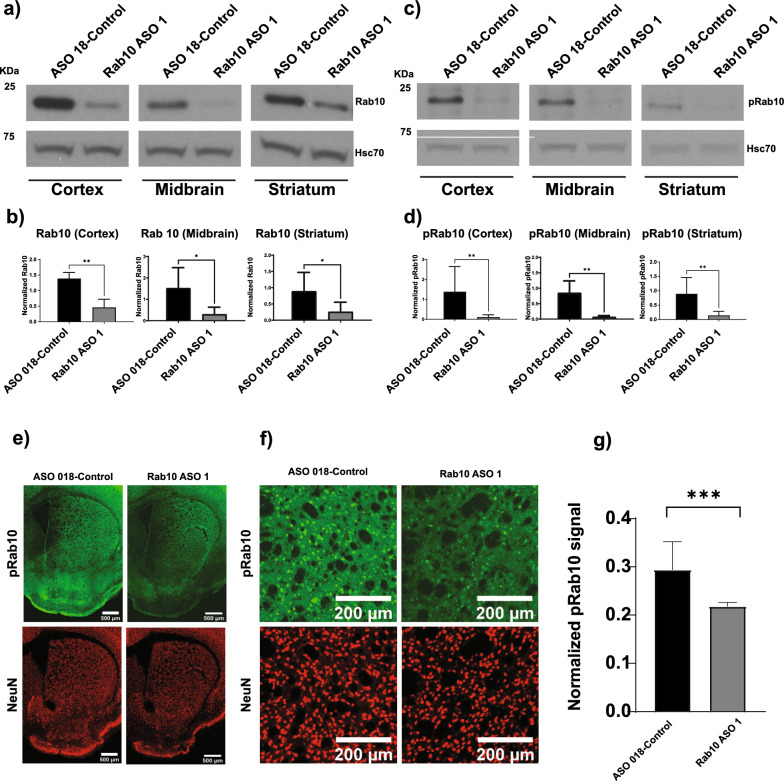
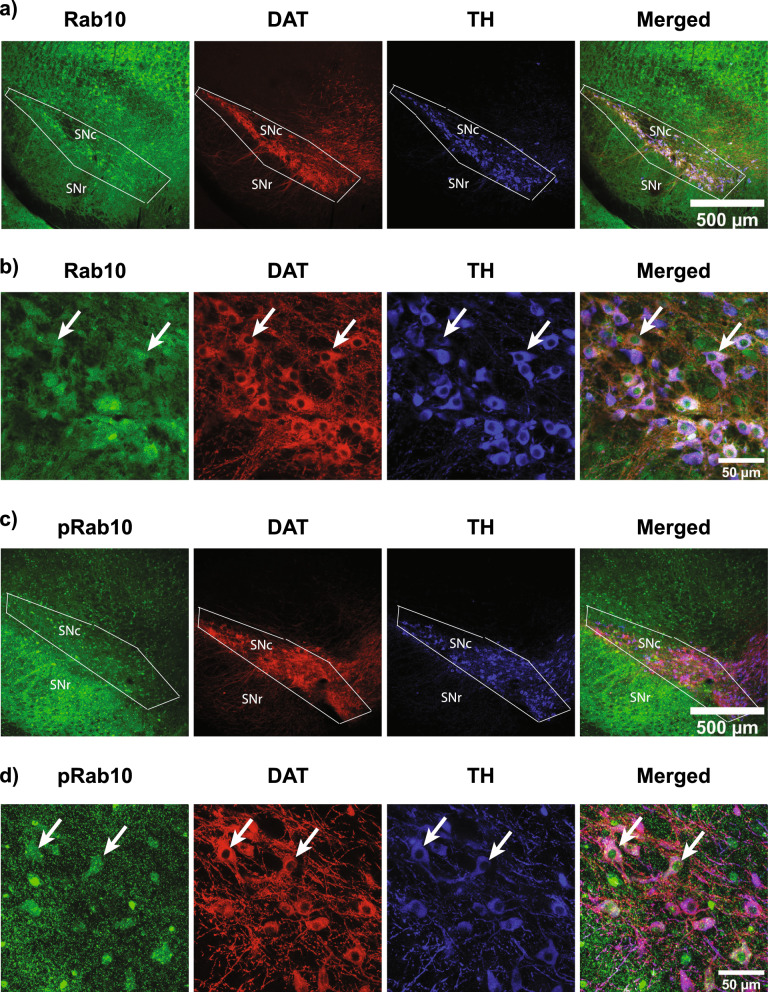
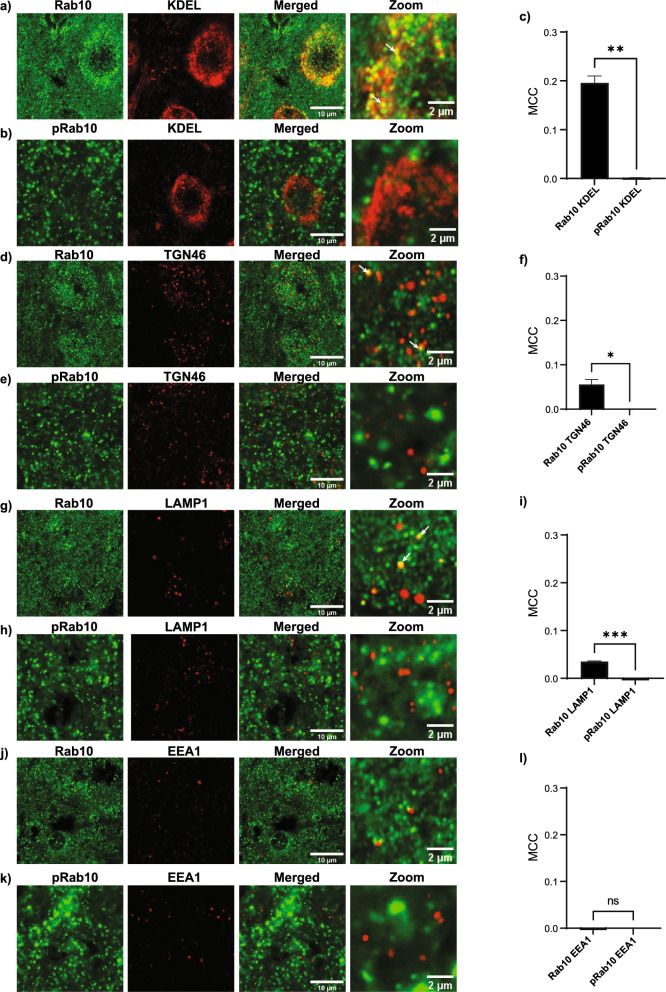
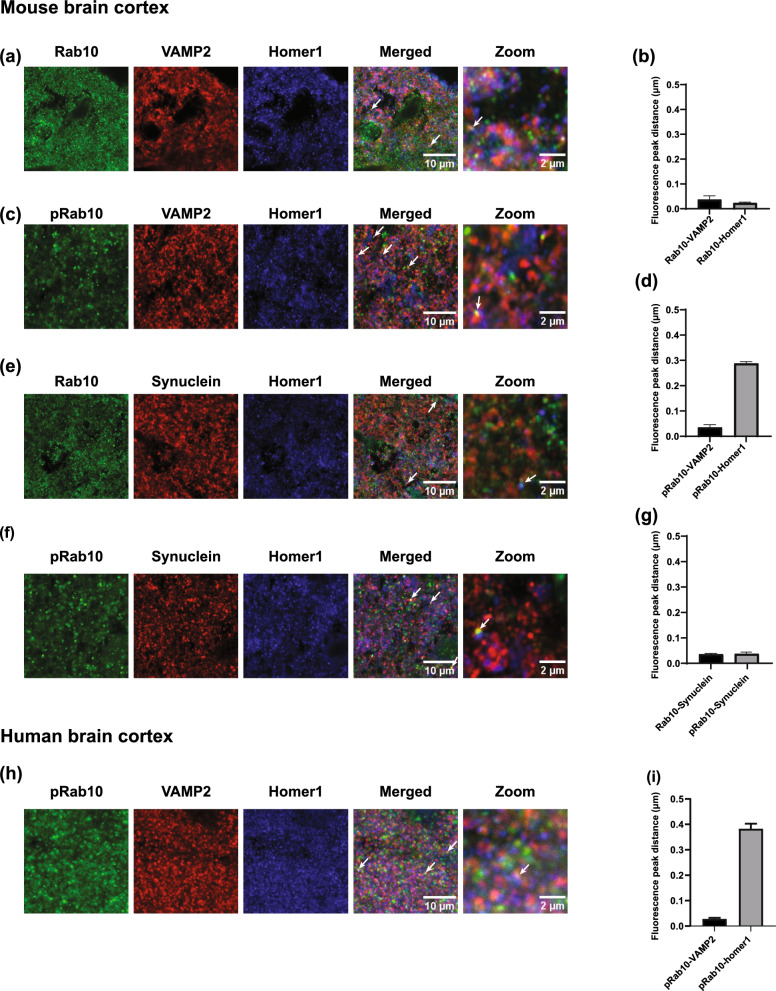
Autosomal dominant pathogenic mutations in Leucine-rich repeat kinase 2 (LRRK2) cause Parkinson's disease (PD). The most common mutation, G2019S-LRRK2, increases the kinase activity of LRRK2 causing hyper-phosphorylation of its substrates. One of these substrates, Rab10, is phosphorylated at a conserved Thr73 residue (pRab10), and is one of the most abundant LRRK2 Rab GTPases expressed in various tissues. The involvement of Rab10 in neurodegenerative disease, including both PD and Alzheimer's disease makes pinpointing the cellular and subcellular localization of Rab10 and pRab10 in the brain an important step in understanding its functional role, and how post-translational modifications could impact function. To establish the specificity of antibodies to the phosphorylated form of Rab10 (pRab10), Rab10 specific antisense oligonucleotides were intraventricularly injected into the brains of mice. Further, Rab10 knock out induced neurons, differentiated from human induced pluripotent stem cells were used to test the pRab10 antibody specificity. To amplify the weak immunofluorescence signal of pRab10, tyramide signal amplification was utilized. Rab10 and pRab10 were expressed in the cortex, striatum and the substantia nigra pars compacta. Immunofluorescence for pRab10 was increased in G2019S-LRRK2 knockin mice. Neurons, astrocytes, microglia and oligodendrocytes all showed Rab10 and pRab10 expression. While Rab10 colocalized with endoplasmic reticulum, lysosome and trans-Golgi network markers, pRab10 did not localize to these organelles. However, pRab10, did overlap with markers of the presynaptic terminal in both mouse and human cortex, including α-synuclein. Results from this study suggest Rab10 and pRab10 are expressed in all brain areas and cell types tested in this study, but pRab10 is enriched at the presynaptic terminal. As Rab10 is a LRRK2 kinase substrate, increased kinase activity of G2019S-LRRK2 in PD may affect Rab10 mediated membrane trafficking at the presynaptic terminal in neurons in disease.

Keywords: Antisense oligonucleotide; Mouse brain; Parkinson’s disease; Phosphorylation; Rab10; Rab10 knock down; pRab10.


Conflict of interest statement

The authors declare they have no competing interests.

Figures

Fig. 1
Fig. 1
Validation of Rab10 and pRab10 antibodies in the brain using Rab10ASOs C57BL/6JWT mice were intracerebroventricularly injected with control and Rab10 ASO1 to confirm the specificity of the Rab10 and pRab10 antibodies. a Immunoblot of Rab10 in Rab10 ASO (Rab10 ASO1) and control ASO injected brain samples for cortex, midbrain and striatum. Hsc70 was used as a loading control. b Quantitation of Rab10 protein and normalization with the loading control, Hsc70, showed reduction of Rab10 in brain regions from the Rab10 ASO1 injected mouse (gray bar) compared to control ASO (black bar) in the cortex (p value = 0.002), midbrain (p value = 0.04) and in the striatum (p value = 0.06). Nonparametric Mann–Whitney test was run for statistical analyses (n = 6 biologically independent samples). c Immunoblots showed reduction of pRab10 in Rab10 ASO injected brain samples (Rab10 ASO1) compared to control ASO injected in brain samples in the cortex, midbrain and striatum. Hsc70 was used as a loading control. d Quantitation of pRab10 protein and normalization with the loading control, Hsc70, showed reduction of pRab10 in the Rab10 ASO1 injected mouse samples (gray bar) compared to control ASO injected mouse samples (black bar) in the cortex (p value = 0.004), midbrain (p value = 0.002) and in the striatum (p value = 0.004). Nonparametric Mann–Whitney test was run for statistical analyses (n = 6 biologically independent samples). e Immunofluorescence staining for pRab10 (green) in the striatum showed a reduction of pRab10 in the Rab10 ASO injected mice compared to control ASO injected mice. NeuN (red) immunofluorescence is used to help visualize location on neuronal nuclei and comparable staining in the brain area. Scale bar = 500 µm. All images were captured at the same laser power, gain and offset. f The zoom image shows pRab10 (green) reduction in the Rab10 ASO injected sample compared to control ASO sample. Scale bar = 200 µm. g Normalization of pRab10 integrated density immunofluorescence signal with NeuN signal and quantitation using nested independent t-test showed a significant reduction (p value = 0.0008) in the Rab10 ASO injected samples (gray bar) compared to control samples (black bar) (n = 3 biologically independent samples)
Fig. 2
Fig. 2
Localization of Rab10 and pRab10 in excitatory neurons and interneurons the cortex. C57BL/6JWT mice at 3–4 months age were used for immunofluorescence localization in the cortex. a Rab10 (green) was present in all cortex layers. SATB2, a marker for excitatory neurons, was visualized in red. The merged image showed Rab10 (green) was localized in SATB2 positive excitatory neurons expressing neurons. Scale bar = 50 µm. b Rab10 (green) was localized in SATB2 (red) expressing excitatory neurons. Scale bar = 50 µm. c pRab10 (green) was present in all cortex layers. SATB2 (red) was expressed in expressed in all cortex layers except layer I and merged image shows pRab10 (green) is localized in SATB2 (red) expressing neurons. Scale bar = 50 µm. d High magnification image showed that pRab10 (green) was enriched in SATB2 (red) expressing excitatory neurons. Scale bar = 50 µm. e A representative high magnification image showed Rab10 is expressed in calretinin expressing inhibitory neurons indicated by arrows. Scale bar = 50 µm. f A representative high magnification image shows pRab10 was expressed in calretinin expressing inhibitory neurons indicated by arrows. Scale bar = 50 µm. (n = 3 biologically independent mouse brain samples)
Fig. 3
Fig. 3
Rab10 and pRab10 immunofluorescence and confocal microscope images of C57BL/6J WT mouse brain striatum. a Rab10 (green) expression in DARPP32 (red) positive SPNs indicated by arrows, and parvalbumin (blue) positive interneurons indicated by arrowheads. Scale bar = 50 µm. b pRab10 (green) expression in DARPP32 (red) positive SPNs indicated by arrows and parvalbumin (blue) positive interneurons indicated by arrowheads. Scale bar = 50 µm. c A representative image shows Rab10 (green) expression in ChAT (red) positive interneurons in merged and higher magnification images indicated by arrows. Scale bar = 50, 10 µm. d A representative image shows pRab10 (green) expression in ChAT (red) positive interneurons in merged and higher magnification images indicated by arrows. Scale bar = 50, 10 µm. (n = 3 biologically independent mouse brain samples)
Fig. 4
Fig. 4
Rab10 and pRab10 immunofluorescence and confocal microscopy images in C57BL/6J WT mouse SNc sections. a Low magnification confocal image shows Rab10 (green) is expressed in the SNc brain area, surrounded by a box. DAT (red) and TH (blue) immunofluorescence highlights the SNc brain and merged channel image shows Rab10 expression in this region. Scale bar = 500 µm. b Higher magnification image shows Rab10 (green) enrichment in DAT (red) and TH (blue) immuno-positive cells in SNc, indicated by arrows Scale bar = 50 µm. c Low magnification confocal image shows pRab10 (green) is expressed in the SNc. DAT (red) and TH (blue) immunofluorescence to highlight the SNc and merged channel image shows pRab10 expression in this region Scale bar = 500 µm. d Higher magnification image shows pRab10 (green) enrichment in DAT (red) and TH (blue) immuno-positive cells in the SNc indicated by arrows. Scale bar = 50 µm. (n = 3 biologically independent mouse brain samples)
Fig. 5
Fig. 5
Rab10 and pRab10 immunofluorescence in Glia cell types. Confocal laser scanning microscopy images of C57BL/6J WT mouse brain sections from cortex. a A representative confocal image shows Rab10 (green) expression in CD68 (red) positive microglia cells shown in both the merged lower and higher magnification images indicated by arrow. Scale bar = 50, 5 µm. b A representative confocal image shows pRab10 (green) expression in CD68 (red) positive cells shown in both the merged lower and higher magnification images indicated by arrow. Hoechst 33,342 staining (blue) shows the cell nucleus. Scale bar = 50, 5 µm. c A representative image shows Rab10 (green) expression in GFAP expressing astrocytes (red) shown in the merged lower and higher magnification images indicated by arrows. Hoechst 33,342 staining (blue) shows the cell nucleus. Scale bar = 20, 5 µm. d. A representative image shows pRab10 (green) expression in GFAP expressing astrocytes (red) shown in merged lower and higher magnification images indicated by arrows. Hoechst 33,342 staining (blue) shows the cell nucleus. Scale bar = 20, 5 µm. e A representative image shows Rab10 (green) expression in Olig2 expressing oligodendrocyte cells (red) shown in merged lower and higher magnification images indicated by arrows. Hoechst 33,342 staining (blue) shows the cell nucleus. Scale bar = 50, 5 µm. f A representative image shows pRab10 (green) expression in Olig2 expressing oligodendrocyte cells (red) shown in merged lower and higher magnification images indicated by arrows. Hoechst 33,342 staining (blue) shows the cell nucleus. Scale bar = 50, 5 µm. (n = 3 biologically independent mouse brain samples)
Fig. 6
Fig. 6
Immunofluorescence confocal images showing Rab10 and pRab10 expression in subcellular compartments in the C57BL/6J WT mouse cortex. a Rab10 (green) colocalized with the endoplasmic reticulum (ER) marker, KDEL (red) shown in merged and zoomed in images. Scale bar = 10, 2 µm. b pRab10 (green) did not show colocalization with the ER marker, KDEL (red) shown in merged and zoomed in image. Scale bar = 10, 2 µm. c Colocalization analyses using Mander’s colocalization coefficient (MCC) indicated a significant difference Rab10 protein colocalization with KDEL compared to pRab10 (p value = 0.001). d Rab10 (green) colocalized with the trans Golgi network (TGN) marker, TGN46 (red) shown in merged and zoomed in image. Scale bar = 10, 2 µm. e pRab10 (green) did not show colocalization with TGN46 (red) shown in merged and zoomed in image. Scale bar = 10, 2 µm. f Colocalization analyses using MCC indicated a significant difference in Rab10 protein colocalization with TGN46 compared to pRab10/TGN46 (p value = 0.01). g Rab10 (green) colocalized with the lysosomal marker, LAMP1 (red) shown in merged and zoomed in image. Scale bar = 10, 2 µm. h pRab10 (green) did not show colocalization with LAMP1 shown in merged and zoomed in image. Scale bar = 10, 2 µm. i Colocalization analyses using MCC indicated a significant difference in Rab10 protein colocalization with LAMP1 compared to pRab10 (p value = 0.004) j Rab10 (green) did not show colocalization with the early endosome marker, EEA1 (red) shown in merged and zoomed in image. Scale bar = 10, 2 µm. k pRab10 (green) did not show colocalization with EEA1 shown in merged and zoomed in image Scale bar = 10, 2 µm. l There was no significant difference between Rab10 and pRab10 colocalization signal with EEA1 indicated by MCC (p value = 0.4). Colocalization analysis was performed using ImageJ plug in, JACoP, and unpaired t-test with Welch’s correction was used to get the significance value. (n = 3 biologically independent mouse brain samples)
Fig. 7
Fig. 7
Immunofluorescence confocal image show Rab10 and pRab10 expression at the synapse in the C57BL/6J WT mouse brain. Triple labeling was performed (N = 3): Rab10/VAMP2/Homer or pRab10/VAMP2/Homer, with secondary antibodies anti-rabbit Alexa 488, anti-mouse Alexa 555, and anti-chicken Alexa 647. Here the Homer1 channel color was artificially changed to blue for all images. a Rab10 (green) colocalized with the presynaptic marker VAMP2 (red) and with the post synaptic marker Homer1 (blue), indicated by arrow, shown in merged and zoomed in image Scale bar = 10, 2 µm. b Distance between Rab10 and Vamp2 (0.0373 µm) and distance between Rab10 and Homer1 (0.0236 µm). c pRab10 (green) colocalized with the presynaptic marker VAMP2 (red), indicated by arrow but did not colocalize with the post synaptic marker Homer1 (blue), indicated by arrow, shown in merged and zoomed in image. Scale bar = 10, 2 µm. d Distance between pRab10 and Vamp2 (0.0353 µm) and between pRab10 and Homer1 (0.288 µm). e Rab10 (green) colocalized with α-synuclein (red) shown in merged and zoomed in image. Scale bar = 10, 2 µm. f pRab10 (green) colocalized with α synuclein (red) shown in merged and zoomed in image. Scale bar = 10, 2 µm. g Distance between Rab10 and α-synuclein (0.0361) and distance between pRab10 and α synuclein (0.0347 µm). (n = 3 biologically independent mouse brain samples). h In human brain temporal cortex, pRab10 (green) colocalized with the presynaptic marker VAMP2 (red), indicated by arrow but did not colocalized with the post synaptic marker Homer1 (blue), indicated by arrow shown in merged and zoomed in image. Scale bar = 10, 2 µm. i Distance between pRab10 and VAMP2 (0.0283 µm) and between pRab10 and Homer1 (0.383 µm). (n = 3 human brain samples)

Similar articles

Cited by

References

    1. Aosaki T, Miura M, Masuda M. Physiological interaction between acetylcholine and dopamine in the striatum. Brain Nerve. 2009;61:373–380. - PubMed
    1. Arranz AM, Delbroek L, Van Kolen K, Guimaraes MR, Mandemakers W, Daneels G, Matta S, Calafate S, Shaban H, Baatsen P, et al. LRRK2 functions in synaptic vesicle endocytosis through a kinase-dependent mechanism. J Cell Sci. 2015;128:541–552. doi: 10.1242/jcs.158196. - DOI - PubMed
    1. Atashrazm F, Hammond D, Perera G, Bolliger MF, Matar E, Halliday GM, Schule B, Lewis SJG, Nichols RJ, Dzamko N. LRRK2-mediated Rab10 phosphorylation in immune cells from Parkinson's disease patients. Mov Disord. 2019;34:406–415. doi: 10.1002/mds.27601. - DOI - PubMed
    1. Baba M, Nakajo S, Tu PH, Tomita T, Nakaya K, Lee VM, Trojanowski JQ, Iwatsubo T. Aggregation of alpha-synuclein in Lewy bodies of sporadic Parkinson's disease and dementia with Lewy bodies. Am J Pathol. 1998;152:879–884. - PMC - PubMed
    1. Beccano-Kelly DA, Kuhlmann N, Tatarnikov I, Volta M, Munsie LN, Chou P, Cao LP, Han H, Tapia L, Farrer MJ, Milnerwood AJ. Synaptic function is modulated by LRRK2 and glutamate release is increased in cortical neurons of G2019S LRRK2 knock-in mice. Front Cell Neurosci. 2014;8:301. doi: 10.3389/fncel.2014.00301. - DOI - PMC - PubMed

Publication types

MeSH terms

Substances