. 2023 Dec 19;20(1):303.
doi: 10.1186/s12974-023-02985-6.

Oxygen therapy attenuates neuroinflammation after spinal cord injury

Affiliations

Oxygen therapy attenuates neuroinflammation after spinal cord injury

Michael D Sunshine et al. J Neuroinflammation. .

Abstract

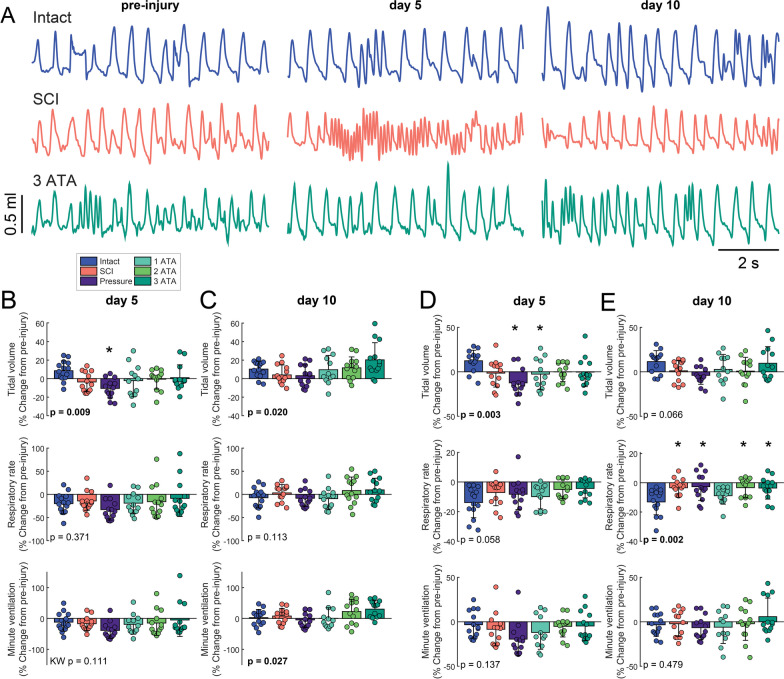
Acute hyperbaric O2 (HBO) therapy after spinal cord injury (SCI) can reduce inflammation and increase neuronal survival. To our knowledge, it is unknown if these benefits of HBO require hyperbaric vs. normobaric hyperoxia. We used a C4 lateralized contusion SCI in adult male and female rats to test the hypothesis that the combination of hyperbaria and 100% O2 (i.e. HBO) more effectively mitigates spinal inflammation and neuronal loss, and enhances respiratory recovery, as compared to normobaric 100% O2. Experimental groups included spinal intact, SCI no O2 therapy, and SCI + 100% O2 delivered at normobaric pressure (1 atmosphere, ATA), or at 2- or 3 ATA. O2 treatments lasted 1-h, commenced within 2-h of SCI, and were repeated for 10 days. The spinal inflammatory response was assessed with transcriptomics (RNAseq) and immunohistochemistry. Gene co-expression network analysis showed that the strong inflammatory response to SCI was dramatically diminished by both hyper- and normobaric O2 therapy. Similarly, both HBO and normobaric O2 treatments reduced the prevalence of immunohistological markers for astrocytes (glial fibrillary acidic protein) and microglia (ionized calcium binding adaptor molecule) in the injured spinal cord. However, HBO treatment also had unique impacts not detected in the normobaric group including upregulation of an anti-inflammatory cytokine (interleukin-4) in the plasma, and larger inspiratory tidal volumes at 10-days (whole body-plethysmography measurements). We conclude that normobaric O2 treatment can reduce the spinal inflammatory response after SCI, but pressured O2 (i.e., HBO) provides further benefit.

Keywords: Hyperbaric oxygen; Hyperoxia; Spinal cord injury.


Conflict of interest statement

The authors declare no competing interests.

Figures

Fig. 1
Fig. 1
Overview of the study design. A Study timeline indicating daily O2 treatments and plethysmography (pleth) measurements. B Schematic indicating the treatments received by each of the experimental groups. Each of the colors indicates a different experimental group. C The 32 L hyperbaric chamber used for treating rats with pressurized gas. D The whole body plethysmography chamber used for recording breathing. E Drawing of the spinal cord illustrating the approximate location and size of the lesion induced by unilateral contusion at C4. F Representative photomicrographs of transverse (cross) sections of the C4 spinal cord stained with cresyl violet. Examples are included from an intact (uninjured) cord (left) and after C4 contusion (SCI, right)
Fig. 2
Fig. 2
Impact of SCI and O2 therapy on the spinal cord transcriptome. A Data were generated by performing RNAseq on C4 spinal tissues, followed by hierarchical clustering of Weighted Gene Co-Expression Network Analysis (WGCNA) module eigengenes. In panel A, “Height” indicates the relative difference between modules, and the branches of the dendrogram group together eigengenes that are positively correlated. B The relative expression of each module, in each experimental group. Each row corresponds to a module eigengene, and each cell contains the corresponding correlation and p-value. Red and blue color denote positive and negative correlation with gene expression, respectively. C The functional classification of each module and number of associated genes. D, F Heat maps depict expression of the top 25 hub genes (rows) across animals (columns) for the six experimental groups (red corresponds to gene upregulation and blue to downregulation). These plots are provided for the blue module (“neuronal”, D) and turquoise (“inflammatory”, F) module. Bar plots above the heat maps show the overall expression level within each animal. E, G Boxplots are provided to illustrate variability in the expression levels of representative hub genes in the blue (top) and turquoise (bottom) modules. * indicates p < 0.05, student’s t-test compared to SCI
Fig. 3
Fig. 3
Impact of O2 therapy on histological assessment of neuroinflammation near the spinal cord lesion. Representative photomicrographs depicting IBA1 and GFAP immunostaining are shown in C4 spinal cord transverse sections obtained from a spinal intact (panel A) and injured rat (SCI group, panel B). Ai and Bi show increased magnification views of the area highlighted by the box in A and B. Panels C and D provide quantitative evaluation of IBA1 + optical density on the ipsilateral and contralateral sides of the spinal cord, respectively. Immunostaining was evaluated ± 10 mm from C4 (lesion epicenter). Panels E and F present GFAP + optical density in the ipsilateral and contralateral spinal cord. A one-way analysis of variance was used to compare groups. The omnibus effect of group p-value is noted in the figure; *indicates p < 0.05 Tukey–Kramer post-hoc compared to Intact
Fig. 4
Fig. 4
Impact of O2 therapy on vacuolization and neuronal numbers in the injured spinal cord. Representative photomicrographs of FluoroMyelin stained transverse C4 spinal cord sections are presented in panel A (spinal intact) and panel B (SCI group). Panels Ai and Bi show increased magnification views of the areas highlighted by the box in A and B. Panels B and Bi illustrate the increase in vacuolization in tissues from the injured spinal cord. Mean data were assessed ± 2 mm from the C4 lesion epicenter and are presented for the ipsilateral (panel C) and contralateral spinal cord (panel D). Panels E–F show example photomicrographs of the C4 spinal cord depicting NeuN staining (to recognize neurons) in the spinal intact (E) and injured spinal cord (F). Ei and Fi show increased magnification views of the areas highlighted by the box in E and F. Panel G shows group data for small neurons (23–115 µm2) and panel H shows large neurons (116–345 µm2) in the ventral horn on the ipsilateral side. In both cases, although values are lower, neuronal counts in the 3 ATA group are not statistically different than spinal intact. One-way analysis of variance was used to compare the groups; if a data-set failed ANOVA assumptions a Kruskal–Wallis (KW) test was used. The omnibus effect of group p-value is noted in the figure; *indicates p < 0.05 Tukey–Kramer post-hoc compared to Intact
Fig. 5
Fig. 5
Impact of SCI and O2 treatment on tidal volume, rate, and minute ventilation. Examples of respiratory waveforms recorded using whole body plethysmography are shown in panel A. Inspiration is shown as an upward deflection. Panels B, C show mean results during normoxic (21% O2) breathing on day 5 and day 10 post-SCI, respectively. After normoxic baseline recordings, a brief (5-min) challenge was induced by flowing a reduced O2 (10%) and increased CO2 (7%) gas mixture through the plethysmography chamber. This was done to test the capacity to increase breathing; mean results are shown in panels D, E. A one-way analysis of variance was used to determine group differences, if a data-set failed ANOVA assumptions a Kruskal–Wallis (KW) test was run. The omnibus effect of group p-value is noted in the figure; *indicates p < 0.05 Dunnet’s post-hoc compared to Intact
Fig. 6
Fig. 6
Impact of SCI and O2 treatment on respiratory waveforms. Cluster analysis (see methods) revealed that four general waveform categories were present during baseline (normoxic) breathing. Average waveforms from each category are shown in panel A. Waveform of clusters that had reduced prevalence on day 5 post-SCI are shown and red; increased prevalence is indicated by green. Mean data from 5- and 10-days post-SCI are shown in panels B and C, respectively. All data are expressed relative to the pre-injury measurement. One-way analysis of variance was used to determine group differences, if a data-set failed ANOVA assumptions a Kruskal–Wallis (KW) test was applied. The omnibus effect of group p-value is noted in the figure; *indicates p < 0.05 Dunnet’s post-hoc compared to Intact
Fig. 7
Fig. 7
Impact of SCI and O2 therapy on diaphragm cross-sectional area and contractile function. A Representative photomicrographs of tissue sections from the mid-costal diaphragm in each experimental group. Tissues were stained to recognize myosin heavy chain I (MHC I, blue), myosin heavy chain IIa (MHC IIa, green), and laminin (red). Unstained fibers are type IIb/x. B Summary data of the cross sectional area. C Ex-vivo assessment of diaphragm specific force. A one-way ANOVA was used to determine group differences. The omnibus effect of group p-value is noted; *indicates p < 0.05 Dunnet’s post-hoc compared to Intact

References

    1. Kelly DL, Jr, Lassiter KR, Vongsvivut A, Smith JM. Effects of hyperbaric oxygenation and tissue oxygen studies in experimental paraplegia. J Neurosurg. 1972;36:425–429. doi: 10.3171/jns.1972.36.4.0425. - DOI - PubMed
    1. Li Y, Lucas-Osma AM, Black S, Bandet MV, Stephens MJ, Vavrek R, Sanelli L, Fenrich KK, Di Narzo AF, Dracheva S, et al. Pericytes impair capillary blood flow and motor function after chronic spinal cord injury. Nat Med. 2017;23:733–741. doi: 10.1038/nm.4331. - DOI - PMC - PubMed
    1. Tibbles PM, Edelsberg JS. Hyperbaric-oxygen therapy. N Engl J Med. 1996;334:1642–1648. doi: 10.1056/NEJM199606203342506. - DOI - PubMed
    1. Zhou Y, Dong Q, Pan Z, Song Y, Su P, Niu Y, Sun Y, Liu D. Hyperbaric oxygen improves functional recovery of the injured spinal cord by inhibiting inflammation and glial scar formation. Am J Phys Med Rehabil. 2019;98:914–920. doi: 10.1097/PHM.0000000000001225. - DOI - PubMed
    1. Long Y, Liang F, Gao C, Li Z, Yang J. Hyperbaric oxygen therapy reduces apoptosis after spinal cord injury in rats. Int J Clin Exp Med. 2014;7:4073–4081. - PMC - PubMed