. 2023 Dec 18;15(1):115.
doi: 10.1186/s13073-023-01269-1.

De novo identification of expressed cancer somatic mutations from single-cell RNA sequencing data

Affiliations

De novo identification of expressed cancer somatic mutations from single-cell RNA sequencing data

Tianyun Zhang et al. Genome Med. .

Erratum in

Abstract

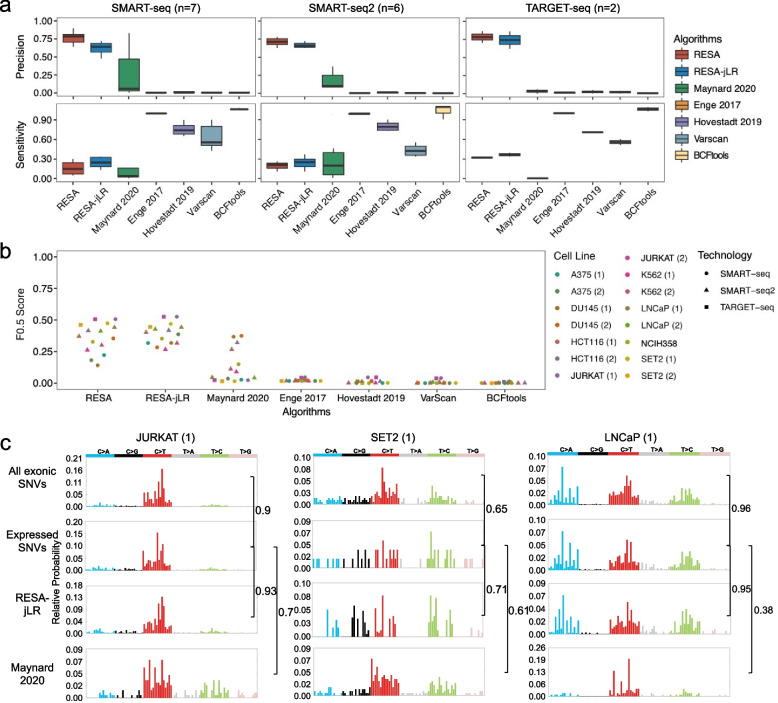
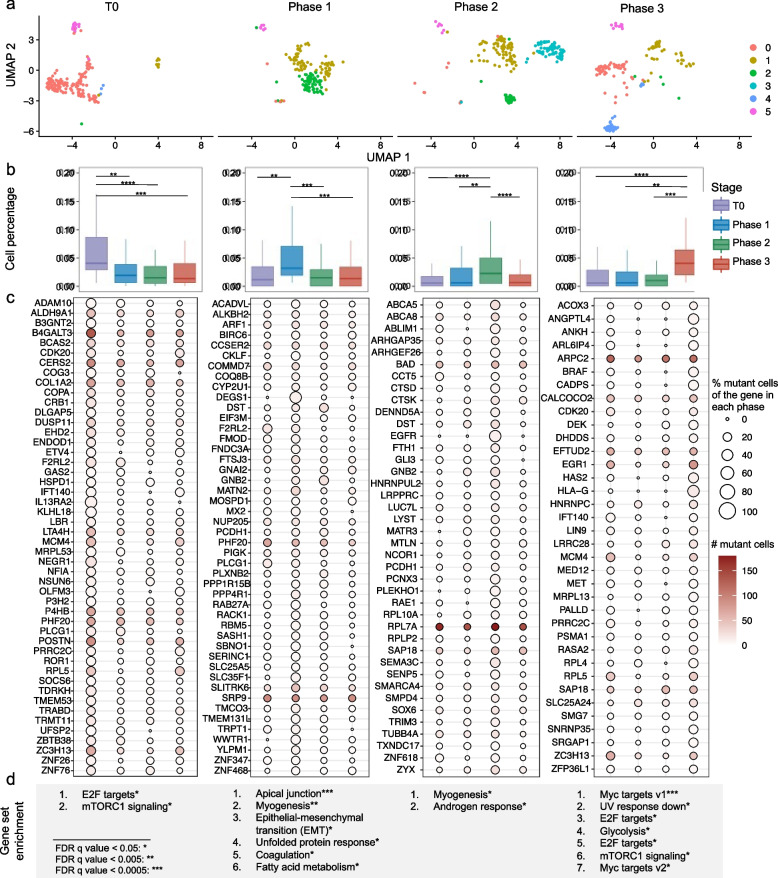
Identifying expressed somatic mutations from single-cell RNA sequencing data de novo is challenging but highly valuable. We propose RESA - Recurrently Expressed SNV Analysis, a computational framework to identify expressed somatic mutations from scRNA-seq data. RESA achieves an average precision of 0.77 on three in silico spike-in datasets. In extensive benchmarking against existing methods using 19 datasets, RESA consistently outperforms them. Furthermore, we applied RESA to analyze intratumor mutational heterogeneity in a melanoma drug resistance dataset. By enabling high precision detection of expressed somatic mutations, RESA substantially enhances the reliability of mutational analysis in scRNA-seq. RESA is available at https://github.com/ShenLab-Genomics/RESA .

Keywords: High precision; Recurrently Expressed SNV Analysis; Single-cell RNA sequencing data; Somatic mutations.


Conflict of interest statement

The authors have submitted a patent application for the method. Other than this, the authors declare that they do not have any competing interests.

Figures

Fig. 1
Fig. 1
RESA workflow. a Step1 is an initial variant call using two aligners and two mutation calling algorithms. b RESA: Variants calling then goes through a series of filtering and labeling, categorizing into a confident set of positive somatic variants and artefacts, and a set of unsure SNVs to refine. c RESA-jLR: The confident set of variants is used to build a joint logistic regression model, where the model is applied to make predictions in the unsure set of SNVs to refine and expand the final positive set of somatic SNVs. d the detailed workflow of RESA
Fig. 2
Fig. 2
Detecting expressed somatic mutations in the A375 cell line and pancreas tissue datasets. a Integrative Genomics Viewer (IGV) window shows the hotspot mutation BRAF V600E in the A375 cell line. b The scatter plot of the percentage of exonic SNVs validated in scRNA-seq against the million reads per cell. c The scatter plot shows the expression level against the number of expressed somatic mutations in each gene. d, e, The bar plot illustrates the distribution of VAF of expressed somatic mutations in scRNA-seq compared with corresponding VAF in bRNA-seq (d) and in WES (e). f The percentage of accumulated expressed SNVs validated in scRNA-seq. g The density plot shows the distribution of detected SNVs of each cell after passing the standard variant calling pipeline in the A375 cell line datasets with two conditions
Fig. 3
Fig. 3
Benchmark RESA to other methods in the in silico spike-in scRNA-seq datasets. a Workflow for in silico spike-in. scRNA-seq raw reads of pancreas tissues from 3 healthy juveniles using SMART-seq2 technology in Enge et al. 2017 [12] were collected as original BAM files. Somatic SNVs of 10 cancer cell lines covering 5 tissues of origin were identified from WES data. Bamsurgeon spiked cancer cell line somatic SNVs into the original BAM files to produce ‘Burn-in’ BAM files. In silico spike-in scRNA-seq datasets were ordered by the coverage of each cell, split into several subsets, and followed by further evaluations. b, The violin plot illustrates the distribution of coverage in each subset. The error bars display the average and standard deviation of the precision of RESA, RESA-jLR, and the other 5 previously published algorithms. If the minimum value of the error bar is less than 0, 0 is shown. Top: a 4-month-old infant (Blue). Middle: a 5-year-old child (Purple). Bottom: a 6-year-old child (Green). c The scatter plot shows precisions and sensitivities in different subsets of 10 cell lines. Points in red are the results of RESA, and points in blue are the results of RESA-jLR. Top: a 4-month-old infant. Middle: 5-year-old child. Bottom: a 6-year-old child. d F0.5 score in in silico spike-in scRNA-seq datasets (Wilcoxon rank-sum test, NS: not significant, * p < 0.05, ** p < 0.01, *** p < 0.001, **** p < 0.0001). Top: a 4-month-old infant (Blue). Middle: 5-year-old child (Purple). Bottom: a 6-year-old child (Green). e The bar plot illustrates the number of “spiked-in” mutations across 10 cell lines. Top: a 4-month-old infant (Blue). Middle: 5-year-old child (Purple). Bottom: a 6-year-old child (Green)
Fig. 4
Fig. 4
Evaluating the performance of RESA with comparison to other methods using WES data across multiple cancer cell lines. a Boxplots showing precisions (top) and sensitivities (bottom) of different methods in identifying positive somatic SNVs using WES data as ground truth across 15 scRNA-seq datasets. b The scatter plot showing F0.5 scores of different methods in identifying positive somatic SNVs using the number of somatic SNVs in WES data as ground truth across 15 scRNA-seq datasets. c Mutation spectra of somatic SNVs identified using all exonic SNVs, all expressed SNVs, RESA-jLR, and the Maynard 2020 approach across 3 scRNA-seq datasets. Pairwise cosine similarity scores were shown next to brackets
Fig. 5
Fig. 5
Benchmark RESA to other methods in PDX tumor datasets. a The bar plots illustrate precisions of RESA, RESA-jLR and other methods in a lung cancer PDX tumor from the same patient with 2 replicates. b The bar plots illustrate precisions of RESA, RESA-jLR and other methods in melanoma PDX datasets without treatment (T0) and after treatment (Phase3), c, d, e, f, Scatter plots showing VAF correlation of SNVs detected by RESA between scRNA-seq and WES in the lung cancer tumor sample with the replicate 1 (c) and replicate 2 (d), and melanoma datasets without treatment (e) and with treatment (f)
Fig. 6
Fig. 6
Somatic SNVs enriched in specific stages using RESA. a UMAP embedding of scRNA-seq profiles of each stage. b Distributions of percentages of cells harboring stage-specific mutations of each stage. (n.s.: p > 0.05, *: p <  = 0.05, **: p <  = 0.01, ***: p <  = 0.001, ****: p <  = 0.0001) c Aggregate expression of log2 of transcripts per 10,000 reads (color bar) for stage-specific genes detected in more than 10 cells and the number of cells harboring the mutation in each stage (cycle). d List of gene set enrichment results for each stage (MSigDB hallmark)

References

    1. Yizhak K, Aguet F, Kim J, Hess JM, Kübler K, Grimsby J, et al. RNA sequence analysis reveals macroscopic somatic clonal expansion across normal tissues. Science. 2019;364. Available from: 10.1126/science.aaw0726 - PMC - PubMed
    1. PCAWG Transcriptome Core Group, Calabrese C, Davidson NR, Demircioğlu D, Fonseca NA, He Y, et al. Genomic basis for RNA alterations in cancer. Nature. 2020;578:129–36. - PMC - PubMed
    1. Nam AS, Kim K-T, Chaligne R, Izzo F, Ang C, Taylor J, et al. Somatic mutations and cell identity linked by Genotyping of Transcriptomes. Nature. 2019;571:355–360. doi: 10.1038/s41586-019-1367-0. - DOI - PMC - PubMed
    1. Rodriguez-Meira A, Buck G, Clark S-A, Povinelli BJ, Alcolea V, Louka E, et al. Unravelling intratumoral heterogeneity through high-sensitivity single-cell mutational analysis and parallel RNA Sequencing. Mol Cell. 2019;73:1292–305.e8. doi: 10.1016/j.molcel.2019.01.009. - DOI - PMC - PubMed
    1. Giustacchini A, Thongjuea S, Barkas N, Woll PS, Povinelli BJ, Booth CAG, et al. Single-cell transcriptomics uncovers distinct molecular signatures of stem cells in chronic myeloid leukemia. Nat Med. 2017;23:692–702. doi: 10.1038/nm.4336. - DOI - PubMed

Publication types