. 2024 Jun;21(3):287-297.
doi: 10.1177/17407745231214750. Epub 2023 Dec 18.

Risk-benefit trade-offs and precision utilities in phase I-II clinical trials

Affiliations

Risk-benefit trade-offs and precision utilities in phase I-II clinical trials

Pavlos Msaouel et al. Clin Trials. 2024 Jun.

Abstract

Background: Identifying optimal doses in early-phase clinical trials is critically important. Therapies administered at doses that are either unsafe or biologically ineffective are unlikely to be successful in subsequent clinical trials or to obtain regulatory approval. Identifying appropriate doses for new agents is a complex process that involves balancing the risks and benefits of outcomes such as biological efficacy, toxicity, and patient quality of life.

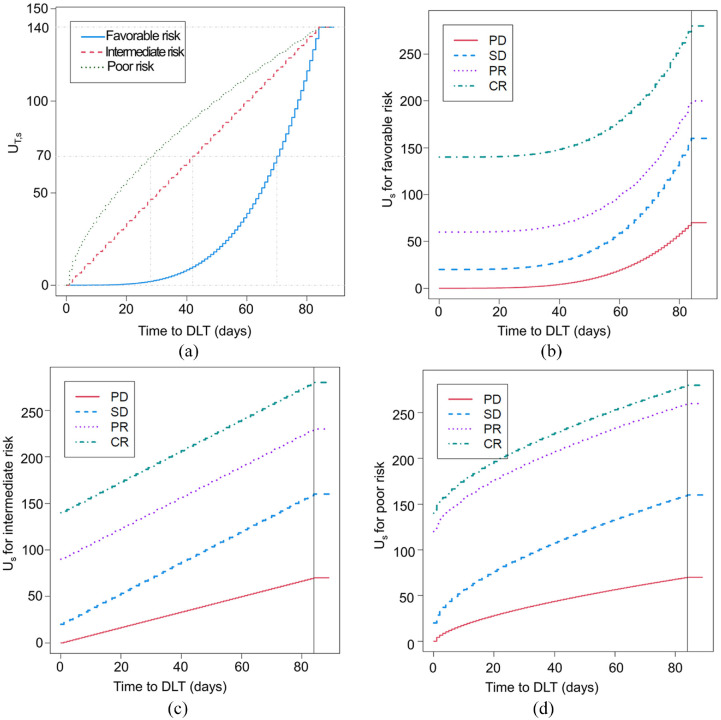
Purpose: While conventional phase I trials rely solely on toxicity to determine doses, phase I-II trials explicitly account for both efficacy and toxicity, which enables them to identify doses that provide the most favorable risk-benefit trade-offs. It is also important to account for patient covariates, since one-size-fits-all treatment decisions are likely to be suboptimal within subgroups determined by prognostic variables or biomarkers. Notably, the selection of estimands can influence our conclusions based on the prognostic subgroup studied. For example, assuming monotonicity of the probability of response, higher treatment doses may yield more pronounced efficacy in favorable prognosis compared to poor prognosis subgroups when the estimand is mean or median survival. Conversely, when the estimand is the 3-month survival probability, higher treatment doses produce more pronounced efficacy in poor prognosis compared to favorable prognosis subgroups.

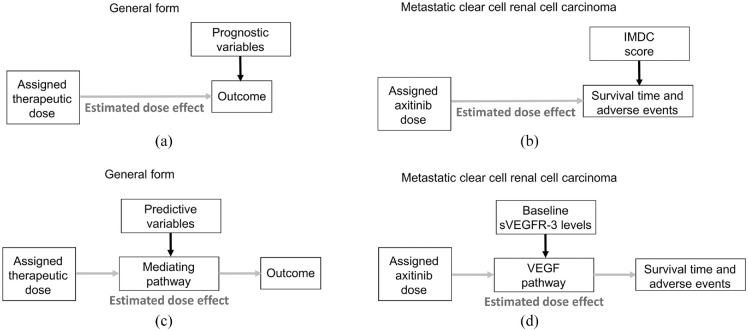
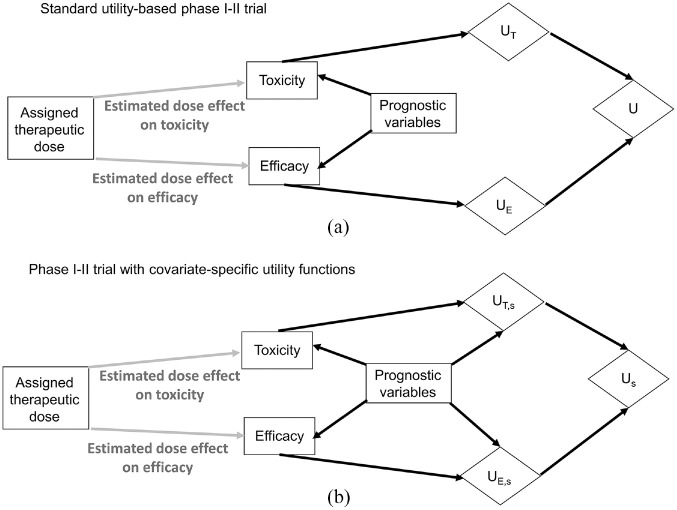
Methods and conclusions: Herein, we first describe why it is essential to consider clinical practice when designing a clinical trial and outline a stepwise process for doing this. We then review a precision phase I-II design based on utilities tailored to prognostic subgroups that characterize efficacy-toxicity risk-benefit trade-offs. The design chooses each patient's dose to optimize their expected utility and allows patients in different prognostic subgroups to have different optimal doses. We illustrate the design with a dose-finding trial of a new therapeutic agent for metastatic clear cell renal cell carcinoma.

Keywords: Covariate-specific utilities; personalized medicine; phase I-II trials; prognostic subgroups; risk–benefit trade-offs; utility functions.


Conflict of interest statement

Declaration of conflicting interestsThe author(s) declared the following potential conflicts of interest with respect to the research, authorship, and/or publication of this article: P.M. reports honoraria for scientific advisory board membership for Mirati Therapeutics, Bristol Myers Squibb, and Exelixis; consulting fees from Axiom Healthcare; non-branded educational programs supported by Exelixis and Pfizer; leadership or fiduciary roles as a Medical Steering Committee member for the Kidney Cancer Association and a Kidney Cancer Scientific Advisory Board member for KCCure; and research funding from Takeda, Bristol Myers Squibb, Mirati Therapeutics, and Gateway for Cancer Research.

Figures

Figure 1.
Figure 1.
Causal diagrams representing the data-generating processes of prognostic and predictive effects in dose-finding trials. The putative dose effect under investigation is denoted by gray arrows. (a) Prognostic biomarkers are baseline patient variables that directly influence the outcome and not the estimated dose effect. Thus, the estimated dose effect parameters such as loge odds are assumed to be stable for all patients. (b) Corresponding clinical scenario whereby the International Metastatic Renal Cell Carcinoma Database Consortium (IMDC) score is an established prognostic score that directly influences survival time and adverse events in mccRCC. The assigned dose of the drug axitinib may also impact overall survival. (c) Predictive biomarkers are baseline patient variables that influence the estimated dose effect through their effect on the mediating pathway that transmits the effect of the assigned dose on the outcomes of interest. (d) Corresponding clinical scenario whereby baseline levels of soluble vascular endothelial growth factor receptor 3 (sVEGFR-3) influence the vascular endothelial growth factor (VEGF) pathway that mediates the dose effect of the VEGF inhibitor axitinib on survival time and adverse events.
Figure 2.
Figure 2.
Time-to-event curves assuming an exponential distribution for patients with mccRCC treated with two different dose levels of an investigational therapy in a phase I-II trial. The black dotted lines correspond to median survival difference, whereas the purple dotted lines correspond to the survival probability difference at 3 months. The HR for the efficacy outcome is assumed to be 0.5 favoring dose level 2, and 0.75 for the DLT outcome favoring dose level 1, irrespective of IMDC prognostic risk classification. (a) For the efficacy outcome of OS in patients with favorable-risk IMDC, the survival probability difference at 3 months is 5.5% favoring dose level 2, whereas the median survival difference is 17.3 months favoring dose level 2. (b) For the efficacy outcome of OS in patients with IMDC poor risk, the survival probability difference at 3 months is 24.1% favoring dose level 2, whereas the median survival difference is 2 months favoring dose level 2. (c) For the DLT outcome in patients with IMDC favorable risk, the toxicity probability difference at 3 months is 2.1% favoring dose level 1. (d) For the DLT outcome in patients with IMDC poor risk, the toxicity probability difference at 3 months is 4.6% favoring dose level 1.
Figure 3.
Figure 3.
Causal diagrams representing the data-generating processes and corresponding utility nodes (diamonds) in phase I-II dose-finding trials. The putative dose effect under investigation is denoted by gray arrows. (a) Standard utility-based phase I-II trials assign numerical utilities UT to toxicity outcomes and UE to efficacy outcomes. Dose decisions are obtained by calculating the total utility U = UT + UE. (b) Phase I-II trials may also use covariate-specific utility functions that are modified based on each patient’s prognostic subgroup, g, to obtain subgroup-specific numerical utilities UT,s for toxicity outcomes and UE,s for efficacy outcomes. Dose decisions are obtained for each prognostic subgroup g by calculating the total subgroup-specific utility Us = UT,s + UE,s.
Figure 4.
Figure 4.
Prognostic covariate-specific utility functions tailored to each of the three IMDC prognostic risk groups of patients with mccRCC. These utility functions quantify the risk–benefit trade-offs to inform dose selection in a phase I-II trial design testing five doses of the targeted agent sitravatinib as first-line therapy in patients with mccRCC. (a) IMDC subgroup-specific toxicity utility functions UT,s encoding that patients with favorable-risk IMDC prognosis are less willing to accept being exposed to DLTs at any time point within 3 months than those with intermediate- or poor-risk disease. (b–d) Total utility Us based on time to DLT and the ordinal efficacy outcome of either progressive disease (PD), stable disease (SD), partial response (PR), or complete response (CR) by imaging at 3 months (84 days) from treatment initiation in patients with IMDC favorable- (b), intermediate- (c), and poor-risk disease (d). Source: adapted from Figure 1 of Lee et al.

References

    1. Hay M, Thomas DW, Craighead JL, et al.. Clinical development success rates for investigational drugs. Nat Biotechnol 2014; 32(1): 40–51. - PubMed
    1. Msaouel P, Goswami S, Thall PF, et al.. A phase 1-2 trial of sitravatinib and nivolumab in clear cell renal cell carcinoma following progression on antiangiogenic therapy. Sci Transl Med 2022; 14: eabm6420. - PMC - PubMed
    1. Msaouel P, Lee J, Thall PF. Making patient-specific treatment decisions using prognostic variables and utilities of clinical outcomes. Cancers 2021; 13: 2741. - PMC - PubMed
    1. Lee J, Thall PF, Msaouel P. Precision Bayesian phase I-II dose-finding based on utilities tailored to prognostic subgroups. Stat Med 2021; 40: 5199–5217. - PMC - PubMed
    1. Yuan Y, Nguyen HQ, Thall PF. Bayesian designs for phase I-II clinical trials. Boca Raton, FL: CRC Press, 2015.

MeSH terms

Substances

LinkOut - more resources