. 2023 Nov 28;42(11):113345.
doi: 10.1016/j.celrep.2023.113345. Epub 2023 Oct 28.

CD115+ monocytes protect microbially experienced mice against E. coli-induced sepsis

Affiliations

CD115+ monocytes protect microbially experienced mice against E. coli-induced sepsis

Matthew D Martin et al. Cell Rep. .

Abstract

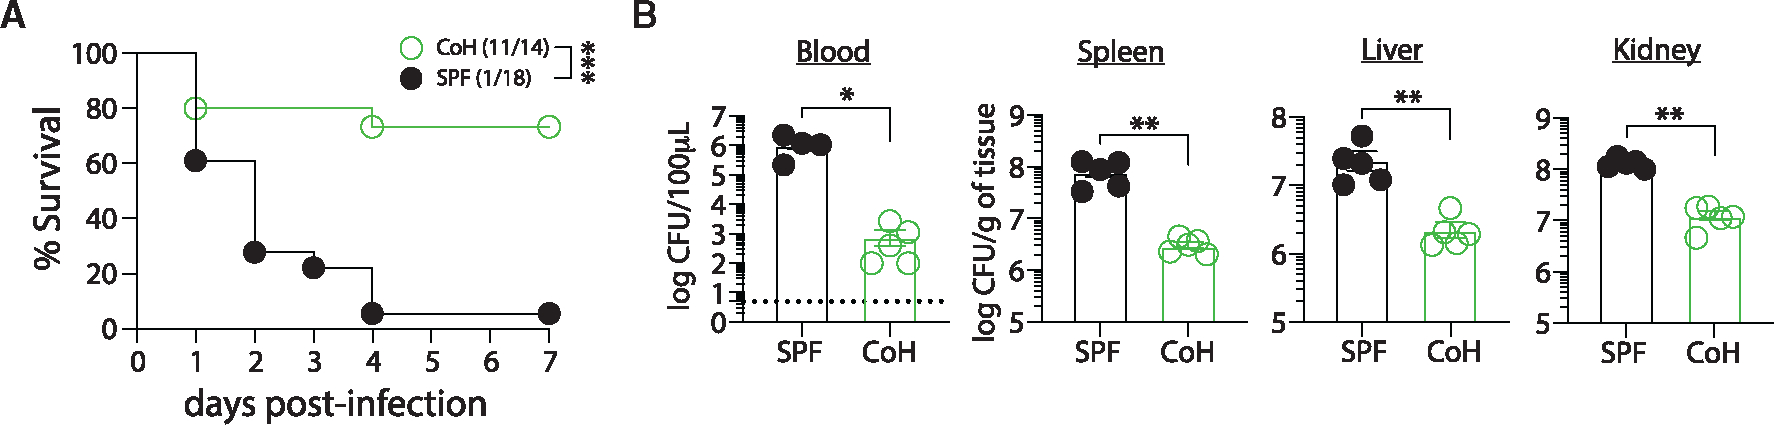
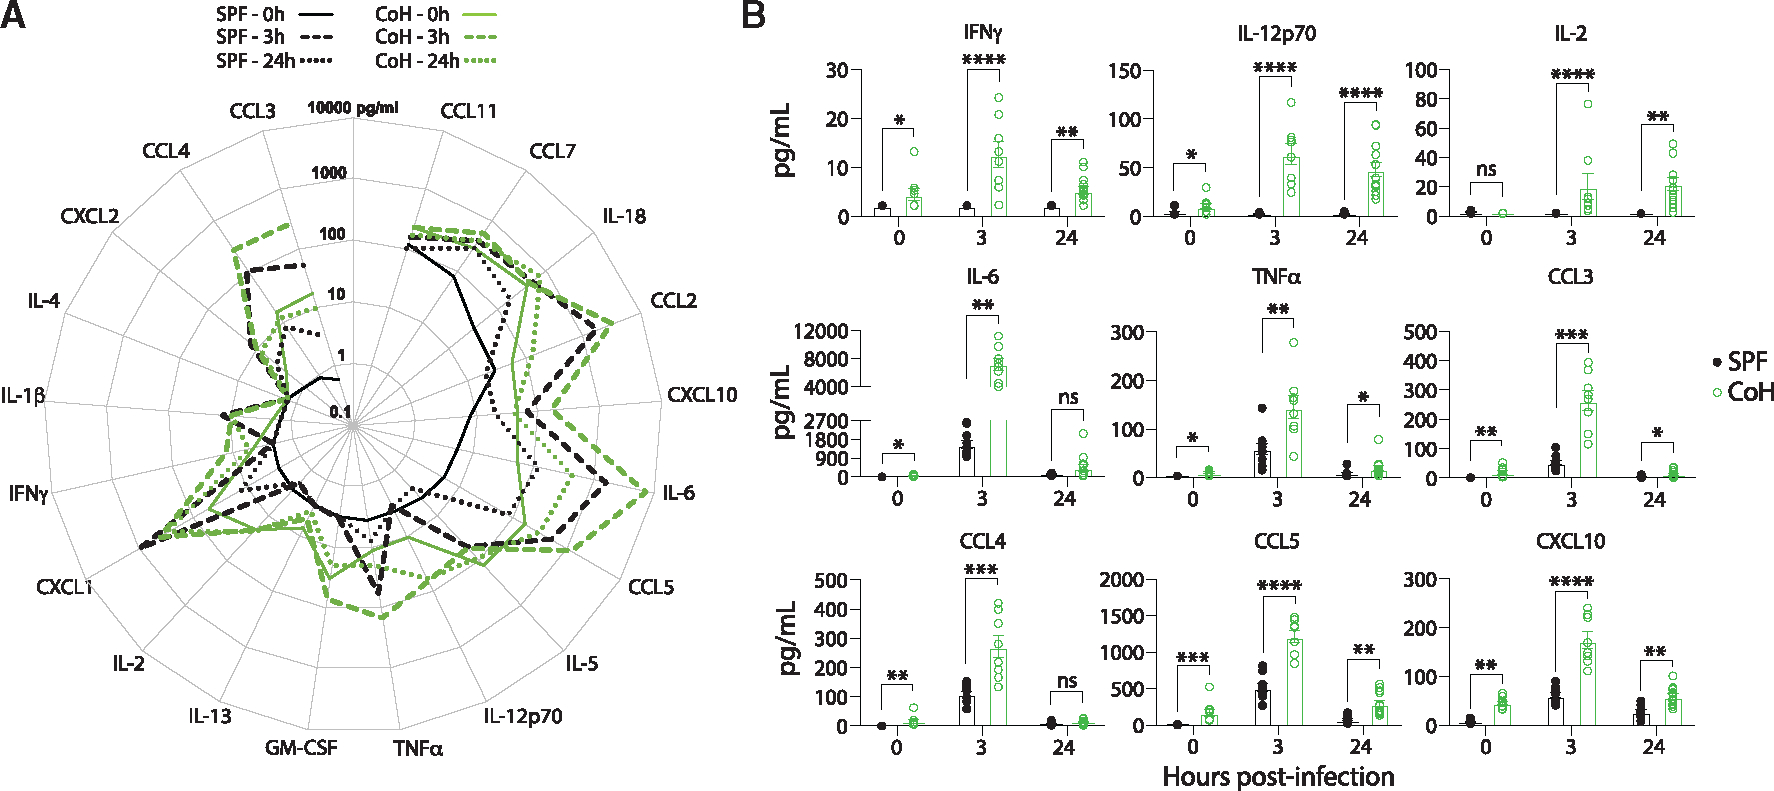
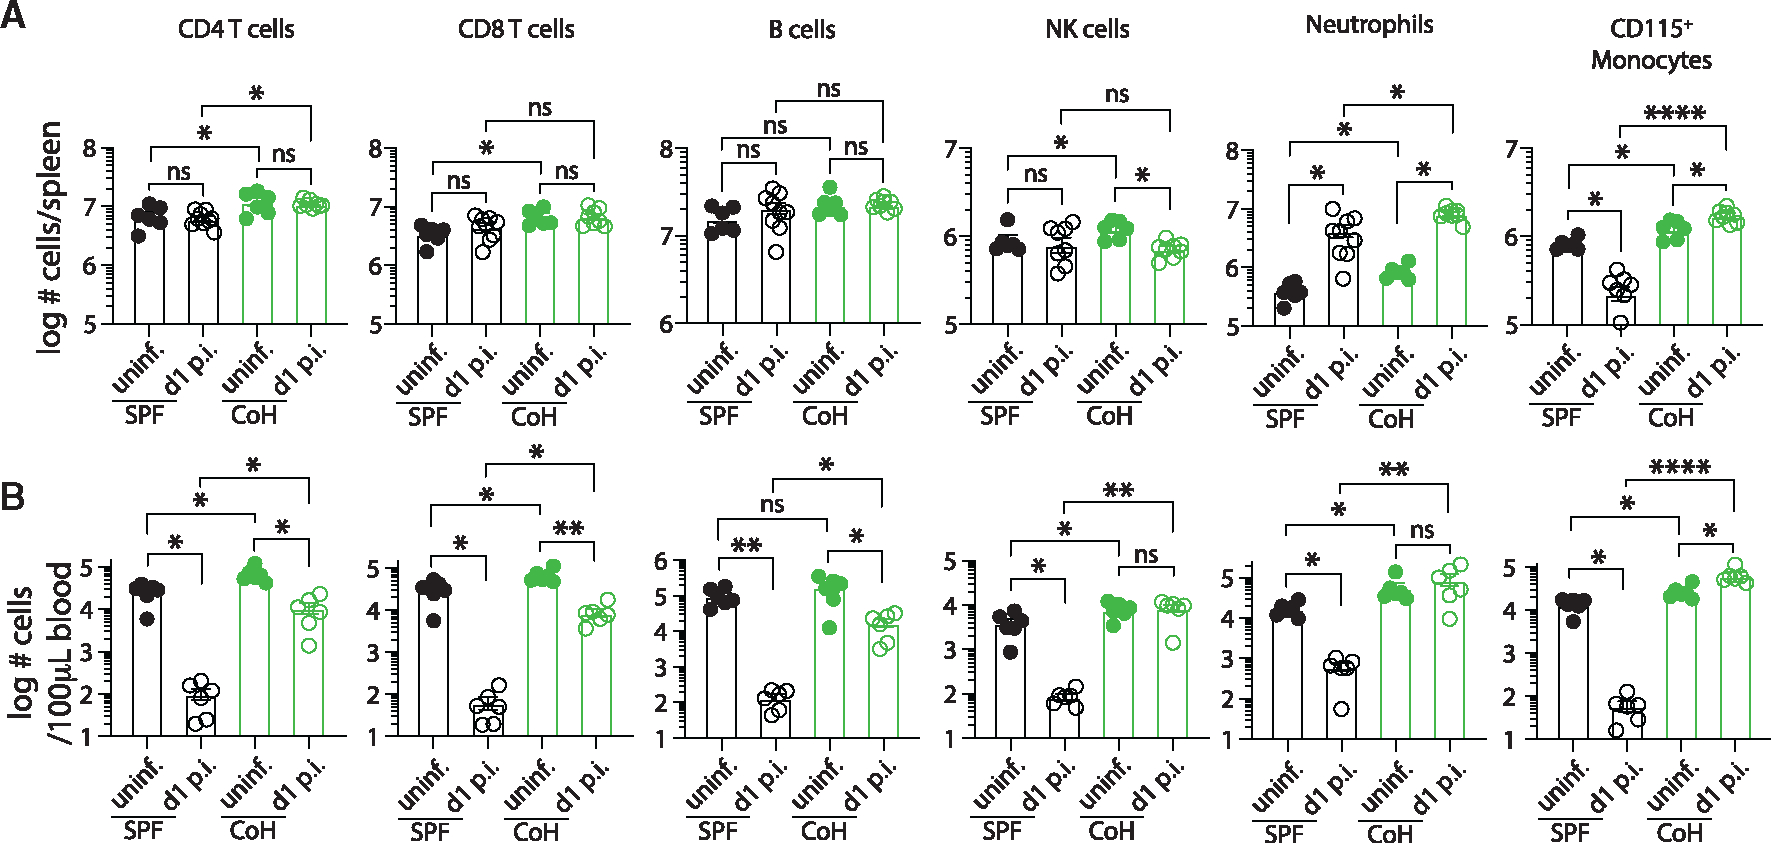
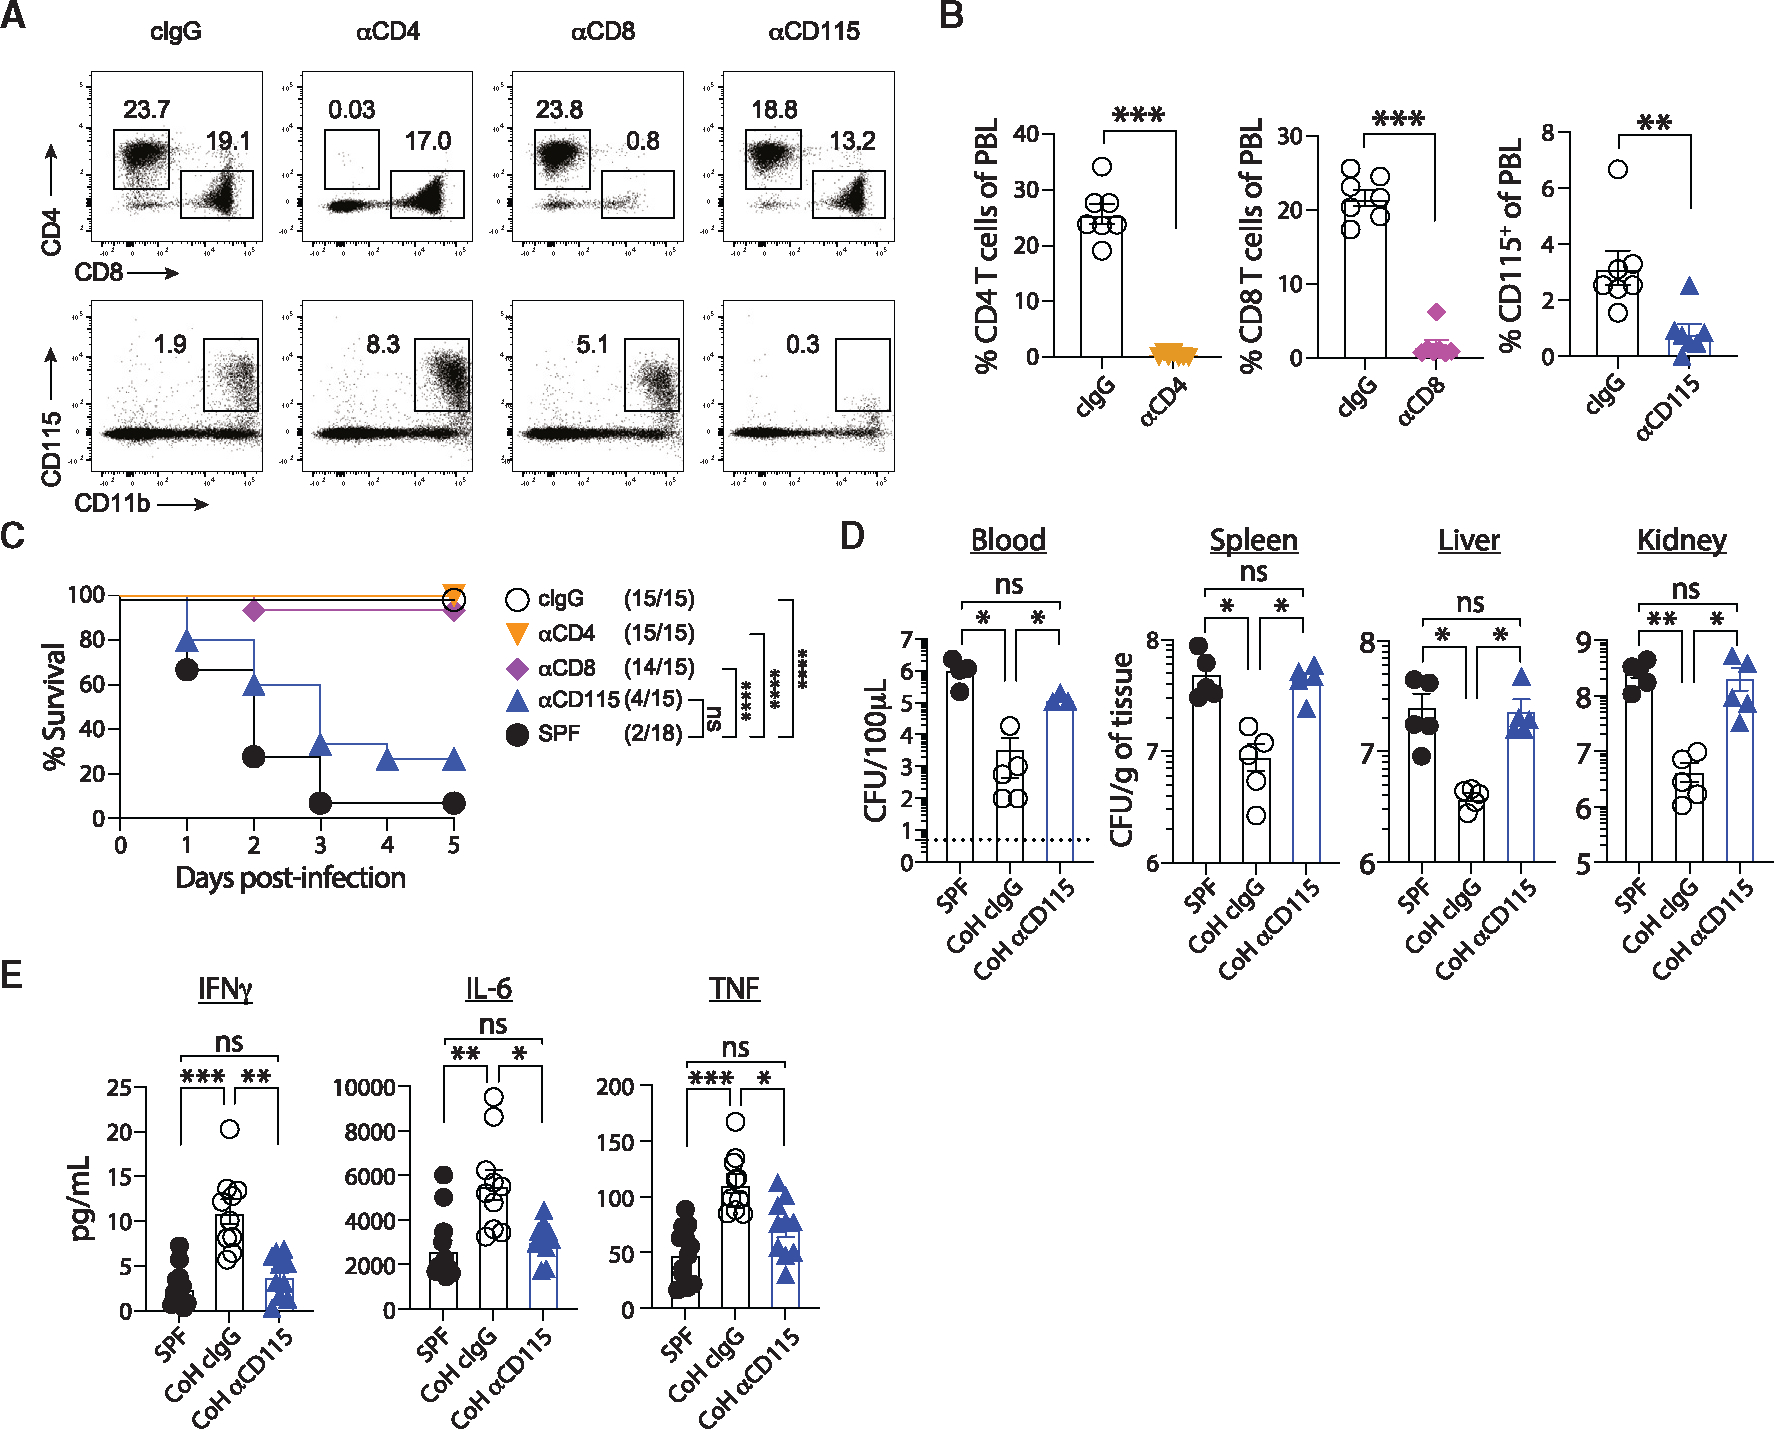
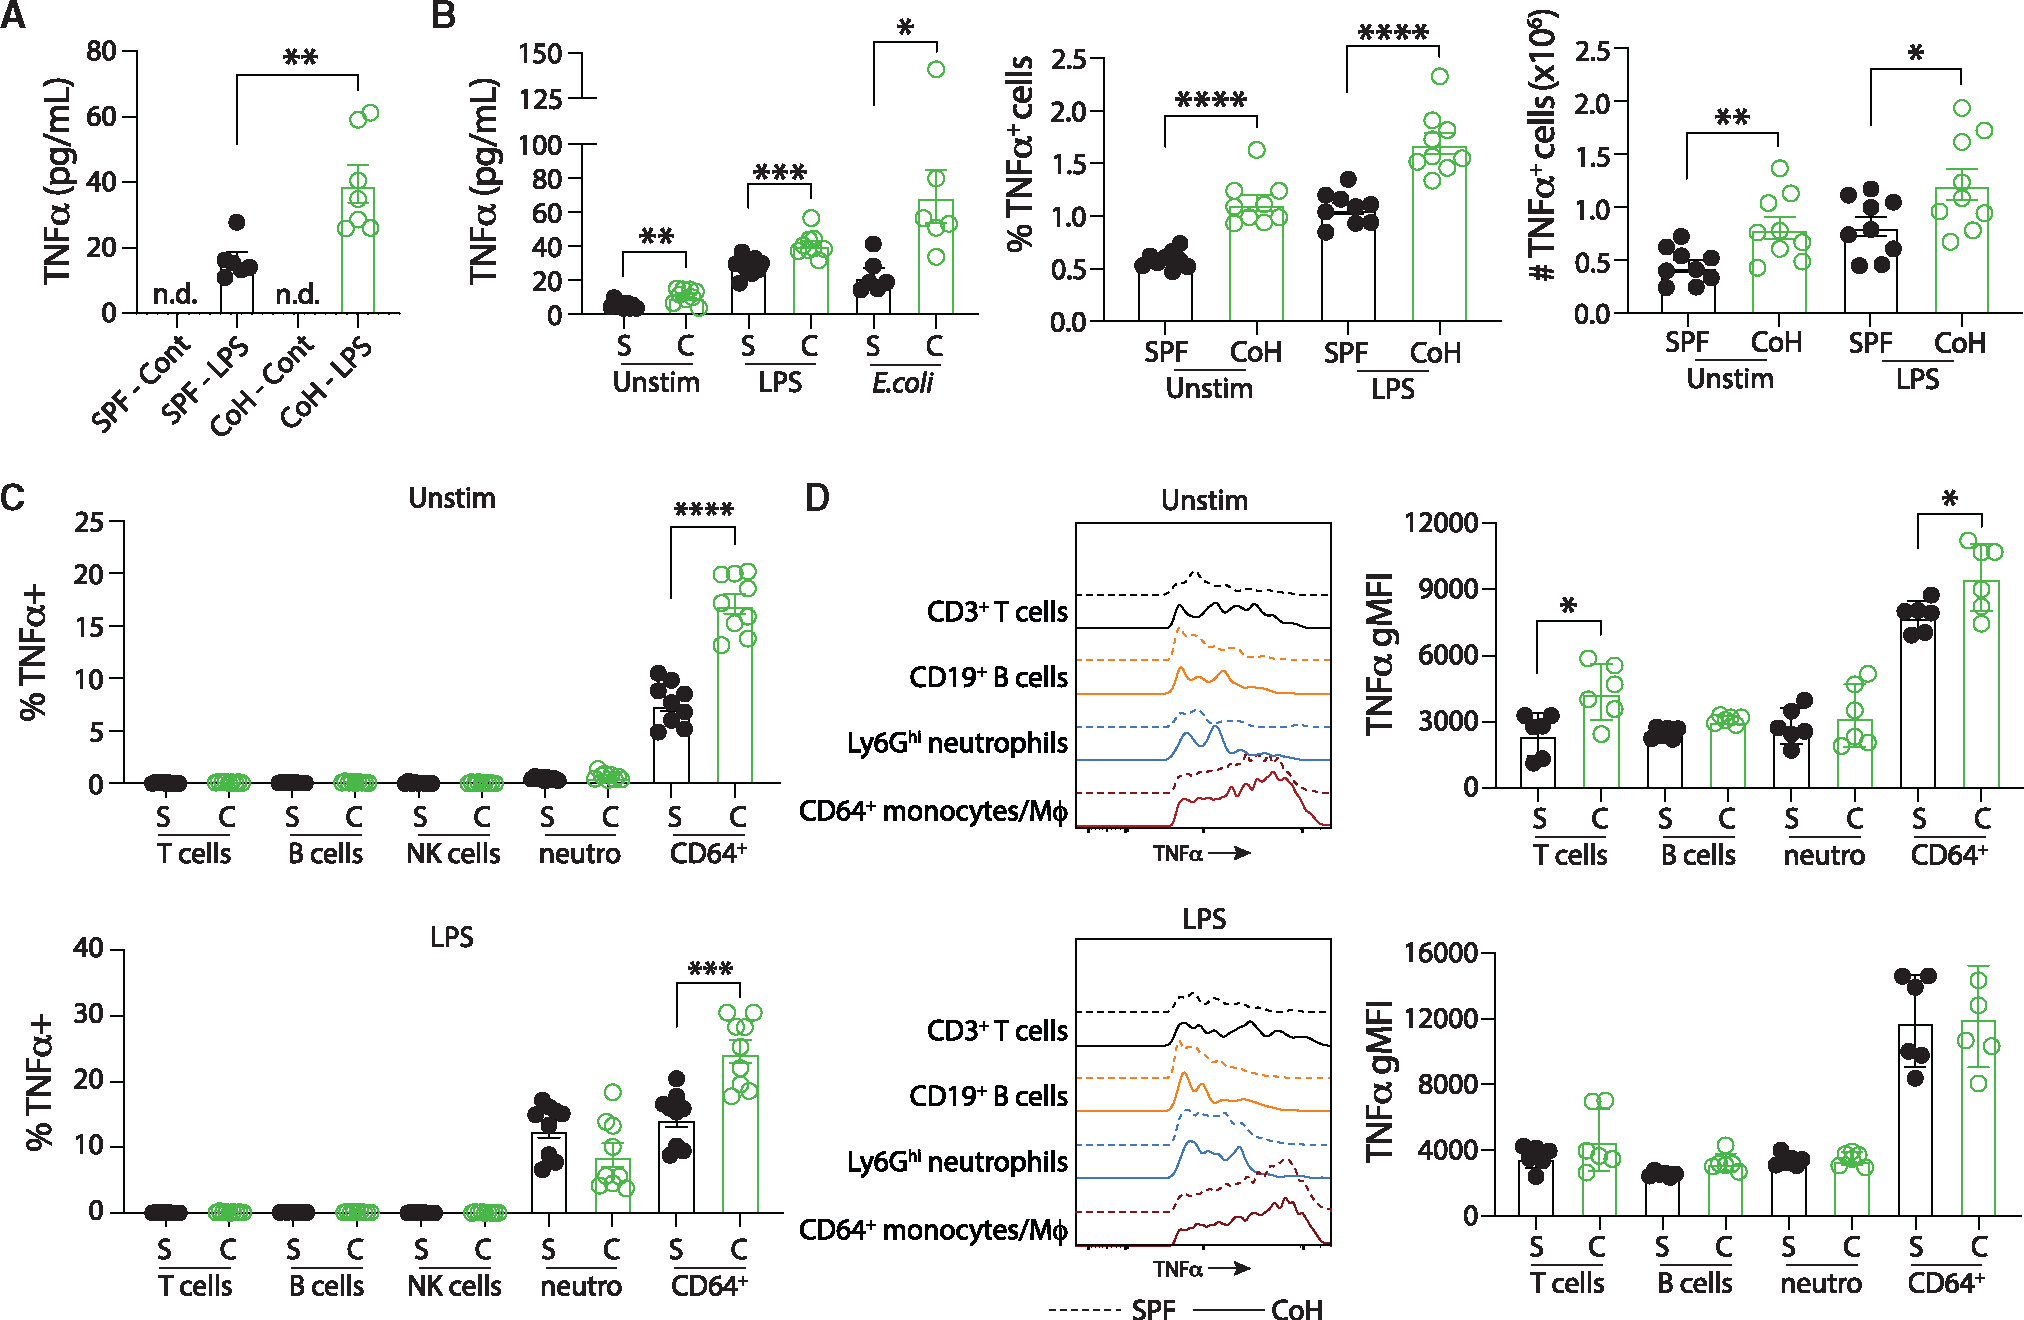
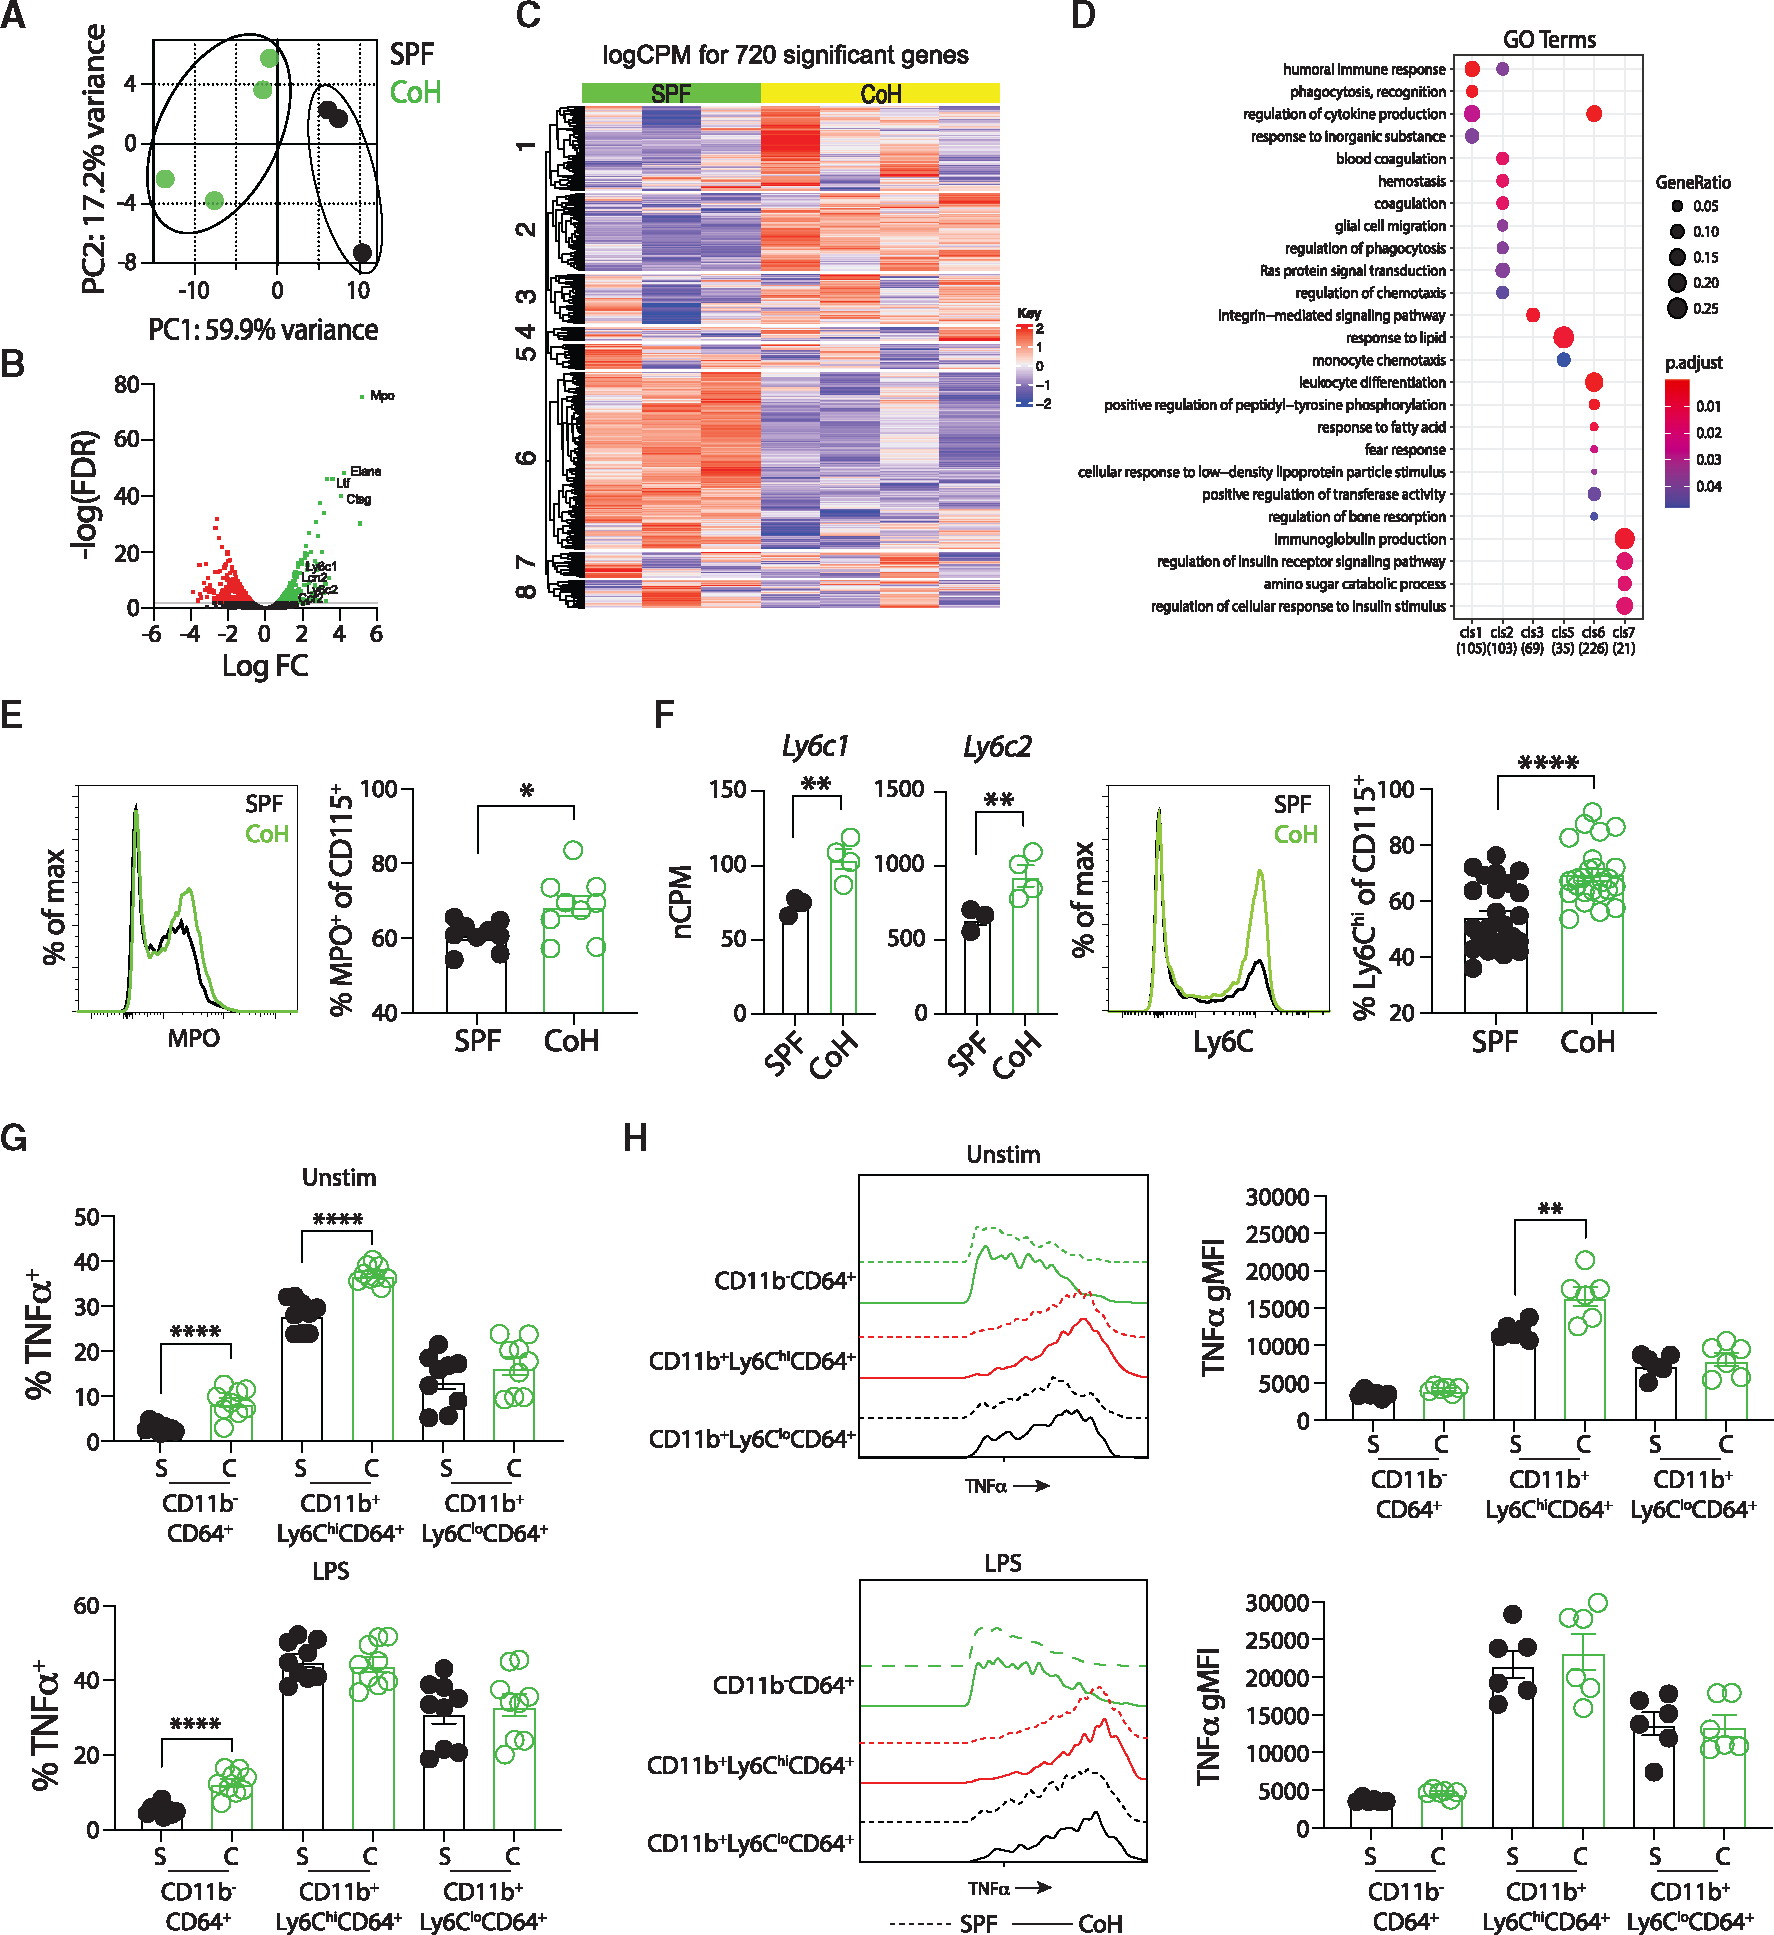
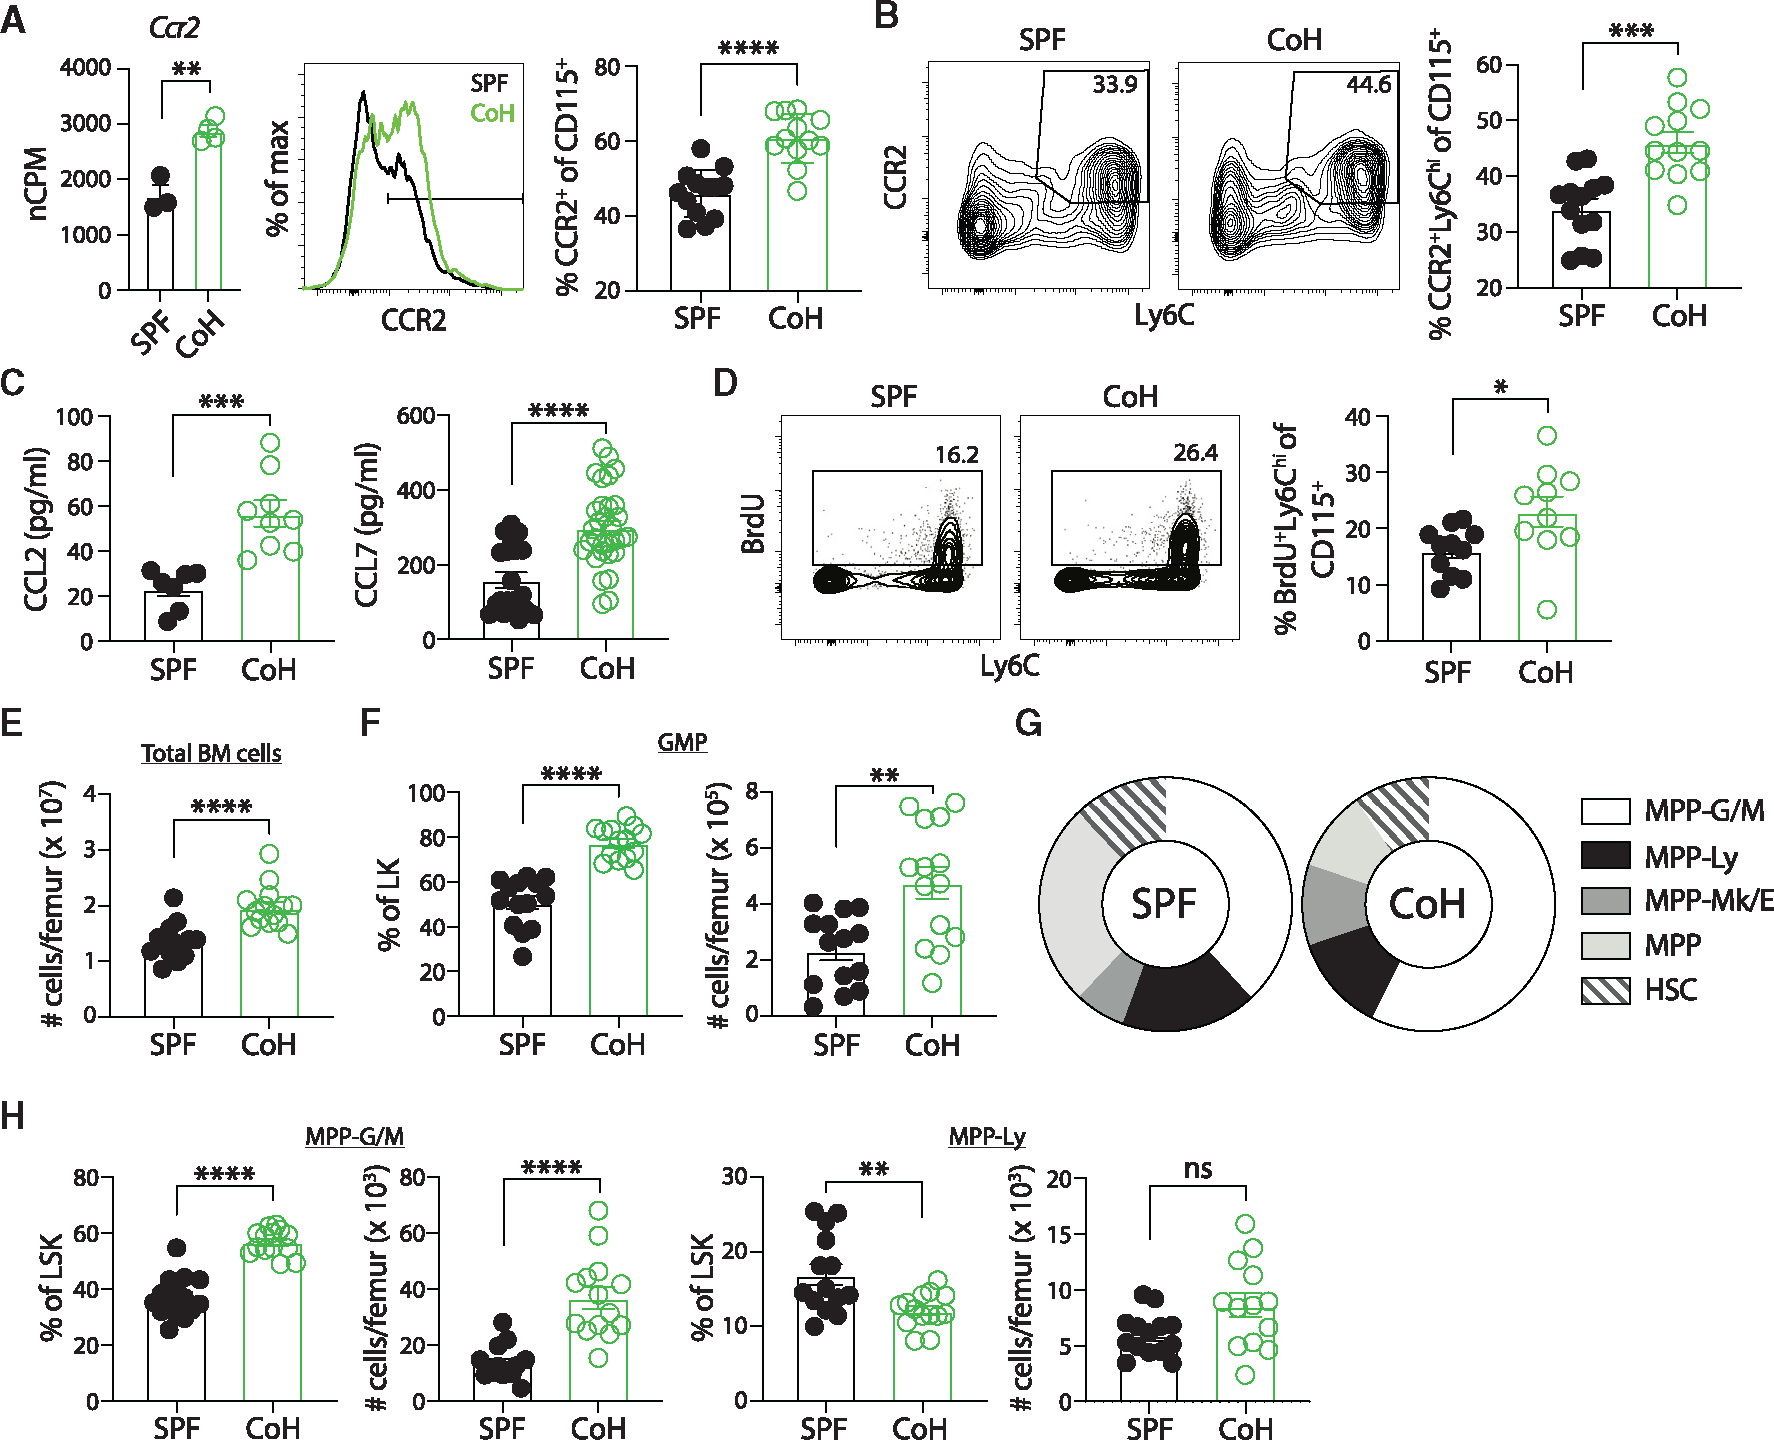
Uropathogenic E. coli (UPEC) is a primary organism responsible for urinary tract infections and a common cause of sepsis. Microbially experienced laboratory mice, generated by cohousing with pet store mice, exhibit increased morbidity and mortality to polymicrobial sepsis or lipopolysaccharide challenge. By contrast, cohoused mice display significant resistance, compared with specific pathogen-free mice, to a monomicrobial sepsis model using UPEC. CD115+ monocytes mediate protection in the cohoused mice, as depletion of these cells leads to increased mortality and UPEC pathogen burden. Further study of the cohoused mice reveals increased TNF-α production by monocytes, a skewing toward Ly6ChiCD115+ "classical" monocytes, and enhanced egress of Ly6ChiCD115+ monocytes from the bone marrow. Analysis of cohoused bone marrow also finds increased frequency and number of myeloid multipotent progenitor cells. These results show that a history of microbial exposure impacts innate immunity in mice, which can have important implications for the preclinical study of sepsis.


Conflict of interest statement

DECLARATION OF INTERESTS The authors declare no competing interests.

Figures

Figure 1.
Figure 1.. Microbially experienced CoH mice demonstrate increased resistance against systemic UPEC-induced sepsis
Female SPF and CoH mice were infected with 4 × 10⁷ colony forming units (CFUs) of uropathogenic E. coli (UPEC) intravenously. (A) Survival at the indicated days post-infection. (B) Bacterial CFU per 100 μL of blood or gram of spleen, liver, and kidney tissue of SPF and CoH mice 24 h following infection. *p ≤ 0.05, **p ≤ 0.01, and ***p ≤ 0.005 as determined by log rank test in (A) or nonparametric Mann-Whitney test in (B). Data in (A) were combined from two experiments lasting 5–7 days using a total of 14–18 mice per group. Data in (B) are representative from three experiments using 4–5 mice per group, where each symbol represents a mouse and bars indicate means with SEM. Dashed line in (B) indicates limit of detection of the assay.
Figure 2.
Figure 2.. CoH mice exhibit a heightened inflammatory response following systemic UPEC-induced sepsis
Blood was collected from SPF and CoH mice prior to infection (0 h), and 3 and 24 h after infection with 4 × 10⁷ CFU UPEC i.v. The concentration of 20 cytokines and chemokines in the serum was determined by Luminex. (A) Radar plot shows the average steady state, 3 and 24 h post-infection serum concentrations (pg/mL) of the indicated cytokines and chemokines. (B) Amount (pg/mL) of IFN-γ, IL-12p70, IL-2, IL-6, TNF-α, CCL3, CCL4, and CCL5 in serum prior to (0 h), and 3 and 24 h after UPEC infection. For statistical comparisons, SPF mice with undetectable cytokines were given a value of “0.” **p ≤ 0.01, ***p ≤ 0.005, and ****p < 0.0001 as determined by nonparametric Mann-Whitney test. Data in (A) and (B) were combined from two experiments using a total of 7–10 mice per group, where each symbol in (B) represents a mouse and bars indicate means with SEM.
Figure 3.
Figure 3.. CoH mice exhibit increased numbers of CD115+ monocytes following systemic UPEC infection
Number of CD4 T cells, CD8 T cells, B cells, NK cells, neutrophils, and CD115+ monocytes in the (A) spleen and (B) blood of SPF and CoH mice before and 24 h after systemic UPEC infection. *p ≤ 0.05, **p ≤ 0.01, ***p ≤ 0.005, and ****p < 0.0001 as determined by Kruskal-Wallis test, with a Dunn’s post hoc test to correct for multiple comparisons. Data in (A) and (B) were combined from two experiments using a total of 6–9 mice per group, where each symbol represents a mouse and bars indicate means with SEM.
Figure 4.
Figure 4.. CD115+ cells mediate protection in CoH mice against systemic UPEC infection
(A–C) CoH mice were injected with control IgG or mAb to deplete CD4 T cells, CD8 T cells, or CD115+ monocytes. (A) Representative dot plots showing detection of CD4 and CD8 T cells (top) and CD115+ monocytes (bottom) in CoH mice after injection with control IgG or anti-CD4, -CD8, or -CD115 depleting mAbs. (B) Percentage of CD4 T cells, CD8 T cells, or CD115+ monocytes among peripheral blood lymphocytes in CoH mice injected with control IgG or anti-CD4, -CD8, or -CD115 depleting mAbs. (C) Survival of SPF mice, CoH mice injected with anti-CD115, anti-CD8, anti-CD4, or control IgG at the indicated days post-infection. (D) Bacterial CFU per 100 μL of blood or grams of spleen, liver, and kidney 24 h following UPEC infection from SPF mice, CoH mice injected with control IgG, or CoH mice injected with anti-CD115 mAbs. (E) Serum IFN-γ, IL-6, and TNF-α concentrations from SPF mice, CoH mice injected with control IgG, or CoH mice injected with anti-CD115 mAb 3 h following UPEC infection. ns, not significant, *p ≤ 0.05, **p ≤ 0.01, ***p ≤ 0.001, and ***p ≤ 0.0001, as determined by nonparametric Mann-Whitney test (B), log rank test (C), or Kruskal-Wallis test, with a Dunn’s post hoc test to correct for multiple comparisons (D and E). Data in (A) and (B) are representative from three experiments using 7–8 mice per group, or 4–5 mice per group in (D). Combined data from three experiments using a total of 15–18 mice per group are in (C), and two experiments using a total of 10–12 mice per group are in (E). Each symbol in (B, D, and E) represents a mouse and bars indicate means with SEM. Dashed line in (D) indicates limit of detection of the assay.
Figure 5.
Figure 5.. CoH monocyte/Mφ produce more TNF-α than SPF monocyte/Mφ during in vitro culture
(A) Steady-state innate immune function was measured ex vivo by adding heparinized whole blood to tubes containing RPMI alone (“control” tubes) or RPMI and 0.5 ng/mL LPS and incubated for 4 h at 37°C. The amount of TNF-α in the supernatant was determined by ELISA. (B) SPF and CoH splenocytes (2 × 10⁶ cells) were incubated alone or with either LPS (100 ng/mL) or UPEC (5:1 UPEC:splenocytes) for 4 h. The amount of TNF-α in the supernatant was then measured by ELISA (left) and the frequency (middle) and number (right) of TNF-α+ cells was determined by flow cytometry. (C) The frequency of TNF-α+ cells within T cells, B cells, NK cells, neutrophils, and CD64+ monocytes/M4 from the unstimulated and LPS-stimulated splenocyte cultures were also determined by flow cytometry. (D) Geometric mean fluorescence intensity (gMFI) of TNF-α expression by unstimulated and LPS-stimulated TNF-α+ T cells, B cells, NK cells, neutrophils, and CD64+ monocytes/Mφ was determined by flow cytometry. Representative plots and cumulative data are shown and data in (A–D) were combined from at least two independent experiments using a total of 6–9 mice per group, where each symbol represents a mouse and bars indicate means with SEM. *p ≤ 0.05, **p ≤ 0.01, ***p ≤ 0.005, and ****p < 0.0001 as determined by nonparametric Mann-Whitney test.
Figure 6.
Figure 6.. CoH mice have increased frequency of “classical” Ly6Chi CD115+ monocytes at steady state that produce more TNF-α
(A–D) CD11b+CD115+ monocytes were flow sort-purified from spleens of steady-state SPF and CoH mice, RNA was isolated, bulk RNA-seq analysis was performed, and comparison of gene expression was conducted. (A) Principal-component analysis from RNA-seq data showing unique clustering of CD115+ monocytes from steady-state SPF and CoH mice. (B) Volcano plot of log false discovery rate (FDR, y axis) by log fold change (x axis). Genes with an FDR < 0.01 with increased expression in CD115+ monocytes from spleens of steady-state CoH mice compared with SPF mice are shown in green, while genes with an FDR < 0.01 with decreased expression in CD115+ monocytes from spleens of steady-state CoH mice compared with SPF mice are shown in red. (C) Heatmap showing relative gene expression in CD115+ monocytes from spleens of steady-state SPF and CoH mice. Seven hundred and twenty genes were differentially expressed with an FDR < 0.01. (D) GO term analysis for pathways differentially regulated between CD115+ monocytes from spleens of steady-state CoH and SPF mice. (E) Representative histogram of MPO expression in SPF and CoH CD115+ monocyte/Mφ (left) and frequency of myeloperoxidase (MPO)+ cells among CD115+ monocytes in the spleen as measured by flow cytometry (right). (F) Number of Ly6c1 and Ly6c2 mRNA transcripts in CD115+ monocytes from steady-state SPF and CoH mice (left), representative histogram of Ly6C protein expression on SPF and CoH CD115+ monocytes (middle), and frequency of Ly6C+ cells among CD115+ monocytes in the spleens of CoH mice (right). (G) Frequency of TNF-α+ cells within CD11bCD64+ resident macrophages, Ly6ChiCD64+ monocytes, and Ly6CloCD64+ monocytes in the spleens of SPF and CoH at steady-state and after in vitro LPS stimulation (100 ng/mL). (H) Geometric mean fluorescence intensity (gMFI) of TNF-α expression by unstimulated and LPS-stimulated TNF-a+CD11bCD64+ resident macrophages (green), CD11b+Ly6ChiCD64+ classical (red), and CD11b+Ly6CloCD64+ non-classical (black) monocytes was determined by flow cytometry (left). Dashed lines, SPF; solid lines, CoH. TNF-α gMFI within TNF-α+CD11bCD64+ resident macrophages, Ly6ChiCD64+ classical monocytes, and Ly6CloCD64+ non-classical monocytes in the spleens of SPF and CoH at steady-state and after in vitro LPS stimulation (right). *p ≤ 0.05, **p ≤ 0.01, ***p ≤ 0.005, and ****p < 0.0001 as determined by nonparametric Mann-Whitney test. Transcript (normalized copies per million [nCPM]) data in (F) were obtained from 3 to 4 mice per group. Flow data in (E) were combined from two experiments using a total of 9 mice per group, in (F) were combined from three experiments using a total of 25–26 mice per group, in (G) were combined from three experiments using a total of 8–9 mice per group, in (H) were combined from two experiments using 3 mice per group. Each symbol in (A and E–H) represents a mouse and bars indicate means with SEM.
Figure 7.
Figure 7.. Increased egress of “classical” Ly6Chi CD115+ monocytes from bone marrow and enhanced myelopoiesis in steady-state CoH mice
(A) Number of Ccr2 mRNA transcripts in CD115+ monocytes from steady-state SPF and CoH mice (left), representative histogram of CCR2 protein expression on SPF and CoH CD115+ monocytes (middle), and frequency of CCR2+ cells among CD115+ monocytes in the spleens of SPF and CoH mice as measured by flow cytometry (right). (B) Representative flow cytometry plots showing expression of CCR2 and Ly6C double-positive cells from CD11b+CD115+ splenocytes (left) and frequency of CCR2+Ly6Chi CD115+ monocytes (right). (C) Concentration of CCL2 and CCL7 in serum of mice 60 days after cohousing using Luminex. (D) SPF and CoH mice were injected with 1 mg BrdU i.p. Blood was collected 16 h later, and peripheral blood leukocytes were stained to detect BrdU+ Ly6ChiCD115+ monocytes by flow cytometry. (E–H) Bone marrow was isolated from steady-state SPF and CoH mice and progenitor populations were analyzed (see Figure S6A for gating strategy). (E) Total number of bone marrow cells per femur of SPF and CoH mice. (F) Absolute number per femur and percentage of granulocyte/monocyte progenitors (GMP) (lineageSca1cKit+CD16+) within the lineagecKit+ (LK) progenitor population. (G) Percentage of multipotent progenitor (MMP) populations within the lineageSca1+cKit+ (LSK) population. MPP-granulocyte/monocyte (G/M) (Flt3CD48+CD150), MPP-lymphocyte (Ly) (Flt3+), MPP-megakaryocyte/erythrocyte (Mk/E) (Flt3CD48+CD150+), MPP (Flt3CD48CD150), and hematopoietic stem cell (HSC) (Flt3CD48CD150+). (H) Absolute number per femur and percentage of MPP-G/M (left) and MPP-Ly (right) within the LSK population. *p ≤ 0.05, **p ≤ 0.01, ***p ≤ 0.005, and ****p < 0.0001 as determined by nonparametric Mann-Whitney test. Transcript (normalized copies per million [nCPM]) data in (A) were obtained from 3 to 4 mice per group. Flow data in (A) and (B) were combined from three experiments using a total of 12–13 mice per group, (C) were combined from at least two experiments with a total of 7–31 mice per group, (D) were combined from three experiments using a total of 10–11 mice per group, (E–H) were combined from three independent experiments using a total of 14 mice per group. Each symbol represents a mouse and bars indicate means with SEM.

Similar articles

Cited by

References

    1. Singer M, Deutschman CS, Seymour CW, Shankar-Hari M, Annane D, Bauer M, Bellomo R, Bernard GR, Chiche JD, Coopersmith CM, et al. (2016). The Third International Consensus Definitions for Sepsis and Septic Shock (Sepsis-3). JAMA 315, 801–810. 10.1001/jama.2016.0287. - DOI - PMC - PubMed
    1. Rhee C, Dantes R, Epstein L, Murphy DJ, Seymour CW, Iwashyna TJ, Kadri SS, Angus DC, Danner RL, Fiore AE, et al. (2017). Incidence and Trends of Sepsis in US Hospitals Using Clinical vs Claims Data. JAMA 318, 1241–1249. 10.1001/jama.2017.13836. - DOI - PMC - PubMed
    1. Rudd KE, Johnson SC, Agesa KM, Shackelford KA, Tsoi D, Kievlan DR, Colombara DV, Ikuta KS, Kissoon N, Finfer S, et al. (2020). Global, regional, and national sepsis incidence and mortality, 1990–2017: analysis for the Global Burden of Disease Study. Lancet 395, 200–211. 10.1016/S0140-6736(19)32989-7. - DOI - PMC - PubMed
    1. Dolin HH, Papadimos TJ, Chen X, and Pan ZK (2019). Characterization of Pathogenic Sepsis Etiologies and Patient Profiles: A Novel Approach to Triage and Treatment. Microbiol. Insights 12, 1178636118825081. 10.1177/1178636118825081. - DOI - PMC - PubMed
    1. Mas-Celis F, Olea-López J, and Parroquin-Maldonado JA (2021). Sepsis in Trauma: A Deadly Complication. Arch. Med. Res. 52, 808–816. 10.1016/j.arcmed.2021.10.007. - DOI - PubMed

Publication types

Substances