. 2023 Dec 4:14:1198905.
doi: 10.3389/fimmu.2023.1198905. eCollection 2023.

Creeping fat exhibits distinct Inflammation-specific adipogenic preadipocytes in Crohn's disease

Affiliations

Creeping fat exhibits distinct Inflammation-specific adipogenic preadipocytes in Crohn's disease

Nahee Hwang et al. Front Immunol. .

Abstract

Creeping fat (CrF) is an extraintestinal manifestation observed in patients with Crohn's disease (CD). It is characterized by the accumulation of mesenteric adipose tissue (MAT) that wraps around the intestinal wall. Although the role of CrF in CD is still debated, multiple studies have highlighted a correlation between CrF and inflammation, as well as fibrostenosais of the intestine, which contributes to the worsening of CD symptoms. However, the mechanism underlying the potential role of CrF in the development of Crohn's fibrosis remains an enigma. This study aimed to analyze CrF comprehensively using single-cell RNA sequencing analysis. The data was compared with transcriptomic data from adipose tissue in other disease conditions, such as ulcerative colitis, lymphedema, and obesity. Our analysis classified two lineages of preadipocyte (PAC) clusters responsible for adipogenesis and fibrosis in CrF. Committed PACs in CrF showed increased cytokine expression in response to bacterial stimuli, potentially worsening inflammation in patients with CD. We also observed an increase in fibrotic activity in PAC clusters in CrF. Co-analyzing the data from patients with lymphedema, we found that pro-fibrotic PACs featured upregulated pentraxin-3 expression, suggesting a potential target for the treatment of fibrosis in CrF. Furthermore, PACs in CrF exhibited a distinct increase in cell-to-cell communication via cytokines related to inflammation and fibrosis, such as CCL, LIGHT, PDGF, MIF, and SEMA3. Interestingly, these interactions also increased in PACs of the lymphedema, whereas the increased MIF signal of PACs was found to be a distinct characteristic of CrF. In immune cell clusters in CrF, we observed high immune activity of pro-inflammatory macrophages, antigen-presenting macrophages, B cells, and IgG+ plasma cells. Finally, we have demonstrated elevated IgG+ plasma cell infiltration and increased pentraxin-3 protein levels in the fibrotic regions of CrF in CD patients when compared to MAT from both UC patients and healthy individuals. These findings provide new insights into the transcriptomic features related to the inflammation of cells in CrF and suggest potential targets for attenuating fibrosis in CD.

Keywords: Crohn’s disease; creeping fat; fat fibrosis; fibroblast; inflammation; inflammatory bowel disease; pentraxin-3; preadipocytes.


Conflict of interest statement

The authors declare that the research was conducted in the absence of any commercial or financial relationships that could be construed as a potential conflict of interest.

Figures
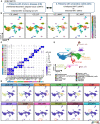
Figure 1
Figure 1
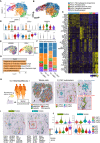
Single-Cell RNA-Seq Reveals Cellular Diversity and Heterogeneity in Mesenteric Adipose Tissue of Patients with CD and UC. (A) Schematic representation of the experimental procedure: Uninflamed mesenteric adipose tissue (n = 3; CD_uiMAT) and inflamed mesenteric adipose tissue (n = 3; CD_CrF) from patients with Crohn’s disease, as well as uninflamed mesenteric adipose tissue (n = 2; UC_uiMAT) and inflamed mesenteric adipose tissue (n = 2; UC_iMAT) from patients with ulcerative colitis, were obtained from GSE156776 (B) A uniform manifold approximation projection (UMAP) plot revealed 18 clusters of 8378 cells. (C, D) Dot plots and feature plots were used to visualize the expression of established marker genes for each lineage in each cluster. (E) UMAP plot showing the annotation derived from panels (C, D).
Figure 2
Figure 2
Analysis of Differentially Expressed Genes Reveals Distinct Transcriptomic Characteristics of Immune Cell Subclusters in CrF. (A) UMAP plot shows the macrophages isolated from Figure 1E , and the cluster analysis revealed three distinct clusters. (B) RNA-velocity analysis was performed on the macrophage clusters, with the velocity field projected onto the UMAP plot from (A). The arrows depict the local average velocity assessed on a regular grid, indicating the extrapolated future states of cells. (C) Violin plots showing the RNA expression levels of selected cluster markers for specific cell clusters. (D) Distinct expression profiles of the three subpopulations of macrophages (E) Enriched Gene Ontology terms of the molecular signature for each subpopulation, hypergeometric test, adjusted p < 0.01. (F) UMAP plot shows the B cells and plasma cells isolated from Figure 1E , and the cluster analysis revealed three distinct clusters. (G) Violin plots showing the RNA expression levels of selected cluster markers for specific cell clusters. (H) Distinct expression profiles of the three subpopulations of B cells and plasma cells (I) Enriched Gene Ontology terms of the molecular signature for each subpopulation, hypergeometric test, adjusted p < 0.01. *** adjusted p < 0.001.
Figure 3
Figure 3
CrF Is Characterized by an Increase in Committed PACs and Their Enhanced Inflammatory Response. (A) UMAP plot shows the PACs isolated from Figure 1E , and the cluster analysis revealed five distinct clusters. (B) RNA-velocity analysis was performed on the PAC clusters, with the velocity field projected onto the UMAP plot from (A). The arrows depict the local average velocity assessed on a regular grid, indicating the extrapolated future states of cells. (C) Distinct expression profiles of the three PAC subpopulations. (D) Violin plots showing the RNA expression levels of selected cluster markers for specific cell clusters (E) Feature plots depict the expression of CEBPB and FBN1 in PACs. (F) A bar plot showing the proportion of subclusters within a PAC cluster for each patient group. (G) Enriched Gene Ontology terms of the molecular signature for each subpopulation, hypergeometric test, adjusted a p < 0.01. (H) Schematic representation of the experimental procedure. Spatial transcriptomic data of subcutaneous adipose tissue from lean individuals (n = 3) and those with obesity (n = 5) were recruited from 10.17632/3bs5f8mvbs (left). The distribution of the overall cell clusters (middle) and subclusters of S_PACs (preadipocytes from the spatial transcriptomic data, right) is shown across an adipose tissue section of an obese individual. (I) Spatial representation of each module, consisting of the top 15 upregulated genes, for S_PAC2 and S_PAC3, respectively. (J) Violin plots showing the expression levels of each module in PACs from Figure 4H (top) and (A) (bottom). *** adjusted p < 0.001.
Figure 4
Figure 4
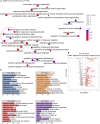
Pro-Inflammatory and Fibrotic Signatures Increase in Committed PACs in CrF. (A) ClusterProfiler revealed upregulated pathways of PAC2 in CD_CrF versus CD_uiMAT. Adjusted p < 0.05 was statistically significant. The pathways associated with the response to bacterial origin are indicated by red circles. (B) Volcano plot highlighting genes belonging to the pathway of Response to molecule of bacterial origin in up-regulated DEGs of PAC2 in CD_CrF versus CD_ uiMAT. (C) Enriched Gene Ontology terms of the molecular signature for each subpopulation in CD_CrF. Adjusted p < 0.01, hypergeometric test.
Figure 5
Figure 5
Fibrotic PACs in Both CD Patients and Lymphedema Patients Exhibit Transcriptional Similarities. (A) Schematic representation of the experimental procedure. Data of patients with cancer-related lymphedema (n = 5) and healthy individuals (n = 4) were recruited from HRA000901 (left). UMAP revealed 21 distinct cellular clusters of 70209 cells, of which c0, c1, c3, and c5 were identified as preadipocytes based on the expression of established marker genes. (right) (B, C) The expression levels of each module, which consisted of the top 10 upregulated genes in each PAC subcluster from (A), were analyzed in preadipocytes from Figure 3A . (D) The Venn diagram illustrated the number of overlapping DEGs between similar preadipocyte cell clusters in CD_CrF and lymphedema data. The enriched Gene Ontology terms related to fibrosis were analyzed using the overlapping DEGs, and the genes belonging to these pathways are shown. ** adjusted p < 0.01; *** adjusted p < 0.001
Figure 6
Figure 6
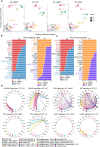
PACs Play a Key Role in Distinctive Cell-to-Cell Communication in CrF. (A) Scatter plots showing the strength of outgoing and incoming interactions, enabling identification of the cell populations exhibiting significant changes in sending or receiving signals. (B) Bar plots showing the ranking of outgoing signals of PACs in CD_CrF versus CD_uiMAT (left) and UC_iMAT versus UC_uiMAT (right). The ranking of signals was determined based on differences in the strength of information flow, calculated as the sum of communication probabilities among all pairs of cell groups in the inferred network. (C) Bar plots showing the ranking of incoming signals of PACs in CD_CrF versus CD_uiMAT (left) and UC_iMAT versus UC_uiMAT (right). (D) Circle plots showing the inferred signaling network upregulated in CD_CrF. The arrows and edge color represent the direction (source: target). The edge colors are consistent with the sources as sender, and edge weights are proportional to the interaction strength. Thicker edge line indicates a stronger signal.
Figure 7
Figure 7
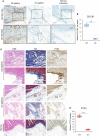
High Fibrotic CrF Exhibits Increased IgG+ Plasma Cells and Pentraxin-3 Expression in CD Patients. (A, D) Representative images for histopathological evaluation of CrF in CD patients (n=3), iMAT in UC patients (n=3), and MAT from a normal individual (n=1). (A) IgG+ plasma cells were stained with CD138 (syndecan-1). (B) Densitometry analysis of CD138+ cells in (A, Figure S9 ). Box plots compare the relative CD138+ cell regions in CD and UC patient samples to those in the normal sample. (C) Hematoxylin-eosin (H&E) and masson trichrome (MT, staining tissue fibers), and pentraxin-3 (PTX3) staining was presented separately. (D) Box plots compare the relative PTX3 intensity in CD and UC patient samples to those in the normal sample. *** p < 0. 001; two-tailed t test.
Figure 8
Figure 8
A Schematic Showing the Results of This Study. The committed PACs in CrF demonstrated both pro-inflammatory and pro-fibrotic activity, as well as specific cell-to-cell interactions within CrF.

References

    1. Collaborators GBDIBD . The global, regional, and national burden of inflammatory bowel disease in 195 countries and territories, 1990-2017: a systematic analysis for the Global Burden of Disease Study 2017. Lancet Gastroenterol Hepatol (2020) 5(1):17–30. doi: 10.1016/S2468-1253(19)30333-4 - DOI - PMC - PubMed
    1. Bernstein CN, Eliakim A, Fedail S, Fried M, Gearry R, Goh KL., et al. World Gastroenterology Organisation Global Guidelines Inflammatory Bowel Disease : Update August 2015. World Gastroenterology Organisation; (2015). J Clin Gastroenterol 50(4):803–18. doi: 10.1097/mcg.0000000000000660 - DOI - PubMed
    1. Lee JM, Lee KM. Endoscopic diagnosis and differentiation of inflammatory bowel disease. Clin Endosc. (2016) 49(4):370–5. doi: 10.5946/ce.2016.090 - DOI - PMC - PubMed
    1. Sartor RB. Mechanisms of disease: pathogenesis of Crohn's disease and ulcerative colitis. Nat Clin Pract Gastroenterol Hepatol (2006) 3(7):390–407. doi: 10.1038/ncpgasthep0528 - DOI - PubMed
    1. Fink C, Karagiannides I, Bakirtzi K, Pothoulakis C. Adipose tissue and inflammatory bowel disease pathogenesis. Inflammation Bowel Dis (2012) 18(8):1550–7. doi: 10.1002/ibd.22893 - DOI - PMC - PubMed

Publication types