

A new sampling device for metabarcoding surveillance of port communities and detection of non-indigenous species
- PMID: 38111684
- PMCID: PMC10726295
- DOI: 10.1016/j.isci.2023.108588
A new sampling device for metabarcoding surveillance of port communities and detection of non-indigenous species
Abstract
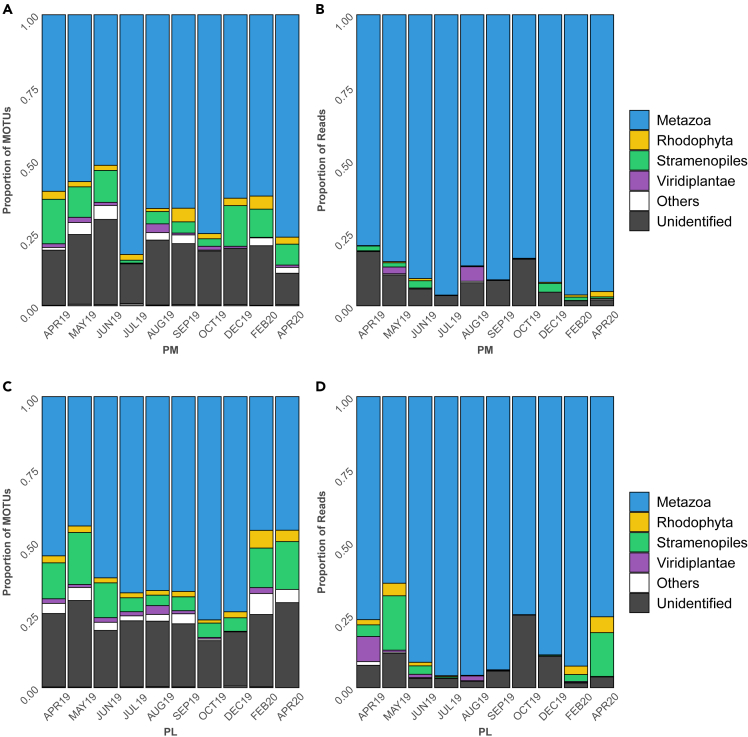
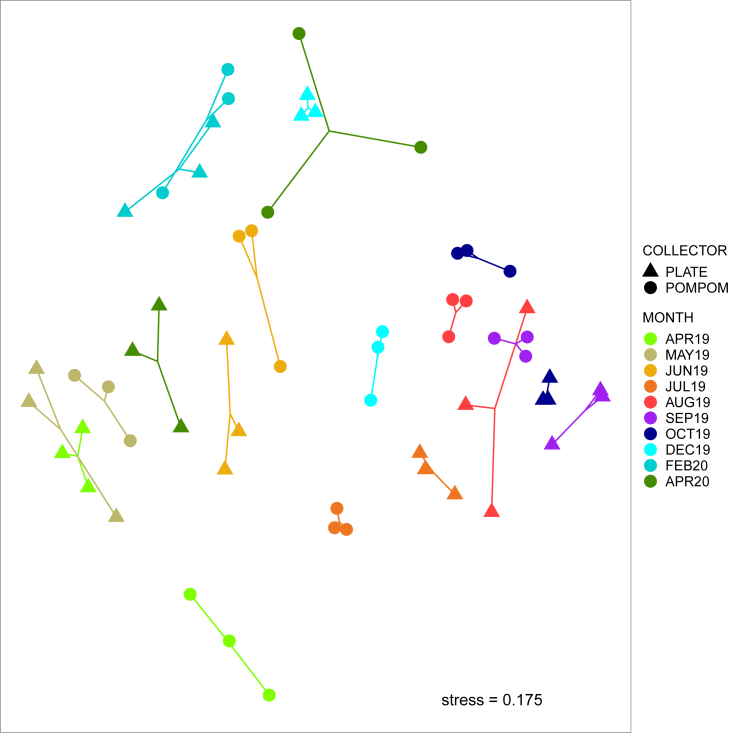
Metabarcoding techniques are revolutionizing studies of marine biodiversity. They can be used for monitoring non-indigenous species (NIS) in ports and harbors. However, they are often biased by inconsistent sampling methods and incomplete reference databases. Logistic constraints in ports prompt the development of simple, easy-to-deploy samplers. We tested a new device called polyamide mesh for ports organismal monitoring (POMPOM) with a high surface-to-volume ratio. POMPOMS were deployed inside a fishing and recreational port in the Mediterranean alongside conventional settlement plates. We also compiled a curated database with cytochrome oxidase (COI) sequences of Mediterranean NIS. COI metabarcoding of the communities settled in the POMPOMs captured a similar biodiversity than settlement plates, with shared molecular operational units (MOTUs) representing ca. 99% of reads. 38 NIS were detected in the port accounting for ca. 26% of reads. POMPOMs were easy to deploy and handle and provide an efficient method for NIS surveillance.
Keywords: Biological sciences; Ecology; Evolutionary biology.
© 2023 The Authors.
Conflict of interest statement
The authors declare no competing interests.
Figures


References
-
- Carlton J.T. Pattern, process, and prediction in marine invasion ecology. Biol. Conserv. 1996;78:97–106.
-
- Andrés J., Czechowski P., Grey E., Saebi M., Andres K., Brown C., Chawla N., Corbett J.J., Brys R., Cassey P., et al. Environment and shipping drive environmental DNA beta-diversity among commercial ports. Mol. Ecol. 2023;32:6696–6709. - PubMed
-
- Mineur F., Cook E., Minchin D., Bohn K., MacLeod A., Maggs C. Changing coasts: Marine aliens and artificial structures. Oceanogr. Mar. Biol. Annu. Rev. 2012;50:189–234.
-
- Bishop J.D.D., Wood C.A., Lévêque L., Yunnie A.L.E., Viard F. Repeated rapid assessment surveys reveal contrasting trends in occupancy of marinas by non-indigenous species on opposite sides of the western English Channel. Mar. Pollut. Bull. 2015;95:699–706. - PubMed
-
- Lacoursière-Roussel A., Bock D.G., Cristescu M.E., Guichard F., McKindsey C.W. Effect of shipping traffic on biofouling invasion success at population and community levels. Biol. Invasions. 2016;18:3681–3695.
LinkOut - more resources
Full Text Sources
