. 2024 May;253(5):519-541.
doi: 10.1002/dvdy.681. Epub 2023 Dec 19.

Identification of distinct vascular mural cell populations during zebrafish embryonic development

Affiliations

Identification of distinct vascular mural cell populations during zebrafish embryonic development

Sarah Colijn et al. Dev Dyn. 2024 May.

Abstract

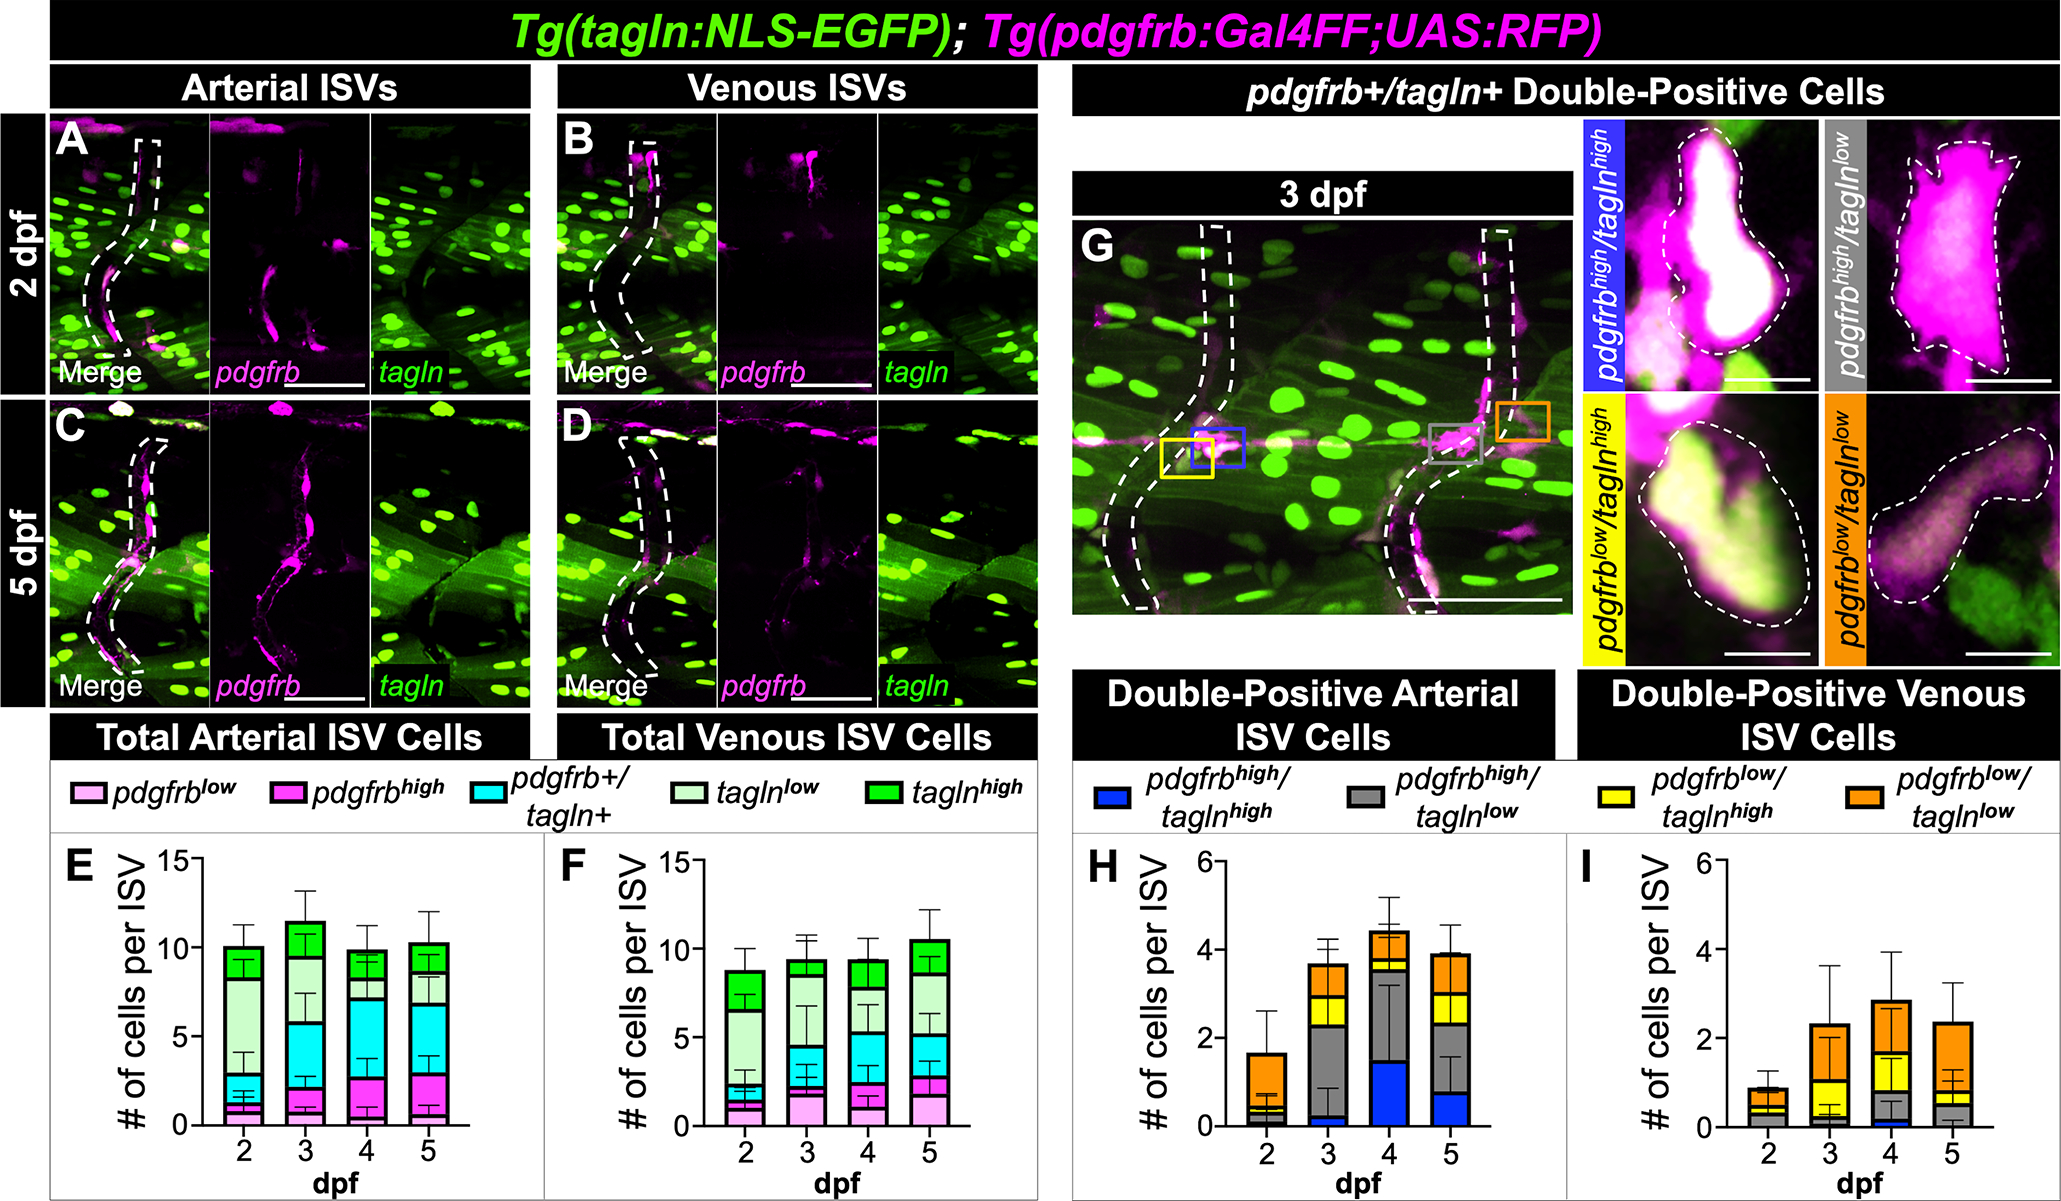
Background: Mural cells are an essential perivascular cell population that associate with blood vessels and contribute to vascular stabilization and tone. In the embryonic zebrafish vasculature, pdgfrb and tagln are commonly used as markers for identifying pericytes and vascular smooth muscle cells. However, the overlapping and distinct expression patterns of these markers in tandem have not been fully described.

Results: Here, we used the Tg(pdgfrb:Gal4FF; UAS:RFP) and Tg(tagln:NLS-EGFP) transgenic lines to identify single- and double-positive perivascular cell populations on the cranial, axial, and intersegmental vessels between 1 and 5 days postfertilization. From this comparative analysis, we discovered two novel regions of tagln-positive cell populations that have the potential to function as mural cell precursors. Specifically, we found that the hypochord-a reportedly transient structure-contributes to tagln-positive cells along the dorsal aorta. We also identified a unique mural cell progenitor population that resides along the midline between the neural tube and notochord and contributes to intersegmental vessel mural cell coverage.

Conclusion: Together, our findings highlight the variability and versatility of tracking both pdgfrb and tagln expression in mural cells of the developing zebrafish embryo and reveal unexpected embryonic cell populations that express pdgfrb and tagln.

Keywords: hypochord; mural cell progenitor; pericyte; perivascular cells; sclerotome; vSMC; zebrafish.


Conflict of interest statement

Competing Interests:

The authors declare that they have no conflicts of interest.

Figures

Figure 1.
Figure 1.. pdgfrb and tagln fluorescent transgenic reporter lines.
Lateral view confocal images of Tg(tagln:NLS-EGFP-2A-CFP-FTASE); TgBAC(pdgfrb:Gal4FF); Tg(5xUAS:RFP) triple transgenic zebrafish embryos from 1–5 dpf. tagln expression (green) becomes increasingly evident in the trunk skeletal muscle and the intestinal compartment over time. pdgfrb expression (magenta) is primarily visible in the anterior trunk and cranial regions. Scale bars: 500 μm.
Figure 2:
Figure 2:. Coronal imaging of Tg(tagln:NLS-EGFP); Tg(pdgfrb:Gal4FF; UAS:RFP) zebrafish brains with vascular-injected Evans Blue dye from 1 to 5 dpf.
Evans Blue dye was injected into the sinus venosus of zebrafish embryos at the indicated time point to label the vasculature, then the mid- and hindbrain region was imaged. (A) Schematic diagram illustrating the orientation for imaging brain coronal sections: lower middle region (yellow) and upper middle region (purple). (B-J) Maximum intensity projection images of pdgfrb and tagln in the mid- and hindbrain from 1 to 5 dpf. (B’-J’) Images include the Cy5 channel to visualize the vasculature (cyan). At 1 dpf (B) pdgfrb-positive cells are present throughout the brain parenchyma. At 2 dpf (C,D) pdgfrb-positive cells accumulate around the CoW—while still prevalent in the lower parenchyma (C)—and on the CtAs (D). pdgfrb-positive cells continue to accumulate on the CoW and CtAs from 3 to 5 dpf (E-J). Though tagln expression is sparse in the brain at these stages, infrequent pdgfrb/tagln double-positive cells are detectable starting around 4 dpf on the CtAs (though not present in these selected images). Schematic created with BioRender.com. The Fiji “subtract background” function was used for the Cy5 channel to clarify the vasculature. Images are representative of n=16 (1 dpf), n=10 (2 dpf), n=12 (3 dpf), n=12 (4 dpf), and n=10 (5 dpf) for a total of 60 embryos analyzed. AMCtA, anterior mesencephalic central artery. BA, basilar artery. CaDI, caudal division of the internal carotid artery. CCtA, cerebellar central artery. CoW, Circle of Willis. MMCtA, middle mesencephalic central artery. MtA, metencephalic artery. OpV, ophthalmic vein. PHBC, primordial hindbrain channel. PMCtA, posterior mesencephalic central artery. Scale bars: 50 μm.
Figure 3.
Figure 3.. pdgfrb expression is present in kdrl-positive cranial endothelial cells and predominantly does not overlap with sox10 expression during early brain development.
(A) Schematic diagram illustrating the orientation for imaging sagittal (yellow) and coronal (purple) sections of the mid- and hindbrain. (B-J) Single-plane images of blood vessels in the Tg(kdrl:mCherry-CAAX); Tg(pdgfrb:Gal4FF; UAS:EGFP) mid- and hindbrain at 1 and 2 dpf with pdgfrb-positive cells in magenta and endothelium (kdrl) in green. At 1 dpf (B-E), endothelial cells of the MCeV, PHBC, and PMBC are pdgfrb-positive (white arrows in coronal sections). At 2 dpf (F-J), fewer endothelial cells are pdgfrb-positive; however, expression is still detectable in the CtAs, PHBC, and PMBC (white arrows in coronal sections). Asterisks indicate the blood vessel lumen. (K,L) Single-plane images of cells positive for neural crest marker sox10 in the Tg(sox10:mRFP); Tg(pdgfrb:Gal4FF; UAS:EGFP) mid- and hindbrain at 1 dpf with pdgfrb in magenta and sox10 in green. The majority of pdgfrb-positive cells in the brain parenchyma are sox10-negative at 1 dpf, suggesting that these particular cells are not derived from the neural crest. The pdgfrb/sox10 double-positive structure in panel K is the facial placode. Schematic created with BioRender.com. Images are representative of n=7 (1 dpf; kdrl), n=9 (2 dpf; kdrl), and n=7 (1 dpf; sox10) for a total of 23 embryos analyzed. CtA, central artery. FP, facial placode. MCeV, middle cerebral vein. PHBC, primordial hindbrain channel. PMBC, primordial midbrain channel. Scale bars: 25 μm.
Figure 4:
Figure 4:. tagln and pdgfrb expression along the dorsal aorta and cardinal vein of the zebrafish from 1 to 5 dpf.
(A-E) Maximum intensity projection images of the DA and PCV in Tg(tagln:NLS-EGFP); Tg(pdgfrb:Gal4FF; UAS:RFP) zebrafish from 1 to 5 dpf. (A’-E’) The images from A-E without the brightfield overlay. (F-G) Quantitation of the number of single- and double-positive cells on the dorsal side of the DA (F), the ventral side of the DA (G), and the PCV (H). (I) Schematic diagram illustrating the imaged region. Schematic created with BioRender.com. Images and graphs are representative of n=6 (1 dpf), n=6 (2 dpf), n=6 (3 dpf), n=6 (4 dpf), and n=6 (5 dpf) for a total of 30 embryos analyzed. DA, dorsal aorta. HC, hypochord. NC, notochord. PCV, posterior cardinal vein. Scale bars: 50 μm. Scale bars in insets: 10 μm.
Figure 5.
Figure 5.. tagln single-positive cells on the dorsal side of the DA do not express the sclerotome marker twist1a.
Single-plane images of the DA in Tg(tagln:NLS-EGFP); Tg(Ola.Twist:GAL4; UAS:RFP) zebrafish at 2 dpf (A,D) and 4 dpf (B,E). (A-C) Sagittal view. tagln-positive nuclei derived from the hypochord are apparent at 2 dpf and do not express twist1a at the 2 or 4 dpf timepoints (solid white arrows), unlike vSMCs on the ventral side of the DA that do express twist1a (open arrows). The weak twist1a signal that is visible on the dorsal side of the DA in these images is from the cells sitting adjacent to the tagln-positive hypochord population. These cells can be seen from coronal views. (D-F) Coronal view. tagln single-positive nuclei of the hypochord on the dorsal side of the DA are twist1a-negative at both 2 and 4 dpf (solid white arrows), with twist1a-positive cells adjacent to the DA in this region. These data suggest that the tagln-single positive hypochord cells on the dorsal side of the DA are not replaced by sclerotome-derived vSMCs after 2 dpf when the hypochord has been previously reported to disappear. (C,F) Schematic diagrams illustrating the orientation for imaging sagittal (C) or coronal (F) sections of the DA. Schematics created with BioRender.com. Images are representative of n=6 (2 dpf) and n=6 (4 dpf) for a total of 12 embryos analyzed. DA, Dorsal Aorta. Scale bars: 50 μm.
Figure 6:
Figure 6:. tagln and pdgfrb expression along the caudal artery and vein of zebrafish from 1 to 5 dpf.
(A-E) Maximum intensity projection images of the CA and CV in Tg(tagln:NLS-EGFP); Tg(pdgfrb:Gal4FF; UAS:RFP) zebrafish from 1 to 5 dpf. (A’-E’) The images from A-E without the brightfield overlay. (F-G) Quantitation of the number of single- and double-positive cells on the dorsal side of the CA (F), the ventral side of the CA (G), and the CV (H). (I) Schematic diagram illustrating the imaged region. Schematic created with BioRender.com. Images and graphs are representative of n=5 (1 dpf), n=6 (2 dpf), n=6 (3 dpf), n=6 (4 dpf), and n=6 (5 dpf) for a total of 29 embryos analyzed. CA, caudal artery. CV, caudal vein. HC, hypochord. NC, notochord. Scale bars: 50 μm. Scale bars in insets: 10 μm.
Figure 7:
Figure 7:. Summary of mural cell accumulation on the axial vasculature.
The hypochord—which begins as a pdgfrb/tagln double-positive structure—is a novel source of tagln-positive cells on the dorsal side of the dorsal aorta and caudal artery. At 2 dpf, the hypochord cells start to elongate above the dorsal aorta. At 3 dpf, the pdgfrb/tagln double-positive cells start to decrease pdgfrb expression. By 4 dpf, these cells are predominantly tagln single-positive. In the region of the caudal artery, this hypochord reprogramming event begins 1 day later than the anterior region. On the ventral side of the dorsal aorta and caudal vein, pdgfrb single-positive vSMCs were observed beginning at 2 dpf, then expanded in number and increased expression of tagln over time. By 5 dpf, pdgfrb/tagln double-positive cells accounted for approximately 60% of ventral vSMCs on the dorsal aorta, and no tagln single-positive cells were detected. The vSMCs on the ventral side of the caudal artery accumulated more slowly and did not begin co-expressing tagln until 5 dpf, which amounted to a 2-day delay compared to the anterior region. Finally, we observed a slow accumulation of pdgfrb single-positive cells on the posterior cardinal vein and caudal vein between 1 to 5 dpf. tagln-positive cells were sparse on the veins but visible at later stages on the posterior cardinal vein.
Figure 8.
Figure 8.. Low tagln expression is evident in aortic endothelial cells and a subset of perivascular cells on the ISVs, while pdgfrb is present in a portion of venous endothelial cells.
(A-D) Single-plane images of Tg(tagln:NLS-EGFP); Tg(kdrl:mCherry-CAAX) zebrafish at 1 dpf (A,B) and 3 dpf (C,D) where kdrl is used to mark endothelial cells (magenta). (A-C) Low tagln expression is seen in endothelial cells of the aorta and ISVs (white arrows). High (C) and low (D) tagln expression is also visible in perivascular cells on the ISVs (yellow arrows). (E,F) Single-plane images of Tg(pdgfrb:Gal4FF;UAS:EGFP); Tg(kdrl:mCherry-CAAX) zebrafish at 1 dpf with endothelium (kdrl) in green. pdgfrb expression is seen in a portion of endothelial cells of the posterior cardinal vein (white arrows). Images are representative of n=4 (1 dpf; tagln), n=3 (3 dpf; tagln), and n=7 (1 dpf; pdgfrb) for a total of 14 embryos analyzed. ISVs, intersegmental vessels. Scale bars: 10 μm.
Figure 9.
Figure 9.. Low and high pdgfrb/tagln expression is evident along arterial and venous ISVs from 2 to 5 dpf.
(A-D) Maximum intensity projection images of Tg(tagln:NLS-EGFP); Tg(pdgfrb:Gal4FF; UAS:RFP) arterial and venous ISVs at 2 (A,B) and 5 dpf (C,D). tagln-positive skeletal muscle nuclei are particularly evident in the trunk region near the ISVs, thus requiring frame-by-frame analysis to identify tagln-positive perivascular cells. (E,F) Quantitation of the number of low and high single- and double-positive cells on the arterial (E) and venous (F) ISVs. Arterial ISVs accumulate pdgfrb-high mural cells more robustly than venous ISVs. (G) Representative image of the combinations of pdgfrb/tagln double-positive cells, with insets for enlarged views. Inset panels are rotated for ease of viewing. (H,I) Quantitation of the number double-positive cells on the arterial (H) and venous (I) ISVs. pdgfrb/tagln double-positive cells were more apparent on arterial ISVs. tagln-positive ISV endothelial cells and tagln-low perivascular cells were difficult to distinguish, thus a small number of endothelial cells may be included in the count of tagln-low cells of the ISVs. “Low” versus “high” expression was determined subjectively by comparison of fluorescence intensity to skeletal muscle nuclei intensity. Intensities that were comparable to skeletal muscle were labeled as “high” whereas lower intensities were labeled as “low”. Images and graphs are representative of n=6 (2 dpf), n=6 (3 dpf), n=8 (4 dpf), and n=8 (5 dpf) for a total of 28 embryos analyzed. ISVs are outlined by white dotted lines and their position identified from brightfield images. ISVs, intersegmental vessels. Scale bars for A-D,G: 50 μm; scale bars for G insets: 5 μm.
Figure 10.
Figure 10.. twist1a-positive cells with low tagln expression are predicted to arise from the ventral sclerotome compartment.
(A) Maximum intensity projection image of the ISV region of a Tg(tagln:NLS-EGFP); Tg(Ola.Twist:GAL4; UAS:RFP) zebrafish at 2 dpf. The ISV is outlined with a white dotted line and its position identified from brightfield images. (B-E) Discrete regions of panel A are max projected for better visualization of twist1a-positive cells near the neural tube (B,C), notochord-neural tube interface (D), and notochord (E). The majority of twist1a-positive cells near the neural tube are tagln-negative (B,C; indicated by stars), while all twist1a-positive cells at the notochord-neural tube interface and below are tagln-positive (D,E). Due to the ventral localization of tagln/twist1a double-positive cells, we predict that these cells arise from the ventral sclerotome, with twist1a-single positive cells near the neural tube arising from the dorsal sclerotome. The tagln-positive/twist1a-negative vascular cell in panel E is likely endothelium (white arrow). Images are representative of n=6 embryos (2 dpf). ISVs, intersegmental vessels. Scale bars: 10 μm.
Figure 11.
Figure 11.. Summary of mural cell accumulation along ISVs.
Schematic diagram summarizing the general localization of perivascular cells on the ISVs at 2 and 5 dpf. pdgfrb single-positive cells were more likely to be found on the dorsal ISV region (dorsal to the mid-line of the zebrafish), tagln single-positive cells were found primarily near the notochord ISV region, and double-positive cells were found nearest to the notochord-neural tube interface by 5 dpf. Schematic created with BioRender.com. ISVs, intersegmental vessels.
Figure 12.
Figure 12.. A tagln/twist1a double-positive mural cell progenitor population at the notochord-neural tube interface upregulates pdgfrb and contacts the ISVs.
(A-J) Maximum intensity projection images of cell populations near the notochord-neural tube interface in Tg(tagln:NLS-EGFP); Tg(pdgfrb:Gal4FF; UAS:RFP) zebrafish. Sagittal (A,C,E,G,I) and orthogonal (B,D,F,H,J) views of the medial floor plate (MFP) from 1–5 dpf reveal pdgfrb/tagln co-expression (cyan arrows). A separate tagln single-positive population of cells accumulates immediately below the MFP starting at 3 dpf (E-J, open arrows). Finally, an independent tagln single-positive population—hereafter called the mural cell progenitor population—aligns near the notochord-neural tube interface (A’-I’,B,D,F,H,J, yellow arrows) and begins to elongate and upregulate pdgfrb over time. (K) Schematic diagram illustrating the three described cell populations from a sagittal and orthogonal view. (L-O) Maximum intensity projection images of Tg(tagln:NLS-EGFP); Tg(Ola.Twist:GAL4; UAS:RFP) zebrafish showing that the tagln-positive midline cells (open arrows, 4 dpf) and mural cell progenitors (yellow arrows) are twist1a-positive, suggesting that they are derived from the sclerotome unlike the cells of the medial floor plate (magenta arrows). (P-S) Cells from the mural cell progenitor population can be seen extending and making contact with ISVs (white arrows) using both pdgfrb and tagln as markers (P,Q) or twist1a and tagln (R,S). ISVs are outlined and were identified from brightfield images. Schematic created with BioRender.com. Images are representative of n=12 (1 dpf; pdgfrb), n=6 (2 dpf; pdgfrb), n=6 (3 dpf; pdgfrb), n=12 (4 dpf; pdgfrb), n=10 (5 dpf; pdgfrb), n=6 (2 dpf; twist1a), and n=6 (4 dpf; twist1a) for a total of 58 embryos analyzed. ISV, intersegmental vessel. MC, mural cell. MFP, medial floor plate. NC, notochord. NT, neural tube. Scale bars: 10 μm.
Figure 13.
Figure 13.. The mural cell progenitor population resides between the notochord and neural tube, is sox10-negative, and does not need to contact endothelium to upregulate pdgfrb.
(A,B) Single-plane images of Tg(−2.4shha-ABC:GFP); Tg(pdgfrb:Gal4FF; UAS:RFP) zebrafish to visualize the medial floor plate cells (shha, green) and the MC progenitor population (pdgfrb, magenta) at 5 dpf. The sagittal (A) and orthogonal (B) views show the MC progenitors outside of the neural tube. (B’) Schematic detailing the structures in panel B. (C-E) Single-plane images of Tg(tagln:NLS-EGFP); Tg(col9a2:mCherry) zebrafish to visualize the notochord sheath cells (col9a2, magenta) and the MC progenitor population (tagln, green) at 3 dpf. The sagittal (C) and orthogonal (D) views show the MC progenitors outside of the notochord. (D’) Schematic detailing the structures in panel D. (E,E’) Notochord sheath cells (white arrows) express low levels of tagln. (F,G) Single-plane images of Tg(tagln:NLS-EGFP); Tg(sox10:mRFP) zebrafish to visualize the neural crest marker sox10 (magenta) and the MC progenitor population (tagln, green) at 2 dpf (F) and 5 dpf (G). MC progenitor cells do not express sox10 at early developmental stages, suggesting that they do not arise from neural crest populations. (H) Maximum intensity projection image of Tg(tagln:NLS-EGFP); Tg(kdrl:mCherry-CAAX) zebrafish to visualize endothelial cells (kdrl, magenta) and the MC progenitor population (tagln, green) at 3 dpf. The MC progenitor population (outlined with a white dotted line) is not adjacent or parallel to a blood vessel. (H’) Single-plane image showing the MC progenitor population from panel H without the skeletal muscle. (I,J) Maximum intensity projection images of Tg(tagln:NLS-EGFP); Tg(pdgfrb:Gal4FF; UAS:RFP) zebrafish at 2 dpf (I) and 3 dpf (J). ISVs are outlined with white dotted lines and were identified from brightfield images. MC progenitor cells upregulate pdgfrb expression (magenta, yellow arrows) without contact with the endothelium. Images are representative of n=4 (5 dpf; shha), n=6 (3 dpf; col9a2), n=6 (2 dpf; sox10), n=6 (5 dpf; sox10), n=3 (3 dpf; kdrl), n=6 (2 dpf; tagln/pdgfrb), and n=6 (3 dpf; tagln/pdgfrb) for a total of 37 embryos analyzed. MC, mural cell. MFP, medial floor plate. Scale bars: 50 μm unless otherwise indicated.
Figure 14:
Figure 14:. Summary of the midline cell populations at the notochord-neural tube interface.
We identify medial floor plate cells as pdgfrb/tagln double-positive in early zebrafish development (MFP). Additionally, we observe a tagln single-positive population of cells along the midline that accumulates below the medial floor plate cells beginning at 3 dpf (tagln+ Midline Cells). Finally, we describe a mural cell progenitor population near the notochord-neural tube interface that borders either side of the midline. This population—which begins as tagln single-positive cells before acquiring pdgfrb expression—can be observed migrating to the nearby ISVs (MC Progenitor Population). Schematic created with BioRender.com. ISV, intersegmental vessel. MC, mural cell. MFP, medial floor plate. NC, notochord. NT, neural tube.
Figure 15.
Figure 15.. Visualizing tagln expression using an independent cytosolic-GFP tagln reporter line.
Confocal images of Tg(tagln:eGFP); Tg(pdgfrb:Gal4FF; UAS:RFP) zebrafish at 2 dpf (A-D) and 4 dpf (E-H). tagln expression was evident in the hypochord and vSMC populations of the dorsal aorta (A,E). GFP expression in the skeletal muscle decreases the resolution of tagln-positive cells in the trunk, though we were able to visualize tagln-high mural cells on the ISVs by 4 dpf (B,F). Despite high background, GFP signal was also detectable in the MC progenitor population and the medial floor plate cells (C,D,G,H). We observed intense GFP expression in the tagln-positive midline cells by 4 dpf (H). Thus, we are able to confirm tagln expression in these structures using an independent transgenic line, the cytosolic-GFP tagln reporter. Images are representative of n=4 (2 dpf) and n=4 (4 dpf) for a total of 8 embryos analyzed. ISVs, intersegmental vessels. MC, mural cell. Scale bars: 50 μm.

Update of

Similar articles

Cited by

References

    1. Armulik A, Abramsson A, Betsholtz C. Endothelial/Pericyte Interactions. Circulation Research. 2005;97(6):512–523. 10.1161/01.RES.0000182903.16652.d7. - DOI - PubMed
    1. Donadon M, Santoro MM. The origin and mechanisms of smooth muscle cell development in vertebrates. Development. 2021;148(7). 10.1242/dev.197384. - DOI - PubMed
    1. Owens GK, Kumar MS, Wamhoff BR. Molecular Regulation of Vascular Smooth Muscle Cell Differentiation in Development and Disease. Physiological Reviews. 2004;84(3):767–801. 10.1152/physrev.00041.2003. - DOI - PubMed
    1. Holm A, Heumann T, Augustin HG. Microvascular Mural Cell Organotypic Heterogeneity and Functional Plasticity. Trends in Cell Biology. 2018;28(4):302–316. 10.1016/j.tcb.2017.12.002. - DOI - PubMed
    1. Stratman AN, Pezoa SA, Farrelly OM, et al. Interactions between mural cells and endothelial cells stabilize the developing zebrafish dorsal aorta. Development. 2017;144(1):115–127. 10.1242/dev.143131. - DOI - PMC - PubMed

Publication types

MeSH terms

Substances

LinkOut - more resources