. 2024 Jan;598(2):252-265.
doi: 10.1002/1873-3468.14786. Epub 2023 Dec 27.

The mitotic checkpoint kinase BUB1 is a direct and actionable target of MYB in adenoid cystic carcinoma

Affiliations

The mitotic checkpoint kinase BUB1 is a direct and actionable target of MYB in adenoid cystic carcinoma

Ylenia Cicirò et al. FEBS Lett. 2024 Jan.

Abstract

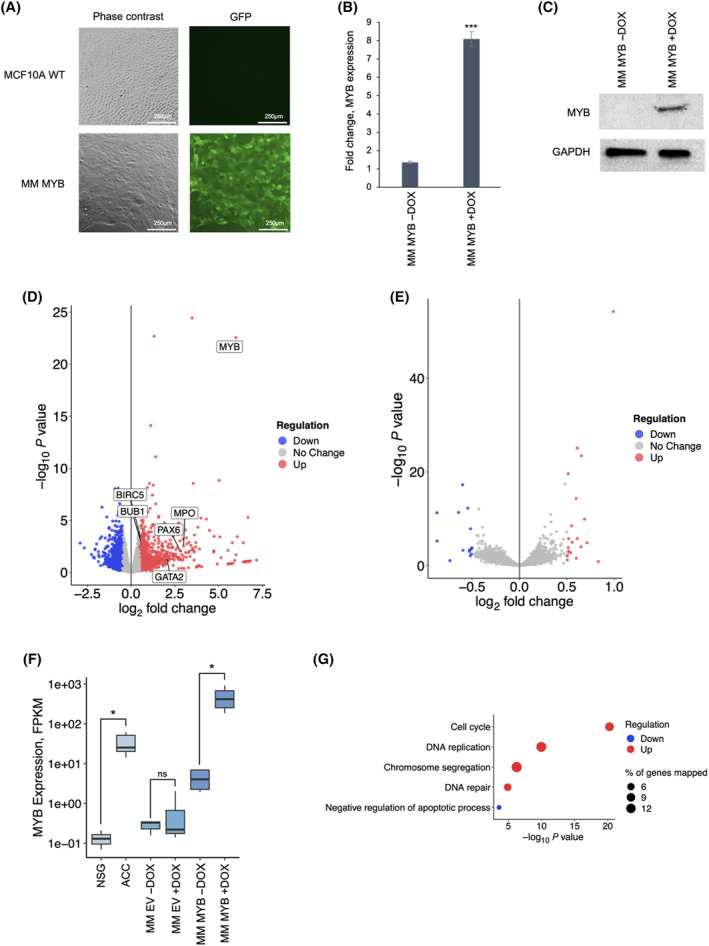
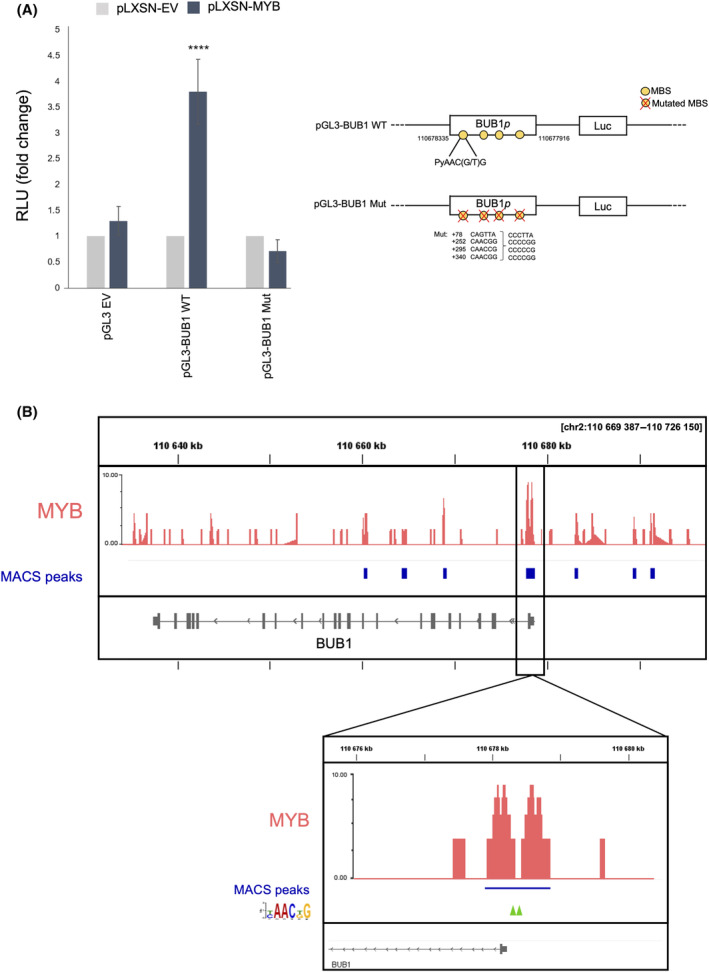
Adenoid cystic carcinoma (ACC) is a head and neck cancer that frequently originates in salivary glands, but can also strike other exocrine glands such as the breast. A key molecular alteration found in the majority of ACC cases is MYB gene rearrangements, leading to activation of the oncogenic transcription factor MYB. In this study, we used immortalised breast epithelial cells and an inducible MYB transgene as a model of ACC. Molecular profiling confirmed that MYB-driven gene expression causes a transition into an ACC-like state. Using this new cell model, we identified BUB1 as a targetable kinase directly controlled by MYB, whose pharmacological inhibition caused MYB-dependent synthetic lethality, growth arrest and apoptosis of patient-derived cells and organoids.

Keywords: 3D assay; BAY1816032; ChIP sequencing; PDX; head and neck cancer.


Figures

Fig. 1
Fig. 1
Generation of a new model of ACC based on MCF10A cells conditionally expressing MYB. (A) Fluorescence microscopy analysis of MCF10A cells transduced or non transduced with the lentiviral vector expressing MYB and GFP. Magnification used was 40×. (B) RT‐qPCR analysis showing MYB expression changes between −DOX and +DOX conditions. MYB expression was normalised to that of GAPDH. (C) Immunoblotting analysis demonstrating MYB protein expression in MM MYB in the presence of the inducer DOX. GAPDH protein levels were used as loading control. (D) Volcano plot depicting differentially expressed genes identified in the RNA‐seq analysis of MM MYB cells. Genes significantly up‐ or down‐regulated in MM MYB cells in the presence of DOX are indicated by the red or blue colour, respectively; known targets of MYB are highlighted. (E) Volcano plot depicting differentially expressed genes identified in the RNA‐seq analysis of MM EV cells. No significant changes in global gene expression are detected in control vector‐infected cells in the presence of DOX. (F) RNA‐seq analysis to detect expression of MYB in ACC cells (ACCX11, n = 7), NSG control (n = 3), MM EV (n = 3), and MM MYB (n = 3) cells cultured in the presence or absence of DOX. Expression is reported as fragments per kilo base of transcript per million mapped fragments (FPKM). (G) Bubble plot showing the GO terms of biological processes activated in MM cells after MYB activation, according to Panther:BP database. Results were filtered by P value ≤ 0.05 and adjusted by FDR ≤ 0.1. Different colours are used to distinguish biological processes. The size of the dots indicates the % of genes mapped for each biological process. Statistically significance was calculated using t‐test; P value ≤ 0.05 (*), 0.001 (**), 0.0001 (***), and 0.00001 (****); ns, not significant.
Fig. 2
Fig. 2
Genes differentially expressed in ACC versus NSG in publicly available datasets. (A) Volcano plots visualising differentially expressed genes (upregulated in red, and downregulated genes in blue) in the Andersson, Chowbina, Cicirò, and Gao datasets. (B) Bubble plot showing the GO terms of the top 5 biological processes representative of the up‐ (in red) or down‐(in blue)regulated genes in ACC versus NSG. Results were filtered by P value ≤ 0.05 and adjusted by FDR ≤ 0.1. The size of the dots indicates the % of genes mapped for each biological process. (C) Venn diagrams showing shared processes in the Andersson, Chowbina, Cicirò, and Gao datasets. “Up” indicates the differentially upregulated genes of each dataset, “Down” the differentially downregulated genes.
Fig. 3
Fig. 3
Generation of an ACC signature. (A) Venn diagram showing the intersection of the upregulated genes extrapolated from Andersson, Chowbina, Cicirò, and Gao datasets. (B) GSEA enrichment analysis of the 156 gene signature against RNA sequencing of MM MYB with (+) or without (−) DOX. (C) The top 50 core enriched genes (leading edge) extracted from GSEA recapitulated in the MM MYB + DOX model. The black arrows indicate MYB and BUB1 genes.
Fig. 4
Fig. 4
BUB1 is a downstream target of MYB. (A) Boxplot quantifying BUB1 expression in ACCX11 cells (n = 7), NSG (n = 3) and MM MYB (n = 3) and MM EV (n = 3) with or without DOX. (B) BUB1 expression was quantified by RT‐qPCR in naïve MCF10A cells or MM MYB cells in the presence or absence of DOX. (C) Violin plot showing BUB1 expression in the combined Andersson, Chowbina, Cicirò, and Gao datasets compared to NSG controls. Expression is quantified using log2 RMA (Robust Multi‐Array Average). (D) MYB and BUB1 expression was extrapolated from publicly available datasets (Andersson, Chowbina, Cicirò, and Gao) and the statistical relationship between the two variables was calculated. The grey area represents the correlation confidence interval (CI). R indicates the Pearson correlation coefficient. (E) Bar plot showing the expression fold changes measured by microarray of MYB and BUB1 genes in ACC cells treated with two independent siRNAs targeting MYB‐NFIB. The data was extrapolated from Andersson et al. [14]. (F) Expression levels of MYB and BUB1 in ACCX11 cells exposed to MYB siRNAs. Bars indicate mean values plus or minus standard errors. Statistical significance was calculated using t‐test; P value ≤ 0.05 (*), 0.001 (**) and 0.00001 (****).
Fig. 5
Fig. 5
MYB transactivates the BUB1 promoter via canonical MYB binding sequences. (A) Luciferase assay. The bar plot indicates the RLU (Relative Light Unit) values corrected for transfection efficiency with Renilla luciferase. pGL3 empty vector (pGL3 EV) was used to calculate background luciferase activity. A schematic representation of the constructs, the putative consensus MBSs (G/TAACNG) and the mutations introduced are shown on the right of the panel. Error bars indicate standard deviations. (B) Localisation of MYB peaks (depicted in red) detected by ChIP‐seq. The blue boxes under each peak indicate regions significantly enriched by the MYB binding as defined by the peak caller output of P < 0.01, calculated with the Model‐based Analysis of ChIP‐Seq (MACS) algorithm. MYB‐binding peaks around the transcription start site (TSS) of BUB1 are highlighted in the zoomed box. The green arrows indicate the position of MYB canonical binding sites.
Fig. 6
Fig. 6
A BUB1 inhibitor impairs growth of glandular cells in MYB‐dependent manner and causes apoptosis of ACC patient‐derived cell lines. (A) Growth assay. MM MYB cells were treated with escalating doses of BAY1816032 (or vehicle DMSO) for 72 h in the presence or absence of the MYB inducer DOX. Growth of DMSO‐treated cells was considered 100%. (B) Growth assay was performed as in A except that the MM EV control cell line was used. (C) Viability assay. ACCX11 cells were exposed to escalating concentrations of BAY1816032 for 72 h. MCF10A were used as normal cell control. (D) Apoptosis assay. Caspase 3/7 activity was measured in ACCX11 cells treated for 48 h with BAY1816032. DMSO was used as treatment control. (E) Viability of ACCX6, ACCX11, and ACCX5M1 patient‐derived tumour spheroids cultured in 3D was measured after exposure to increasing concentrations of BAY1816032 for 96 h. The table indicates the IC50 obtained for each cell line. Error bars indicate standard errors. P value ≤ 0.05 (*), 0.001 (**), 0.0001 (***), and 0.00001 (****) (n = 6 technical replicates).

References

    1. Dillon PM, Chakraborty S, Moskaluk CA, Joshi PJ and Thomas CY (2016) Adenoid cystic carcinoma: a review of recent advances, molecular targets, and clinical trials. Head Neck 38, 620–627. - PMC - PubMed
    1. Ellington CL, Goodman M, Kono SA, Grist W, Wadsworth T, Chen AY, Owonikoko T, Ramalingam S, Shin DM, Khuri FR et al. (2012) Adenoid cystic carcinoma of the head and neck: incidence and survival trends based on 1973–2007 surveillance, epidemiology, and end results data. Cancer 118, 4444–4451. - PubMed
    1. Moskaluk CA (2013) Adenoid cystic carcinoma: clinical and molecular features. Head Neck Pathol 7, 17–22. - PMC - PubMed
    1. Ferrarotto R, Heymach JV and Glisson BS (2016) MYB‐fusions and other potential actionable targets in adenoid cystic carcinoma. Curr Opin Oncol 28, 195–200. - PubMed
    1. Parikh AS, Wizel A, Davis D, Lefranc‐Torres A, Rodarte‐Rascon AI, Miller LE, Emerick KS, Varvares MA, Deschler DG, Faquin WC et al. (2022) Single‐cell RNA sequencing identifies a paracrine interaction that may drive oncogenic notch signaling in human adenoid cystic carcinoma. Cell Rep 41, 111743. - PMC - PubMed

Publication types

MeSH terms

Substances

LinkOut - more resources