

Investigating the ID3/SLC22A4 as immune-related signatures in ischemic stroke
- PMID: 38112574
- PMCID: PMC10781493
- DOI: 10.18632/aging.205308
Investigating the ID3/SLC22A4 as immune-related signatures in ischemic stroke
Abstract
Background: Ischemic stroke (IS) is a fearful disease that can cause a variety of immune events. Nevertheless, precise immune-related mechanisms have yet to be systematically elucidated. This study aimed to identify immune-related signatures using machine learning and to validate them with animal experiments and single cell analysis.
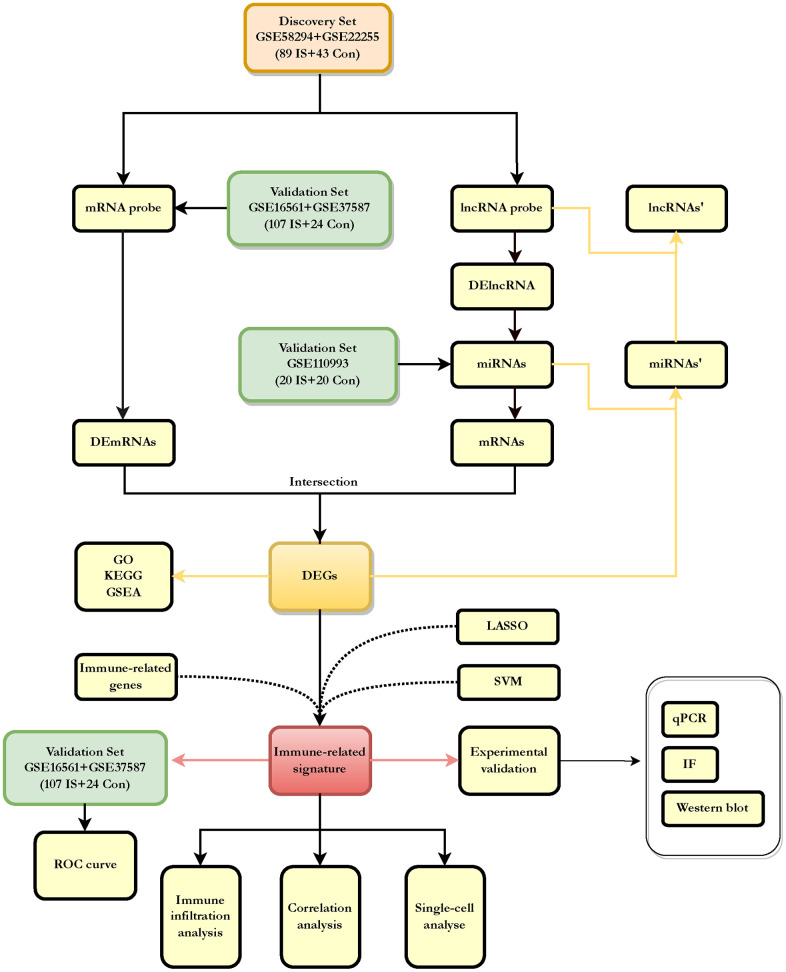
Methods: In this study, we screened 24 differentially expressed genes (DEGs) while identifying immune-related signatures that may play a key role in IS development through a comprehensive strategy between least absolute shrinkage and selection operation (LASSO) regression, support vector machine (SVM) and immune-related genes. In addition, we explored immune infiltration using the CIBERSORT algorithm. Finally, we performed validation in mouse brain tissue and single cell analysis.
Results: We identified 24 DEGs for follow-up analysis. ID3 and SLC22A4 were finally identified as the better immune-related signatures through a comprehensive strategy among DEGs, LASSO, SVM and immune-related genes. RT-qPCR, western blot, and immunofluorescence revealed a significant decrease in ID3 and a significant increase in SLC22A4 in the middle cerebral artery occlusion group. Single cell analysis revealed that ID3 was mainly concentrated in endothelial_2 cells and SLC22A4 in astrocytes in the MCAO group. A CIBERSORT finds significantly altered levels of immune infiltration in IS patients.
Conclusions: This study focused on immune-related signatures after stroke and ID3 and SLC22A4 may be new therapeutic targets to promote functional recovery after stroke. Furthermore, the association of ID3 and SLC22A4 with immune cells may be a new direction for post-stroke immunotherapy.
Keywords: ID3; SLC22A4; bioinformation; immune; ischemic stroke.
Conflict of interest statement
Figures


Similar articles
-
Identification of immune-related key genes in the peripheral blood of ischaemic stroke patients using a weighted gene coexpression network analysis and machine learning.J Transl Med. 2022 Aug 12;20(1):361. doi: 10.1186/s12967-022-03562-w. J Transl Med. 2022. PMID: 35962388 Free PMC article.
-
Discovery and validation of molecular patterns and immune characteristics in the peripheral blood of ischemic stroke patients.PeerJ. 2024 Apr 19;12:e17208. doi: 10.7717/peerj.17208. eCollection 2024. PeerJ. 2024. PMID: 38650649 Free PMC article.
-
Investigating the AC079305/DUSP1 Axis as Oxidative Stress-Related Signatures and Immune Infiltration Characteristics in Ischemic Stroke.Oxid Med Cell Longev. 2022 Jun 14;2022:8432352. doi: 10.1155/2022/8432352. eCollection 2022. Oxid Med Cell Longev. 2022. PMID: 35746962 Free PMC article.
-
Identification of novel biomarkers and immune infiltration characteristics of ischemic stroke based on comprehensive bioinformatic analysis and machine learning.Biochem Biophys Rep. 2023 Dec 7;37:101595. doi: 10.1016/j.bbrep.2023.101595. eCollection 2024 Mar. Biochem Biophys Rep. 2023. PMID: 38371524 Free PMC article.
-
SLC22A4 and RUNX1: identification of RA susceptible genes.J Mol Med (Berl). 2004 Sep;82(9):558-64. doi: 10.1007/s00109-004-0547-y. Epub 2004 Jun 4. J Mol Med (Berl). 2004. PMID: 15184985 Review.
Cited by
-
The impact of inflammation and iron metabolism on gene expression alterations in ischemic stroke: a bioinformatics approach.Sci Rep. 2025 Apr 30;15(1):15233. doi: 10.1038/s41598-025-00369-9. Sci Rep. 2025. PMID: 40307317 Free PMC article.
-
ID3 enhances PD-L1 expression by restructuring MYC to promote colorectal cancer immune evasion.Proc Natl Acad Sci U S A. 2025 Apr 15;122(15):e2423490122. doi: 10.1073/pnas.2423490122. Epub 2025 Apr 10. Proc Natl Acad Sci U S A. 2025. PMID: 40208940
References
Publication types
MeSH terms
Substances
LinkOut - more resources
Full Text Sources
Medical
Molecular Biology Databases
