. 2024 Feb 7;14(2):jkad288.
doi: 10.1093/g3journal/jkad288.

The chromosome-scale genome and the genetic resistance machinery against insect herbivores of the Mexican toloache, Datura stramonium

Affiliations

The chromosome-scale genome and the genetic resistance machinery against insect herbivores of the Mexican toloache, Datura stramonium

Ivan M De-la-Cruz et al. G3 (Bethesda). .

Abstract

Plant resistance refers to the heritable ability of plants to reduce damage caused by natural enemies, such as herbivores and pathogens, either through constitutive or induced traits like chemical compounds or trichomes. However, the genetic architecture-the number and genome location of genes that affect plant defense and the magnitude of their effects-of plant resistance to arthropod herbivores in natural populations remains poorly understood. In this study, we aimed to unveil the genetic architecture of plant resistance to insect herbivores in the annual herb Datura stramonium (Solanaceae) through quantitative trait loci mapping. We achieved this by assembling the species' genome and constructing a linkage map using an F2 progeny transplanted into natural habitats. Furthermore, we conducted differential gene expression analysis between undamaged and damaged plants caused by the primary folivore, Lema daturaphila larvae. Our genome assembly resulted in 6,109 scaffolds distributed across 12 haploid chromosomes. A single quantitative trait loci region on chromosome 3 was associated with plant resistance, spanning 0 to 5.17 cM. The explained variance by the quantitative trait loci was 8.44%. Our findings imply that the resistance mechanisms of D. stramonium are shaped by the complex interplay of multiple genes with minor effects. Protein-protein interaction networks involving genes within the quantitative trait loci region and overexpressed genes uncovered the key role of receptor-like cytoplasmic kinases in signaling and regulating tropane alkaloids and terpenoids, which serve as powerful chemical defenses against D. stramonium herbivores. The data generated in our study constitute important resources for delving into the evolution and ecology of secondary compounds mediating plant-insect interactions.

Keywords: Plant Genetics and Genomics; Solanaceae; genomics of plant defense; herbivory; plant resistance; quantitative trait loci (QTLs) of plant resistance.


Conflict of interest statement

Conflicts of interest The authors declare no conflicts of interest.

Figures

Fig. 1.
Fig. 1.
a) Datura stramonium is part of the Solanaceae family, and Mexico is considered its center of origin. This species grows in ruderal and urban areas and nowadays is distributed worldwide. In Mexico, it is attacked mainly by 3 main herbivores: the beetles L. daturaphila (folivore), T. soror (seed predator), and E. parvula (folivore). It is well known due to its production of tropane alkaloids which are used in traditional medicine and pharmaceutical industry. b) Linkage density histogram of the Omni-C sequences. In this figure, the x- and y-axes give the mapping positions of the first and second reads in the read pair, respectively, grouped into bins. The color of each square gives the number of read pairs within that bin. White vertical and black horizontal lines have been added to show the borders between scaffolds. Scaffolds less than 1 Mb were excluded. c) Cumulative length plot displaying the growth of contig lengths for the draft (blue line) and improved (red lines) genome of D. stramonium. On the x-axis, contigs are ordered from the largest to smallest. The y-axis gives the size of the x largest contigs in the assembly. d) BUSCO plots for the improved D. stramonium genome. The plot shows quantitative measures for the assessment of the genome completeness based on evolutionarily informed expectations of gene content from near-universal single-copy orthologs selected from the “Solanaceae odb10*” database. Credit for Fig. 1a to Juan Núñez-Farfán. See Table 1.
Fig. 2.
Fig. 2.
Density linkage map of D. stramonium (a) showing the density and position of the markers (SNPs) across the 12 chromosomes (LGs). The first chromosome contains the highest number of markers (n = 6,006). b) QTL analysis for plant resistance of D. stramonium, revealing a single significant QTL at chromosome 3 (LOD score = 3.9). c) Permutation test (1,000 iterations) for the QTL analysis, revealing a cutoff LOD score of 3.9 for plant resistance. d) Close-up for the highest LOD score for plant resistance at chromosome 3, position 3.9 cM. Red and blue lines depict the P-value threshold (0.05 and 0.07, respectively). The Bayes interval of the QTL region ranges from 0 to 5.176 cM.
Fig. 3.
Fig. 3.
a) Distribution of markers across the QTL region (0–5.176 cM) for plant resistance against chewing herbivores at chromosome 3. b) QTL effects for plant resistance of D. stramonium at chromosome 3 plotted by genotypes. A and B alleles were inherited from the Teotihuacán (low resistance) and Ticumán (high resistance) grandparents to produce the F2 progeny, respectively. c) Additive (a) and dominance (d) effects of the QTL, revealing a dominance effect of the allele B, which was inherited from the Ticumán parent. d) Relationship between the genotypes and plant resistance (untransformed data); mean and standard errors are also shown in the figure. Genotype AA has lower resistance than BB and AB genotypes.
Fig. 4.
Fig. 4.
a) Dot plot illustrating the Log2FoldChange of enriched overexpressed genes from the DGEA between undamaged and damaged plants by the larvae of L. daturaphila (the most dangerous folivore of D. stramonium). Natural plants from the Ticumán population were used for the DGEA. Functional annotation was performed by MapMan4. The size of the circle represents the mean transcript counts for plant damage. The plot is ordered in ascending mode from the highest Log2FoldChange. b) Gene coexpression network analysis showing the relationships between the coexpressed genes. In yellow color is highlighted the receptor-like protein kinase (RLCK-VLLa) gene that was either found within the QTL region (0–5.176 cM) or overexpressed in the DGEA between undamaged and damaged plants from the Ticumán population of D. stramonium. This gene is highly connected to important genes that have been related to plant resistance in D. stramonium, such as UDP-glycosyltranferase, ethylene response and H6H, DTX metabolite transporter, and the transcription factor WRKY. The gene RLCK-VLLa connects 2 modules of genes in the network via the transcription factor WRKY. Red and blue lines show positive and negative correlations, respectively. See also Fig. 5 and Supplementary Fig. 2.
Fig. 5.
Fig. 5.
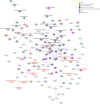
Protein–protein interaction subnetwork constructed in STRING-db using both the genes detected within the QTL region and overexpressed genes from the differential expression analysis between damage and undamaged plants by the larvae of L. daturaphila. According with gene ontology, this subnetwork was classified within catalytic activity. Important genes related to the plant resistance machinery were detected within this subnetwork. Genes related to signaling of plant damage and involved in the biosynthesis of tropane alkaloids, terpenoids, and carotenoid biosynthesis were associated in this network. See also Supplementary Fig. 2.

Similar articles

References

    1. Afzal AJ, Wood AJ, Lightfoot DA. 2008. Plant receptor-like serine threonine kinases: roles in signaling and plant defense. Mol Plant Microbe Interact. 21(5):507–517. doi:10.1094/MPMI-21-5-0507. - DOI - PubMed
    1. Agrawal AA, Fishbein M. 2006. Plant defense syndromes. Ecology. 87(sp7):132–149. doi:10.1890/0012-9658(2006)87[132:PDS]2.0.CO;2. - DOI - PubMed
    1. Andrews S. 2010. FastQC: a quality control tool for high throughput sequence data [Online]. https://www.bioinformatics.babraham.ac.uk/projects/fastqc/
    1. Ashburner M, Ball CA, Blake JA, Botstein D, Butler H, Cherry JM, Davis AP, Dolinski K, Dwight SS, Eppig JT, et al. . 2000. Gene ontology: tool for the unification of biology. Nat Genet. 25(1):25–29. doi:10.1038/75556. - DOI - PMC - PubMed
    1. Benjamini Y, Hochberg Y. 1995. Controlling the false discovery rate: a practical and powerful approach to multiple testing. J R Stat Soc Series B Stat Methodol. 57(1):289–300. doi:10.1111/j.2517-6161.1995.tb02031.x. - DOI

Publication types

LinkOut - more resources