. 2023 Nov 22;25(1):bbad380.
doi: 10.1093/bib/bbad380.

CoRegNet: unraveling gene co-regulation networks from public RNA-Seq repositories using a beta-binomial statistical model

Affiliations

CoRegNet: unraveling gene co-regulation networks from public RNA-Seq repositories using a beta-binomial statistical model

Jiasheng Wang et al. Brief Bioinform. .

Abstract

Millions of RNA sequencing samples have been deposited into public databases, providing a rich resource for biological research. These datasets encompass tens of thousands of experiments and offer comprehensive insights into human cellular regulation. However, a major challenge is how to integrate these experiments that acquired at different conditions. We propose a new statistical tool based on beta-binomial distributions that can construct robust gene co-regulation network (CoRegNet) across tens of thousands of experiments. Our analysis of over 12 000 experiments involving human tissues and cells shows that CoRegNet significantly outperforms existing gene co-expression-based methods. Although the majority of the genes are linearly co-regulated, we did discover an interesting set of genes that are non-linearly co-regulated; half of the time they change in the same direction and the other half they change in the opposite direction. Additionally, we identified a set of gene pairs that follows the Simpson's paradox. By utilizing public domain data, CoRegNet offers a powerful approach for identifying functionally related gene pairs, thereby revealing new biological insights.

Keywords: Simpson’s paradox; beta-binomial statistical model; co-regulation network; gene network; non-linear correlation.


Figures

Figure 1
Figure 1
Co-regulation network (CoRegNet) framework. (A) Identify co-regulated DEG pairs in each contrast. Each contrast contains two groups with a given label or a DASC label. (B) Generate the binary DEG matrix with rows of genes and columns of contrasts. If the gene in the corresponding contrast is a DEG then marked as 1 otherwise 0. (C) Generate the co-regulation list including all the gene pairs. The value in the list represents the number of contrasts each gene pair co-regulated. (D) 1000 random binary DEG matrices will be sampled with the same row and column sums as the true binary DEG matrix. (E) 1000 sampling-based co-regulation lists will be calculated based on each of the random binary DEG matrices. Each column represents a co-regulation list for each sampling, and each row is the random variable of a gene pair’s coregulation. (F) Apply beta-binomial distribution to fit the random variable and take the true co-regulation times as the cutoff to identify significant DEG pairs. (G) Calculate the p-value and FDR of each gene pair. (H) Identify the FDR cutoff of a scale-free co-regulation network and visualize it.
Figure 2
Figure 2
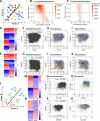
Co-regulation model can identifynon-linear correlation and Simpson’s paradox in the integrated data. (A) Schematic diagram of non-linear correlation. Samples in warm colors are concordantly correlated while samples in cold colors are discordantly correlated. (B) Co-regulated gene pairs with low correlation scores tend to have higher non-linear scores in the integrated data. (C) Co-expressed gene pairs tend to have a higher mean correlation score regardless of non-linear score. (D, E) The log2FC heatmap of nonlinear correlated gene pairs. (F, G) The gene pair’s Pearson’s correlation score. (H, I) Samples from contrasts that are concordantly co-regulated. (J, K) Samples from contrasts that is discordantly co-regulated. (L) Schematic diagram of Simpson’s paradox. (M, N) The log2FC heatmap of negatively correlated gene pairs. (O, P) The gene pair’s Pearson’s correlation score is positive. (Q, R) Samples are only discordantly coregulated in each contrast.
Figure 3
Figure 3
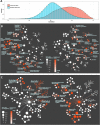
Comparison between linear and nonlinear genes: (A) Histogram of Pearson’s correlation in GTEx data between top linear genes and non-linear genes. (B, C) Left and right trees share the same topology of gene ontology (B) or human phenotype ontology(C), with nodes indicating terms and edges indicating hierarchical relations between terms. Node sizes represent the number of genes belong to a term. Node colors the enrichment significance, with cutoff where FDR < 0.01. The left tree is how linear genes are enriched, and the right tree is how non-linear genes are enriched. Nodes and modules with high enrichment significance are labeled.
Figure 4
Figure 4
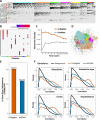
The co-regulation network on Recount3. (A) Binary co-regulation heatmap with rows of contrasts and columns of genes. The left color bar represents different contrasts, and the top color bar represents genes in different modules. If a gene is a DEG in the contrast, it will be colored as black. (B) GO enrichment comparison between different gene modules. (C) GO term interaction density between Recount3 co-regulation network and random network. (D) PPI validation between co-regulated gene pairs and co-expressed gene pairs. (E) Comparison of Pearson’s correlation between co-regulated gene pairs and co-expressed gene pairs in Recount3 data. (F) Validation by comparing Pearson’s correlation of co-expressed and co-regulated gene pairs from Recount3 in the independent GTEx data.
Figure 5
Figure 5
The co-regulation network on Recount2 Brain. (A) Binary co-regulation heatmap with rows of contrasts and columns of genes. The left color bar represents different contrasts, and the top color bar represents genes in different modules. If a gene is a DEG in the contrast, it will be colored as black. (B) GO enrichment comparison between different gene modules. (C) GO term interaction density between Recount2 Brain co-regulation network and random network. (D) Visualized Recount2 Brain co-regulation network. (E) PPI validation between co-regulated gene pairs and co-expressed gene pairs. (F) Validation by comparing Pearson’s correlation of co-expressed and co-regulated gene pairs from Recount2 Brain in the independent GTEx data.
Figure 6
Figure 6
(A) The IFIT family subnetwork. The green genes have a known OMIM phenotype. The blue genes lack known OMIM phenotypes but are recorded as pathogenic in ClinVar. The pink genes lack known OMIM phenotypes and are recorded as non-pathogenic in ClinVar. (B) The proportion of OMIM gene neighbors is positively correlated with the total number of neighbors a gene has. (C) The proportion of lethal gene neighbors is positively correlated with the total number of neighbors a gene has.

References

    1. Barrett T, Wilhite SE, Ledoux P, et al. NCBI GEO: archive for functional genomics data sets—update. Nucleic Acids Res 2013;41:D991–5. - PMC - PubMed
    1. Kolesnikov N, Hastings E, Keays M, et al. ArrayExpress update—simplifying data submissions. Nucleic Acids Res 2015;43:D1113–6. - PMC - PubMed
    1. Ritchie ME, Phipson B, Wu D, et al. Limma powers differential expression analyses for RNA-sequencing and microarray studies. Nucleic Acids Res 2015;43:e47–7. - PMC - PubMed
    1. Zhang Y, Parmigiani G, Johnson WE. ComBat-seq: batch effect adjustment for RNA-seq count data. NAR Genom Bioinform 2020;2:lqaa078. - PMC - PubMed
    1. Furlotte NA, Kang HM, Ye C, Eskin E. Mixed-model coexpression: calculating gene coexpression while accounting for expression heterogeneity. Bioinformatics 2011;27:i288–94. - PMC - PubMed

Publication types