. 2024 Feb 8;9(3):e169870.
doi: 10.1172/jci.insight.169870.

Tertiary lymphoid structures sustain cutaneous B cell activity in hidradenitis suppurativa

Affiliations

Tertiary lymphoid structures sustain cutaneous B cell activity in hidradenitis suppurativa

Margaret M Lowe et al. JCI Insight. .

Abstract

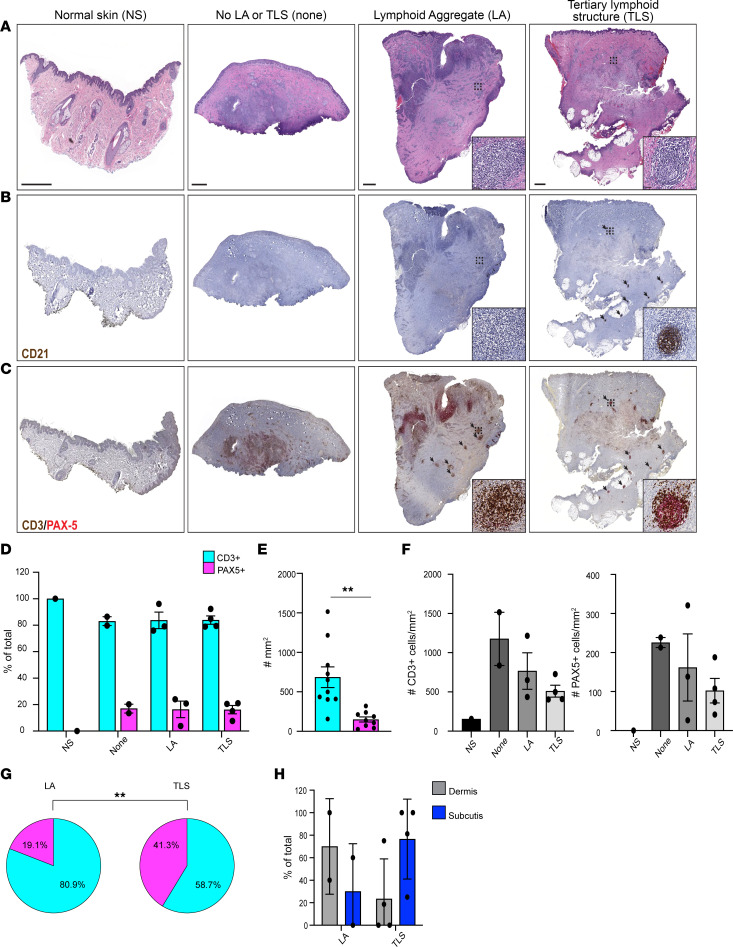
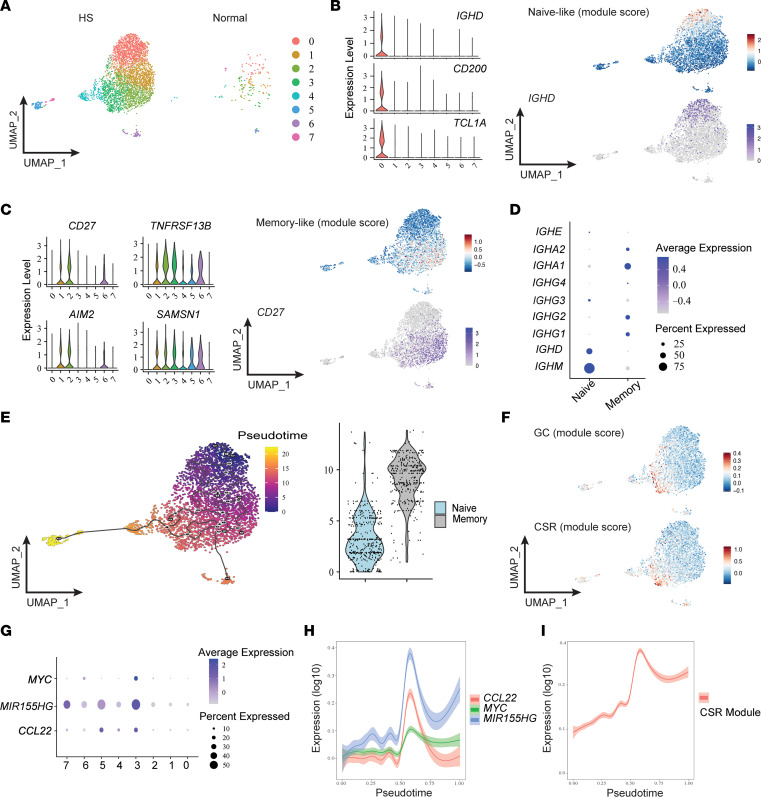
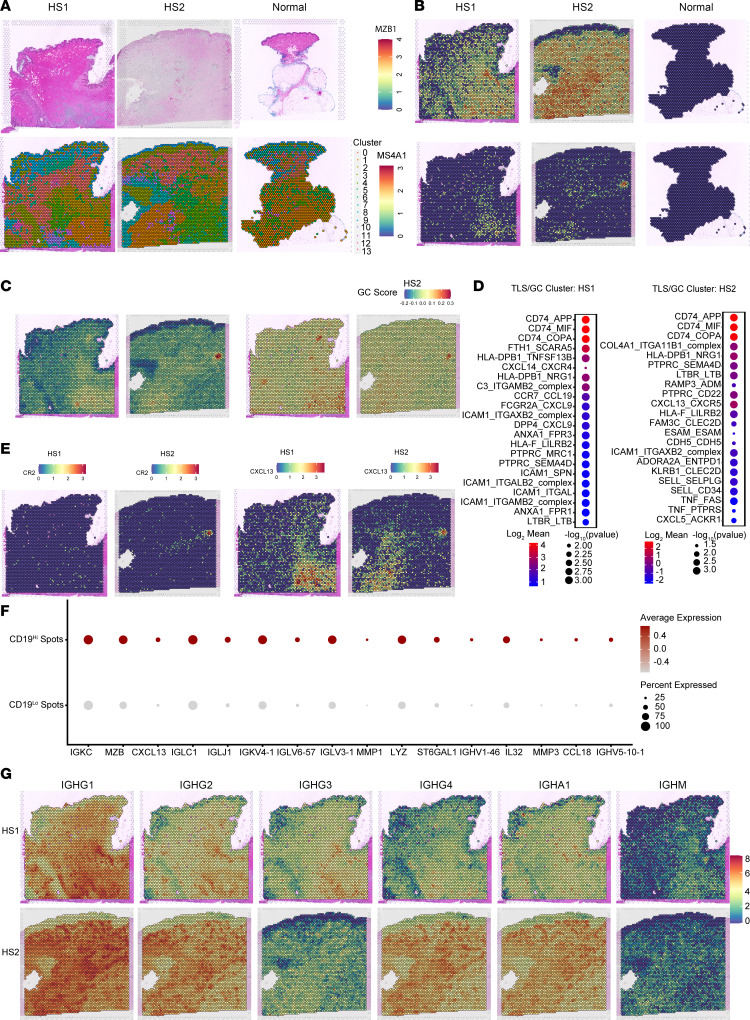
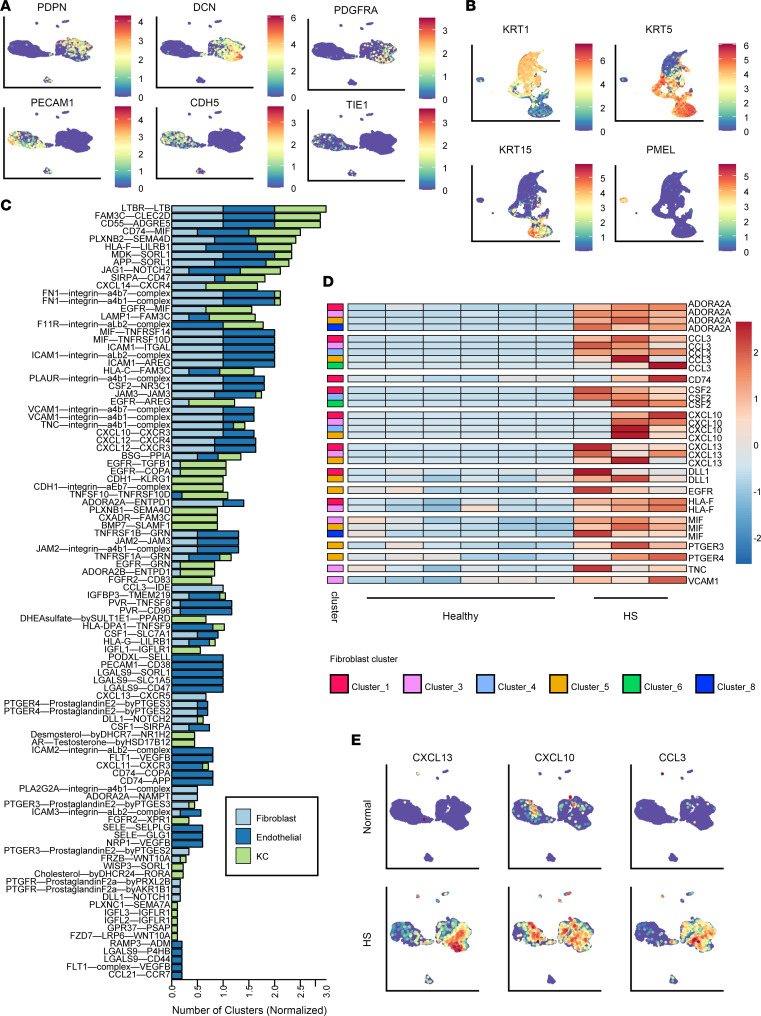
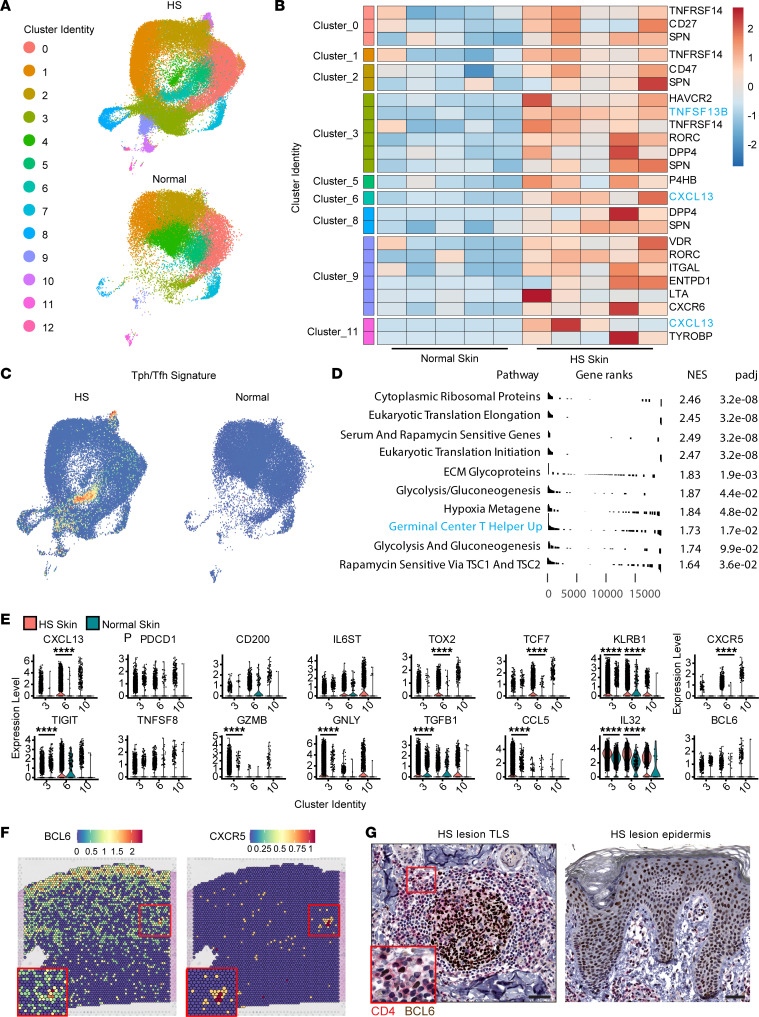
Hidradenitis suppurativa (HS) is a chronic skin condition affecting approximately 1% of the US population. HS skin lesions are highly inflammatory and characterized by a large immune infiltrate. While B cells and plasma cells comprise a major component of this immune milieu, the biology and the contribution of these cells in HS pathogenesis are unclear. We aimed to investigate the dynamics and microenvironmental interactions of B cells within cutaneous HS lesions. Combining histological analysis, single-cell RNA sequencing, and spatial transcriptomics profiling of HS lesions, we defined the tissue microenvironment relative to B cell activity within this disease. Our findings identified tertiary lymphoid structures (TLSs) within HS lesions and described organized interactions among T cells, B cells, antigen-presenting cells, and skin stroma. We found evidence that B cells within HS TLSs actively underwent maturation, including participation in germinal center reactions and class switch recombination. Moreover, skin stroma and accumulating T cells were primed to support the formation of TLSs and facilitate B cell recruitment during HS. Our data definitively demonstrated the presence of TLSs in lesional HS skin and point to ongoing cutaneous B cell maturation through class switch recombination and affinity maturation during disease progression in this inflamed nonlymphoid tissue.

Keywords: Adaptive immunity; Dermatology; Immunology; Skin.


Figures

Figure 1
Figure 1. TLSs are present in HS skin.
(A) Low-power photomicrographs of H&E-stained sections of healthy and HS skin with the indicated features. Dashed boxes indicate representative LAs or TLSs, and insets show a higher power magnification image within dashed boxes; scale bars = 2 mm. (B) Low- and higher power (insets) photomicrographs of CD21 immunohistochemistry (IHC) on normal and HS skin. (C) Low- and higher power (insets) photomicrographs of multiplex CD3 (brown chromogen)/PAX5 (red chromogen) IHC on normal and HS skin. Black arrows indicate LAs and TLSs. PAX5, paired box protein 5. (D) Frequency of CD3+PAX5 and CD3PAX5+ cells in normal skin and each subset of HS skin based on presence or absence of LAs or TLSs. (E) Number of CD3+PAX5 and CD3PAX5+ cells in HS skin per unit area. (F) Number of CD3+PAX5 and CD3PAX5+ cells in each subset of HS skin based on presence or absence of LAs or TLSs. (G) Frequency of CD3+PAX5 and CD3PAX5+ cells in LA or TLS annotated regions. (H) Frequency of the microanatomic distribution in the dermis or subcutis of LAs and TLSs in HS skin. Data are compiled from 3 HS cases with no evidence of TLSs/LAs, 2 cases with LAs, and 4 cases with TLSs. **P < 0.01, 2-tailed Student’s t test.
Figure 2
Figure 2. B cells in HS skin exhibit signatures of active maturation.
(A) Uniform manifold approximation and projections (UMAPs) of B cell scRNA-Seq clusters from either HS lesions or normal skin. Data represent concatenation of samples from 5 patients with HS and 2 healthy donors. (B) Expression of naive B cell–associated genes and corresponding module score comprising IGHD, CD200, and TCL1A. UMAPs depict naive-like module score intensity and IGHD expression. Data represent 5 patients with HS. (C) Expression of memory B cell–associated genes and corresponding module score comprising CD27, SAMSN1, TNFRSF13B, and AIM2. UMAPs depict memory-like module score intensity and CD27 expression. (D) Mean expression of B cell receptor isotype genes among naive and memory B cells from 5 HS lesions. (E) UMAP and naive versus memory comparison of B cells from 5 HS lesions analyzed with Monocle 3 for pseudotime. Black lines indicate pseudotime trajectories. (F) UMAP visualization of GC and CSR module scores among B cells from 5 HS lesions. (G) Mean expression of GC positive selection–associated genes across HS lesional B cell clusters from 5 patients. (H and I) Plots display gene expression by pseudotime.
Figure 3
Figure 3. Spatial transcriptomics identifies distinct regions of TLS involvement in HS skin.
(A) H&E staining (top) and unsupervised clustering (bottom) of spatial transcriptomics data of 2 HS samples and 1 healthy skin sample. (B) Spatial feature plot depicting expression of B cell lineage marker genes MZB1 and MS4A1 in spatial transcriptomics data of 2 HS samples and 1 healthy skin sample. (C) Spatial feature plot depicting module scores of TLS signature genes (left) and GC signature genes (right) in 2 HS skin samples. (D) Dot plot of CellPhoneDB analysis depicting the top significant ligand-receptor interactions occurring within clusters of high GC/TLS scores in HS samples (cluster 14, HS1, cluster 8, HS2) (P < 0.05). (E) Spatial feature plot depicting expression of B cell recruitment factor CXCL13 and FDC marker CR2 in 2 HS skin samples. (F) Dot plot depicting significantly increased genes comparing spots with high expression of CD19 (CD19 ≥ 0.5) versus low expression of CD19 (CD19 < 0.5) from 2 HS skin samples (adjusted P [padj] < 0.05, Wilcoxon test). (G) Spatial feature plot depicting expression of immunoglobulin genes IGHG1, IGHG2, IGHG3, IGHG4, IGHA1, and IGHM in 2 HS skin samples.
Figure 4
Figure 4. Fibroblasts are primed to support and recruit B cells in HS skin.
(A) UMAPs of stromal cell scRNA-Seq clusters from HS lesions and normal skin showing expression of endothelial and fibroblast signature genes. Data represent samples from 3 HS donors and 6 normal skin donors. (B) UMAPs of scRNA-Seq data of epidermal cells from HS lesions and healthy skin showing expression of keratinocyte signature genes. Data represent samples from 2 HS donors and 2 normal skin donors. (C) Significant (P < 0.005) ligand-receptor interaction partners identified by CellPhoneDB between clusters of stromal cells (left partner) and B cells (right partner). Numbers of clusters involved are normalized to the total number of clusters involved per cell type. B cell data were utilized from 5 HS donors, keratinocyte data from 2 HS donors, and endothelial and fibroblast clusters from 3 HS donors. (D) Row-normalized heatmap depicting pseudobulk scRNA-Seq counts of significantly upregulated (adjusted P < 0.05, Wald test) genes in HS fibroblast clusters versus healthy skin fibroblast clusters. Data represent samples from 3 HS donors and 6 normal skin donors. (E) UMAPs of stromal cell scRNA-Seq clusters from HS lesions and healthy skin showing expression of select differentially expressed genes. Data represent samples from 3 HS donors and 6 healthy skin donors.
Figure 5
Figure 5. CXCL13-expressing Tph are increased in HS lesional skin.
(A) UMAPs of CD4+ T cell scRNA-Seq clusters from 5 HS lesions and 5 normal skin samples. (B) Row-normalized heatmap depicting pseudobulk scRNA-Seq counts of significantly upregulated (padj < 0.05) genes identified as B cell interaction partners in HS CD4+ T cell clusters versus healthy skin CD4+ T cell clusters. (C) UMAPs of CD4+ T cell scRNA-Seq clusters from HS lesions and healthy skin showing expression of a Tph/Tfh gene module. (D) Top 10 significantly enriched (padj < 0.05) GSEA results of Human MSigDB Collections C2 gene signatures comparing cluster 6 cells from HS lesional skin with all other clusters. NES, normalized enrichment score. (E) Violin plots of gene expression from clusters 3, 6, and 10 from HS lesions and normal skin showing expression of select genes. Data represent samples from 5 HS donors and 5 normal skin donors. (F) Spatial feature plot depicting expression of BCL6 and CXCR5 from an HS patient lesional section with a previously identified TLS. Red box inset highlights region where a TLS gene signature is enriched. (G) Photomicrograph of CD4 (red chromogen)/BCL6 (brown chromogen) IHC on an HS skin section highlighting a TLS (left) and the epidermis (right). Scale bar = 50 μm; inset scale bar = 5 μm; ****P < 0.0001, Wilcoxon test.

Update of

References

    1. Van Straalen KR, et al. Insights into hidradenitis suppurativa. J Allergy Clin Immunol. 2022;149(4):1150–1161. doi: 10.1016/j.jaci.2022.02.003. - DOI - PubMed
    1. Yu CC, Cook MG. Hidradenitis suppurativa: a disease of follicular epithelium, rather than apocrine glands. Br J Dermatol. 1990;122(6):763–769. doi: 10.1111/j.1365-2133.1990.tb06264.x. - DOI - PubMed
    1. Navrazhina K, et al. Epithelialized tunnels are a source of inflammation in hidradenitis suppurativa. J Allergy Clin Immunol. 2021;147(6):2213–2224. doi: 10.1016/j.jaci.2020.12.651. - DOI - PMC - PubMed
    1. Sabat R, et al. Neutrophilic granulocyte-derived BAFF supports B cells in skin lesions in hidradenitis suppurativa. J Allergy Clin Immunol. 2023;151(4):1015–1026. doi: 10.1016/j.jaci.2022.10.034. - DOI - PubMed
    1. Lowe MM, et al. Immunopathogenesis of hidradenitis suppurativa and response to anti–TNF-α therapy. JCI Insight. 2020;5(19):139932. doi: 10.1172/jci.insight.139932. - DOI - PMC - PubMed

Publication types

MeSH terms