A kinetic model of iron trafficking in growing Saccharomyces cerevisiae cells; applying mathematical methods to minimize the problem of sparse data and generate viable autoregulatory mechanisms
- PMID: 38113197
- PMCID: PMC10729996
- DOI: 10.1371/journal.pcbi.1011701
A kinetic model of iron trafficking in growing Saccharomyces cerevisiae cells; applying mathematical methods to minimize the problem of sparse data and generate viable autoregulatory mechanisms
Abstract
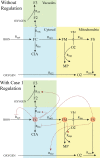
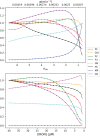
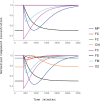
Iron is an essential transition metal for all eukaryotic cells, and its trafficking throughout the cell is highly regulated. However, the overall cellular mechanism of regulation is poorly understood despite knowing many of the molecular players involved. Here, an ordinary-differential-equations (ODE) based kinetic model of iron trafficking within a growing yeast cell was developed that included autoregulation. The 9-reaction 8-component in-silico cell model was solved under both steady-state and time-dependent dynamical conditions. The ODE for each component included a dilution term due to cell growth. Conserved rate relationships were obtained from the null space of the stoichiometric matrix, and the reduced-row-echelon-form was used to distinguish independent from dependent rates. Independent rates were determined from experimentally estimated component concentrations, cell growth rates, and the literature. Simple rate-law expressions were assumed, allowing rate-constants for each reaction to be estimated. Continuous Heaviside logistical functions were used to regulate rate-constants. These functions acted like valves, opening or closing depending on component "sensor" concentrations. Two cellular regulatory mechanisms were selected from 134,217,728 possibilities using a novel approach involving 6 mathematically-defined filters. Three cellular states were analyzed including healthy wild-type cells, iron-deficient wild-type cells, and a frataxin-deficient strain of cells characterizing the disease Friedreich's Ataxia. The model was stable toward limited perturbations, as determined by the eigenvalues of Jacobian matrices. Autoregulation allowed healthy cells to transition to the diseased state when triggered by a mutation in frataxin, and to the iron-deficient state when cells are placed in iron-deficient growth medium. The in-silico phenotypes observed during these transitions were similar to those observed experimentally. The model also predicted the observed effects of hypoxia on the diseased condition. A similar approach could be used to solve ODE-based kinetic models associated with other biochemical processes operating within growing cells.
Copyright: © 2023 Thorat et al. This is an open access article distributed under the terms of the Creative Commons Attribution License, which permits unrestricted use, distribution, and reproduction in any medium, provided the original author and source are credited.
Conflict of interest statement
The authors have declared that no competing interests exist.
Figures


Similar articles
-
Iron Homeostatic Regulation in Saccharomyces cerevisiae: Introduction to a Computational Modeling Method.Methods Mol Biol. 2024;2839:3-29. doi: 10.1007/978-1-0716-4043-2_1. Methods Mol Biol. 2024. PMID: 39008245 Free PMC article. Review.
-
Glutathione-dependent redox status of frataxin-deficient cells in a yeast model of Friedreich's ataxia.Hum Mol Genet. 2008 Sep 15;17(18):2790-802. doi: 10.1093/hmg/ddn178. Epub 2008 Jun 18. Hum Mol Genet. 2008. PMID: 18562474
-
A mathematical model of iron import and trafficking in wild-type and Mrs3/4ΔΔ yeast cells.BMC Syst Biol. 2019 Feb 21;13(1):23. doi: 10.1186/s12918-019-0702-2. BMC Syst Biol. 2019. PMID: 30791941 Free PMC article.
-
Mitochondrial Iron-Sulfur Cluster Activity and Cytosolic Iron Regulate Iron Traffic in Saccharomyces cerevisiae.J Biol Chem. 2015 Nov 6;290(45):26968-26977. doi: 10.1074/jbc.M115.676668. Epub 2015 Aug 25. J Biol Chem. 2015. PMID: 26306041 Free PMC article.
-
Fixing frataxin: 'ironing out' the metabolic defect in Friedreich's ataxia.Br J Pharmacol. 2014 Apr;171(8):2174-90. doi: 10.1111/bph.12470. Br J Pharmacol. 2014. PMID: 24138602 Free PMC article. Review.
Cited by
-
Iron Homeostatic Regulation in Saccharomyces cerevisiae: Introduction to a Computational Modeling Method.Methods Mol Biol. 2024;2839:3-29. doi: 10.1007/978-1-0716-4043-2_1. Methods Mol Biol. 2024. PMID: 39008245 Free PMC article. Review.
-
A kinetic model of copper homeostasis in Saccharomyces cerevisiae.J Biol Chem. 2025 Aug;301(8):110368. doi: 10.1016/j.jbc.2025.110368. Epub 2025 Jun 16. J Biol Chem. 2025. PMID: 40533061 Free PMC article.
References
-
- Nijhout HF, Best JA, Reed MC. System biology of robustness and homeostatic mechanisms. WIREs Syst. Biol. Med. 2019; 11: e1440. - PubMed
MeSH terms
Substances
Grants and funding
LinkOut - more resources
Full Text Sources

