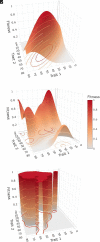
Drift on holey landscapes as a dominant evolutionary process
- PMID: 38113257
- PMCID: PMC10756301
- DOI: 10.1073/pnas.2313282120
Drift on holey landscapes as a dominant evolutionary process
Abstract
An organism's phenotype has been shaped by evolution but the specific processes have to be indirectly inferred for most species. For example, correlations among traits imply the historical action of correlated selection and, more generally, the expression and distribution of traits is expected to be reflective of the adaptive landscapes that have shaped a population. However, our expectations about how quantitative traits-like most behaviors, physiological processes, and life-history traits-should be distributed under different evolutionary processes are not clear. Here, we show that genetic variation in quantitative traits is not distributed as would be expected under dominant evolutionary models. Instead, we found that genetic variation in quantitative traits across six phyla and 60 species (including both Plantae and Animalia) is consistent with evolution across high-dimensional "holey landscapes." This suggests that the leading conceptualizations and modeling of the evolution of trait integration fail to capture how phenotypes are shaped and that traits are integrated in a manner contrary to predictions of dominant evolutionary theory. Our results demonstrate that our understanding of how evolution has shaped phenotypes remains incomplete and these results provide a starting point for reassessing the relevance of existing evolutionary models.
Keywords: G matrix; evolutionary constraints; fitness landscapes.
Conflict of interest statement
Competing interests statement:The authors declare no competing interest.
Figures


Similar articles
-
A mathematical framework for evo-devo dynamics.Theor Popul Biol. 2024 Feb;155:24-50. doi: 10.1016/j.tpb.2023.11.003. Epub 2023 Dec 2. Theor Popul Biol. 2024. PMID: 38043588
-
Evolutionary potential varies across populations and traits in the neotropical oak Quercus oleoides.Tree Physiol. 2019 Mar 1;39(3):427-439. doi: 10.1093/treephys/tpy108. Tree Physiol. 2019. PMID: 30321394
-
Social competition as a driver of phenotype-environment correlations: implications for ecology and evolution.Biol Rev Camb Philos Soc. 2021 Dec;96(6):2561-2572. doi: 10.1111/brv.12768. Epub 2021 Jun 18. Biol Rev Camb Philos Soc. 2021. PMID: 34145714 Free PMC article.
-
Genetic approaches in comparative and evolutionary physiology.Am J Physiol Regul Integr Comp Physiol. 2015 Aug 1;309(3):R197-214. doi: 10.1152/ajpregu.00100.2015. Epub 2015 Jun 3. Am J Physiol Regul Integr Comp Physiol. 2015. PMID: 26041111 Free PMC article. Review.
-
Variation, selection and evolution of function-valued traits.Genetica. 2001;112-113:87-104. Genetica. 2001. PMID: 11838789 Review.
References
-
- Wright S., Surfaces of selective value revisited. Am. Nat. 131, 115–123 (1988).
-
- Wright S., “The roles of mutation, inbreeding, crossbreeding and selection in evolution” in Proceedings of the Sixth International Congress of Genetics, Jones D., Ed. (Ithaca, NY, 1932), pp. 356–366.
-
- Olson M. E., Arroyo-Santos A., Vergara-Silva F., A user’s guide to metaphors in ecology and evolution. Trends Ecol. Evol. 34, 605–615 (2019). - PubMed
-
- Armbruster W., Schwaegerle K., Causes of covariation of phenotypic traits among populations. J. Evol. Biol. 9, 261–276 (1996).
-
- Armbruster W. S., Estimating and testing the shapes of adaptive surfaces: The morphology and pollination of Dalechampia blossoms. Am. Nat. 135, 14–31 (1990).
MeSH terms
Grants and funding
LinkOut - more resources
Full Text Sources

