. 2023 Dec 26;120(52):e2305684120.
doi: 10.1073/pnas.2305684120. Epub 2023 Dec 19.

Tiam1 methylation by NSD2 promotes Rac1 signaling activation and colon cancer metastasis

Affiliations

Tiam1 methylation by NSD2 promotes Rac1 signaling activation and colon cancer metastasis

Da Song et al. Proc Natl Acad Sci U S A. .

Abstract

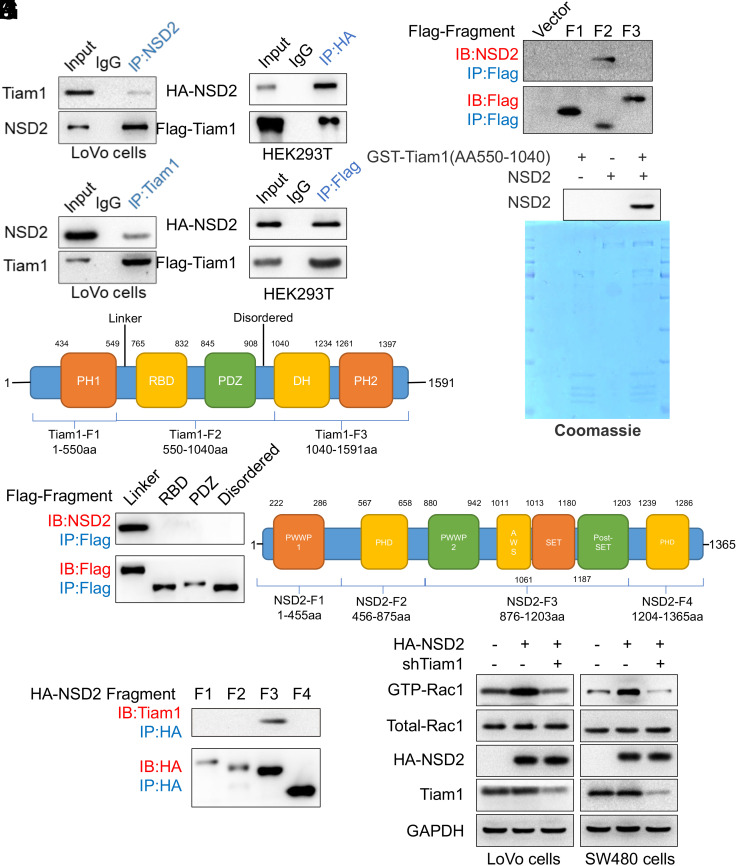
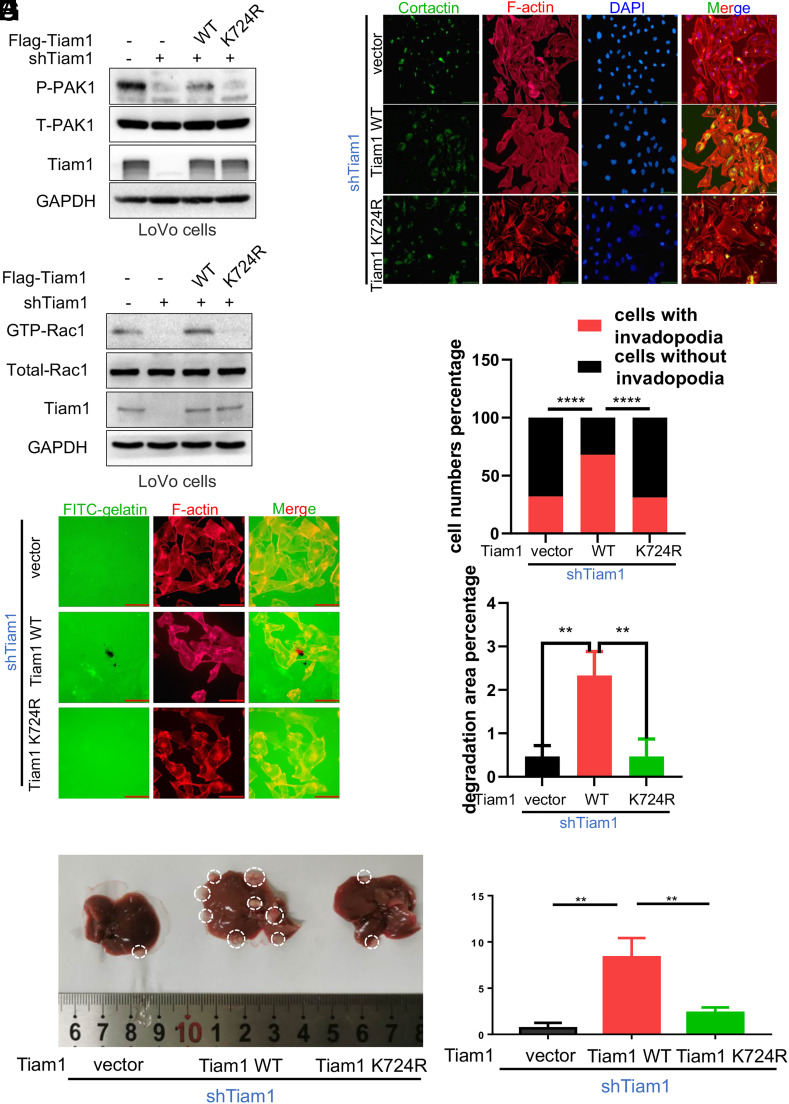
Metastasis is a major cause of cancer therapy failure and mortality. However, targeting metastatic seeding and colonization remains a significant challenge. In this study, we identified NSD2, a histone methyltransferase responsible for dimethylating histone 3 at lysine 36, as being overexpressed in metastatic tumors. Our findings suggest that NSD2 overexpression enhances tumor metastasis both in vitro and in vivo. Further analysis revealed that NSD2 promotes tumor metastasis by activating Rac1 signaling. Mechanistically, NSD2 combines with and activates Tiam1 (T lymphoma invasion and metastasis 1) and promotes Rac1 signaling by methylating Tiam1 at K724. In vivo and in vitro studies revealed that Tiam1 K724 methylation could be a predictive factor for cancer prognosis and a potential target for metastasis inhibition. Furthermore, we have developed inhibitory peptide which was proved to inhibit tumor metastasis through blocking the interaction between NSD2 and Tiam1. Our results demonstrate that NSD2-methylated Tiam1 promotes Rac1 signaling and cancer metastasis. These results provide insights into the inhibition of tumor metastasis.

Keywords: NSD2; Rac1 signaling; Tiam1 methylation; cancer metastasis.


Conflict of interest statement

Competing interests statement:The authors declare no competing interest.

Figures

Fig. 1.
Fig. 1.
Increased expression of NSD2 promotes tumor metastasis. (A) RNA-seq of paired primary and liver metastasis specimens of CRC, CRC cell line SW620, and specific liver metastasis cell line SW620L1 was performed (n = 4) (GSE237996). (B) Liver metastases, primary tumors, and adjacent tissues of colon cancer were collected and subjected to WB analysis. (C) IHC staining for NSD2 in paratumor, primary tumor, and liver metastasis tissues (D) An in vivo liver metastatic model using indicated LoVo cells was set up (n = 5). Quantitative analysis of metastases on the liver (Up), representative images (Middle), and PET/CT images (Down). (E) IHC staining for NSD2 in paired control colonic mucosa and primary tumor tissues of CRC (n = 79). (F) Scatter plot of NSD2 IHC staining score comparing different clinical stages in CRC specimens (n = 80). (G) Kaplan–Meier survival analysis comparing high and low levels of NSD2 using microarray of CRC specimen; P = 0.0386. (H) Visualization of NSD2 TCGA data in COAD using MEXPRESS. A complex interplay was found between gene expression, T stage, M stage, lymphatic invasion status, B-Raf mutation status, K-Ras mutation status, etc. (https://mexpress.be/). Results are presented as mean ± SD, *P < 0.05, **P < 0.01, ***P < 0.001, and ****P < 0.0001.
Fig. 2.
Fig. 2.
NSD2 interacts with and activates Tiam1 to promote Rac1 signaling. (A and B) WCE of LoVo cells were collected and subjected to co-IP assays. (C and D) HEK293T was transfected with Flag-Tiam1 and HA-NSD2 plasmid, and co-IP assays were performed using Flag-conjugated magnetic beads and HA-conjugated magnetic beads, respectively. (E) Truncations of Tiam1 according to its functional domain. (F) HEK293T cells were transfected with Flag-Tiam1 fragment plasmid and HA-NSD2 plasmid, and co-IP assays were performed using Flag-conjugated magnetic beads. (G) An in vitro binding assay using purified Tiam1 fragment protein and NSD2 commercially available protein. (H) The second fragment of Tiam1(aa550-1040) was further divided into four parts, and HEK293T cells were transfected with Flag-Tiam1 fragment plasmid and HA-NSD2 plasmid, and co-IP assays were performed using Flag-conjugated magnetic beads. (I) Truncations of NSD2 according to its functional domain. (J) HEK293T cells were transfected with Flag-Tiam1 plasmid and HA-NSD2 fragment plasmid, and co-IP assays were performed using HA-conjugated magnetic beads. (K) Rac1 activity detection assay was performed in LoVo cells and SW480 cells which were infected with HA-NSD2 overexpressing and Tiam1 KD lentivirus.
Fig. 3.
Fig. 3.
NSD2 methylates Tiam1 at K724. (A) LoVoNSD2KO cells were stably transfected with NSD2 WT, after which WCE was collected for a quantified immunoprecipitation (qIP) assay. (B) HEK293T cells were transfected with the second fragment of Tiam1 (Flag-Tiam1-F2), and WCE was collected for a qIP assay. (C) Nsd2fl/fl MEFs were transduced with lentivirus containing NC sequence or CRE enzyme, and WCE was collected for qIP assay. (D) Commercially available full-length NSD2 protein was incubated with S-adenosyl-L-methionine along with GST-Tiam1-F2 purified from engineered bacteria for in vitro methylation. The GST-Tiam1-F2 proteins were enriched with GST-pulldown and their methylation was analyzed using WB analysis. (E). Several potential methylation residues were identified through MS assay and represented by a sketch map. (F) Secondary MS graph of Tiam1 K724 methylation. (G, H, and I) K to R mutants at indicated residues were constructed and transfected into HEK293T cells with or without NSD2 overexpression. Flag-Tiam1 WT or mutants were enriched by qIP assay and their methylation level was determined by WB assay, and the grayscales were statistically counted.
Fig. 4.
Fig. 4.
NSD2 promotes Rac1 signaling activation and cancer metastasis depending on the methylation of Tiam1 K724. (A) LoVoTiam1KD was obtained using lentivirus containing 3′UTR against Tiam1. Cells were restored then with Tiam1-WT or Tiam1-K724R containing lentivirus, and WCE was collected for Rac1 activation assay. (B) LoVoTiam1KD was obtained using lentivirus containing 3′UTR against Tiam1. Cells were restored then with Tiam1-WT or Tiam1-K724R containing lentivirus, and WCE was collected for WB assay. (C and D) Immunofluorescence of invadopodia marks in indicated disposed SW480 cells and the statistical results. (E and F). Tiam1 stable knockdown LoVo cells were transfected with Tiam1 WT, Tiam1 K724 or control plasmids, these cells were plated on FITC-conjugated coated coverslips, immunofluorescence of FITC (green) and phalloidin (red) was observed and the FITC-gelatin degradation statistical results. (G and H) An in vivo liver metastatic model using indicated LoVo cells was set up (n = 5). Representative images (Left); quantitative analysis of metastases on the liver (Right). All experiments were performed in triplicate at least three times. Results are presented as mean ± SD, **P < 0.01 and ***P < 0.001.
Fig. 5.
Fig. 5.
NSD2 promotes metastasis through regulating the methylation of Tiam1-K724. (A) SW480 Tiam1KD and LoVoTiam1KDcells were restored with Tiam1-WT or Tiam1-K724R containing lentivirus along with or without NSD2 overexpression, and WCE was collected for a Rac1 activation assay. (B and C) SW480Tiam1KD cells were restored with Tiam1-WT or Tiam1-K724R containing lentivirus along with or without NSD2 overexpression, immunofluorescence of invadopodia marks in these cells were labeled and the statistical results were shown. (D and E) Tiam1 WT and Tiam1 K724R LoVo cells were infected with NSD2 WT or control lentivirus, and these cells were plated on FITC-conjugated coated coverslips, immunofluorescence of FITC (green) and phalloidin (red) was observed and the FITC-gelatin degradation statistical results. (F) An in vivo liver metastatic model using indicated LoVo cells was set up (n = 5). All experiments were done in triplicate, and 3 independent experiments were performed. Representative images (Left); right, quantitative analysis of metastases on the liver (Right). All experiments were performed in triplicate at least three times. Results are presented as mean ± SD, **P < 0.01, ***P < 0.001, and ****P < 0.0001.
Fig. 6.
Fig. 6.
Increased Tiam1 K724 methylation predicts poor survival. (A, B, and C) Quantitative IHC staining score showing relationships among NSD2, Tiam1 K724 methylation, and PAK1 phosphorylation. (D) Scatter plot showing the IHC staining score for NSD2, Tiam1 K724 methylation, and PAK1 phosphorylation in CRC (n = 79). The P-value and r-value were calculated using the Spearman r test. (E) IHC staining for Tiam1K724me2,3 in paired control colonic mucosa and primary tumor tissues of CRC (n = 79). (F) Histogram of IHC staining score for Tiam1 K724 methylation across different N stages using microarray analysis of CRC specimens (n = 80). (G) Histogram of IHC staining score for Tiam1 K724 methylation across different M stages based on microarray of CRC specimens (n = 80). (H) Histogram of Tiam1 K724 methylation IHC staining score comparing different clinical oncology stages using microarray of colon cancer specimen (n = 80). (I) Kaplan–Meier survival analysis comparing high and low levels of Tiam1K724me2,3 using microarray of CRC specimens (n = 80). Results are presented as mean ± SD, *P < 0.05 and ****P < 0.0001.
Fig. 7.
Fig. 7.
Pharmacological blocking of Tiam1 K724 methylation inhibits Rac1 signaling activation and cancer metastasis. (A) The amino sequence of designed inhibitory peptide and control peptide conjugated with a TAT sequence were synthesized. (B) HEK293T cells were transfected with Flag-Tiam1 and incubated with different concentrations of TAT-Inh (0, 5, and 10 µg/mL) for 36 h, and WCE was collected for qIP assay. (C). HEK293T cells were transfected with HA-NSD2 and incubated with different concentrations of TAT-Inh (0, 5, and 10 µg/mL) for 36 h, and WCE was collected for Rac1 activation assay. (D and E) Immunofluorescence of invadopodia marks in SW480 cells treated with TAT-Inh or TAT-NC (10 µg/mL, 36 h) and the statistical results. (F and G). LoVo cells incubated with TAT-NC or TAT-Inh (10 µg/mL) for 36 h were plated on FITC-conjugated coated coverslips, immunofluorescence of FITC (green) and phalloidin (red) was observed, and the FITC-gelatin degradation was statistically calculated. (H) In vivo liver metastatic model using LoVo cells was set up (n = 5), and TAT-NC and TAT-Inh were used as mentioned in the Materials and Methods. PET/CT images (Up); representative statistical results (Down). (I) The working model of NSD2-mediated Tiam1 K724 methylation cross-talking growth factor-induced Rac1 signaling activation. All experiments were performed in triplicate at least three times. Results are presented as mean ± SD, **P < 0.01, ***P < 0.001, and ****P < 0.0001.

References

    1. Bray F., et al. , Global cancer statistics 2018: GLOBOCAN estimates of incidence and mortality worldwide for 36 cancers in 185 countries. CA Cancer J. Clin. 68, 394–424 (2018). - PubMed
    1. Chen W., et al. , Cancer statistics in China, 2015. CA Cancer J. Clin. 66, 115–132 (2016). - PubMed
    1. Siegel R. L., Miller K. D., Jemal A., Cancer statistics, 2020. CA Cancer J. Clin. 70, 7–30 (2020). - PubMed
    1. Douillard J. Y., et al. , Panitumumab-FOLFOX4 treatment and RAS mutations in colorectal cancer. N. Engl. J. Med. 369, 1023–1034 (2013). - PubMed
    1. Venook A. P., et al. , Effect of first-line chemotherapy combined with cetuximab or bevacizumab on overall survival in patients with KRAS wild-type advanced or metastatic colorectal cancer: A randomized clinical trial. JAMA 317, 2392–2401 (2017). - PMC - PubMed

Publication types

MeSH terms

Substances