. 2024 Mar;11(11):e2308478.
doi: 10.1002/advs.202308478. Epub 2023 Dec 19.

Engineering Sensory Ganglion Multicellular System to Model Tissue Nerve Ingrowth

Affiliations

Engineering Sensory Ganglion Multicellular System to Model Tissue Nerve Ingrowth

Junxuan Ma et al. Adv Sci (Weinh). 2024 Mar.

Abstract

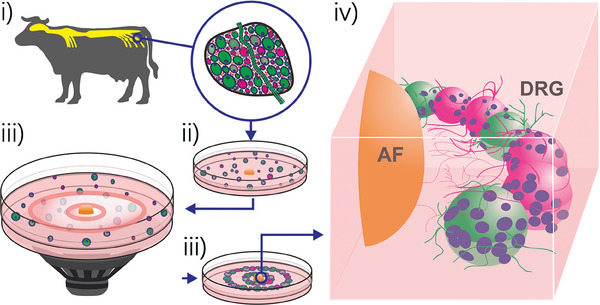
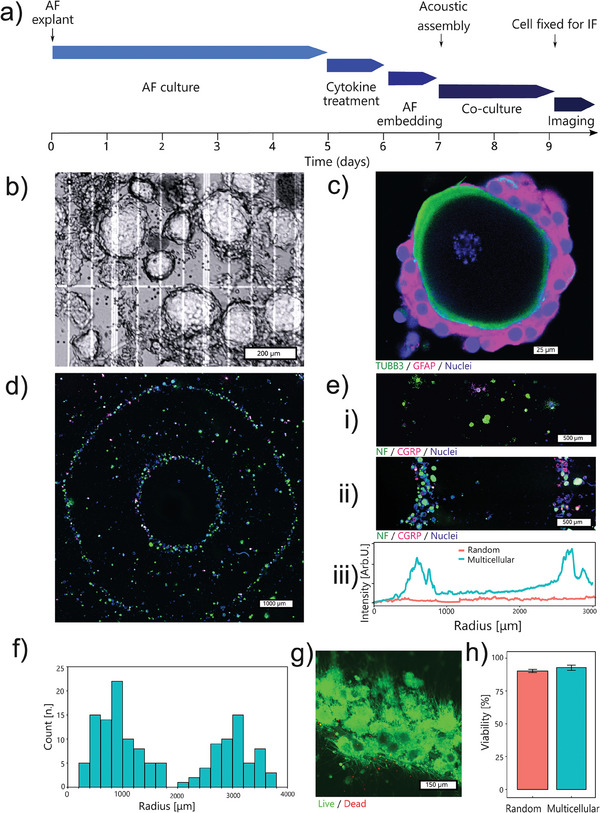
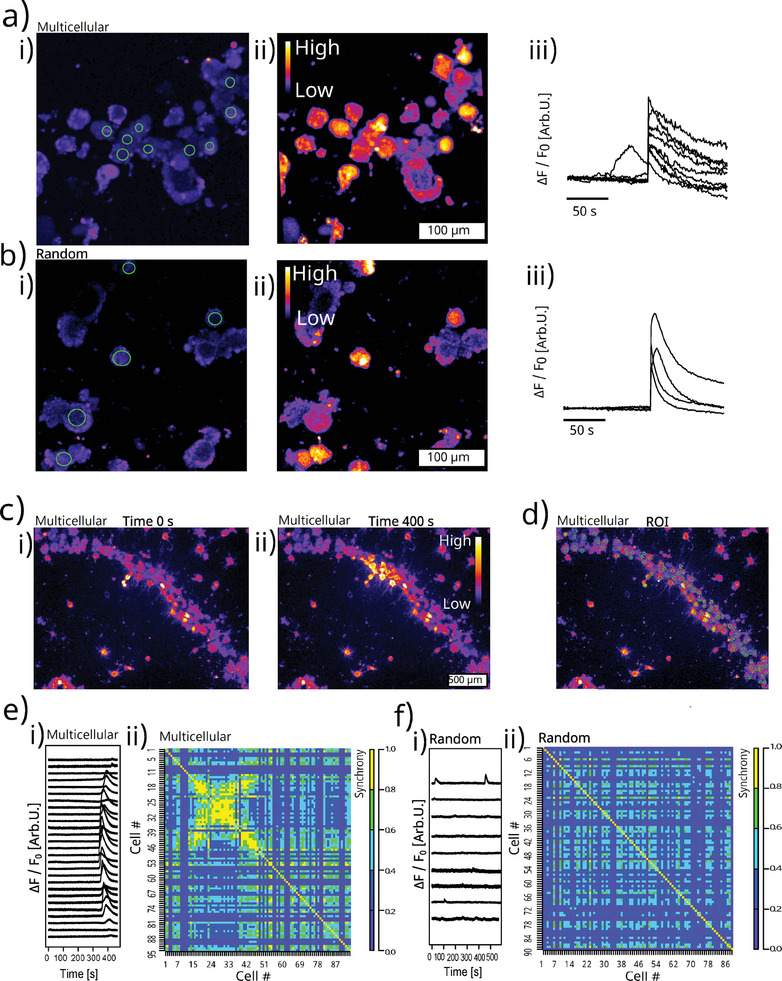
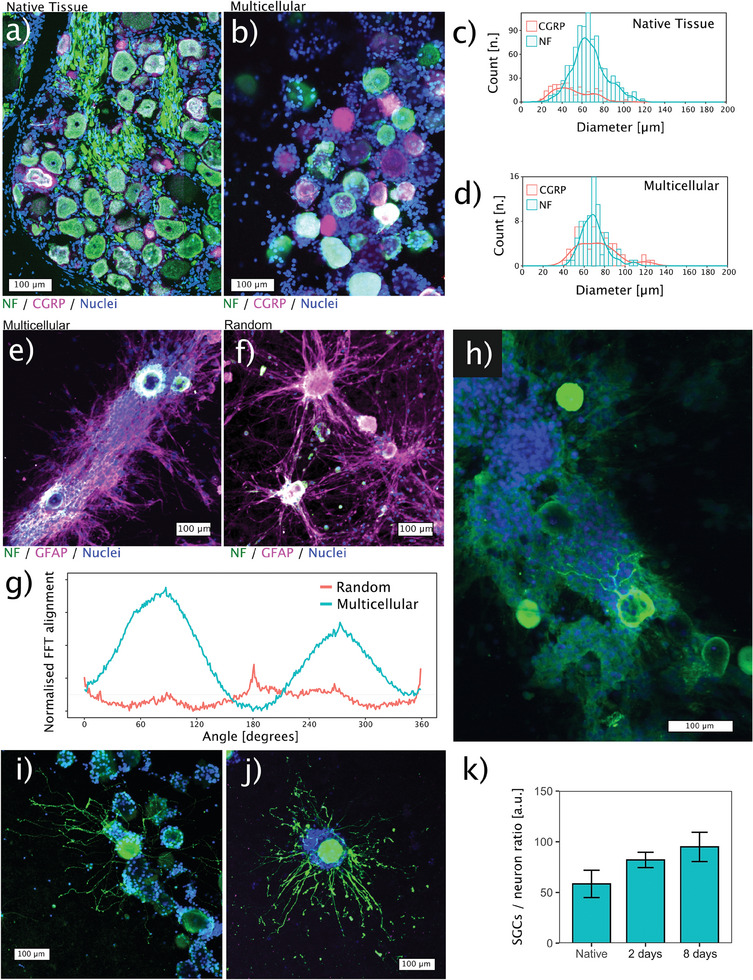
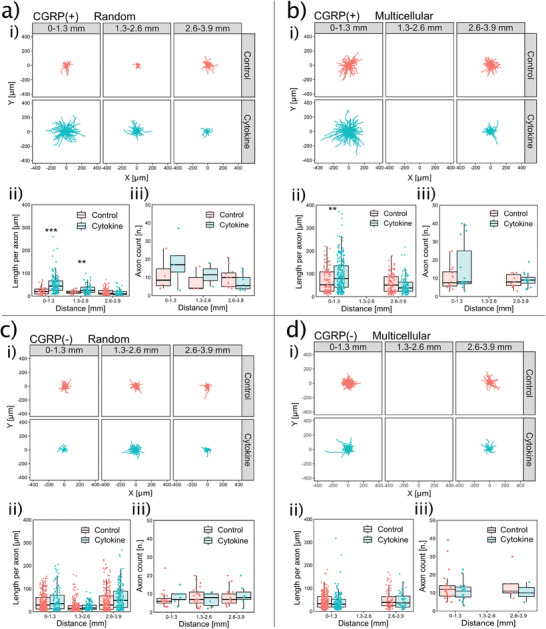
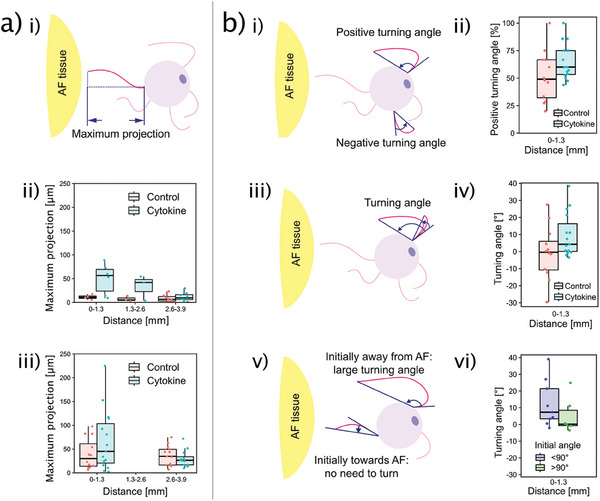
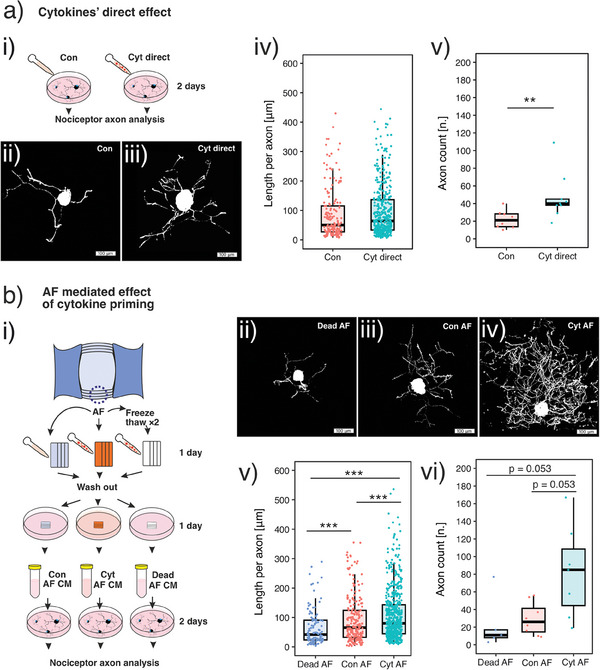
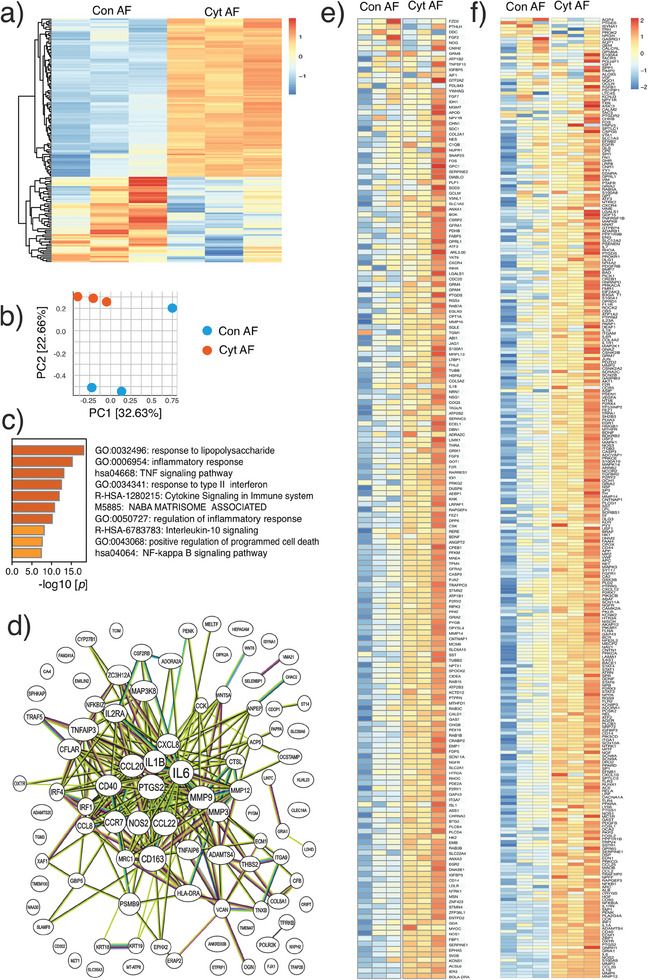
Discogenic pain is associated with deep nerve ingrowth in annulus fibrosus tissue (AF) of intervertebral disc (IVD). To model AF nerve ingrowth, primary bovine dorsal root ganglion (DRG) micro-scale tissue units are spatially organised around an AF explant by mild hydrodynamic forces within a collagen matrix. This results in a densely packed multicellular system mimicking the native DRG tissue morphology and a controlled AF-neuron distance. Such a multicellular organisation is essential to evolve populational-level cellular functions and in vivo-like morphologies. Pro-inflammatory cytokine-primed AF demonstrates its neurotrophic and neurotropic effects on nociceptor axons. Both effects are dependent on the AF-neuron distance underpinning the role of recapitulating inter-tissue/organ anatomical proximity when investigating their crosstalk. This is the first in vitro model studying AF nerve ingrowth by engineering mature and large animal tissues in a morphologically and physiologically relevant environment. The new approach can be used to biofabricate multi-tissue/organ models for untangling pathophysiological conditions and develop novel therapies.

Keywords: acoustic assembly; advanced in vitro models; alternatives to animal testing; multicellular system; sensory nerve ingrowth.


Conflict of interest statement

The authors declare no conflict of interest.

Figures

Figure 1
Figure 1
Schematic representation of the experimental approach used to engineer the sensory ganglion multicellular system. Bovine DRG i) is disintegrated into micro‐scale tissue units ii) and assembled iii) in ring‐shaped multicellular systems surrounding the annulus fibrosus (AF) explant iv).
Figure 2
Figure 2
Establishment of the in vitro model to study the AF nerve ingrowth. a) Experimental timeline. b) Phase contrast image of enzymatically dissociated bovine DRG micro‐scale tissue units (trypan blue staining). c) The mild enzymatic procedure preserves the envelope structure of native DRG tissue where neurons stained by tubulin beta 3 class III (TUBB3) are attached by satellite glial cells stained by glial fibrillary acidic protein (GFAP). d,e) Hydrodynamic forces assemble DRG micro‐scale tissue units from a random spatial distribution (i) to a well‐defined geometry (ii and iii). f) This assembly process leads to defined neurons‐AF distances. g,h) The assembly procedure is mild. Viability of the assembled multicellular structure remains above 90% after 2 days of culture. Viability data is presented as mean ± standard error in the bar plot. n = 3 replicates per group.
Figure 3
Figure 3
Calcium signal evaluation. a,b) Calcium imaging shows that neurons are functional when depolarised by 50 mM potassium chloride at day 2. c) Neurons in the multicellular system evolve a functional crosstalk after 4 days of culture. The calcium signal is transmitted from one cell to its neighbours only in the multicellular system. The colour scale of a–c) are ΔF / F0. d) The region of interest (ROI) of the tissue units. e,f) The multicellular system (e) displays higher synchrony of calcium signal in the tissue units than in its random counterpart f). (i) in (e,f): Normalised calcium fluorescent curves. Only tissue units with spontaneous calcium signals are presented. (ii) in (e,f): The synchrony matrix.
Figure 4
Figure 4
Morphology of the assembled multicellular system. Immunofluorescence staining of the native tissue a) and the assembled multicellular system b) closely recapitulates the tight cell‐to‐cell contact of the native DRG. Soma diameters are comparable between the multicellular assembly c) and the native bovine DRG tissue d). The multicellular assembly shows anisotropic cell self‐organisation e), whereas in the random culture, the self‐organisation of satellite glial cells appears to be limited on day 8 f), as evidenced by the quantification using 2D‐Fast Fourier transformation (FFT) alignment g). The self‐organised structure provides a guidance for axonal growth h). Axons sprouting in the collagen matrix in both the multicellular system i) and the random culture j) after 2 days of culture. k) The counting ratios of glia to neurons in the multicellular system at day 2 and day 8 are compared with native tissue. Data is presented as mean ± standard error in the bar plot. n = 3 replicates per group.
Figure 5
Figure 5
Effect of cytokine‐primed AF explant on axonal length and count depends on the AF‐neuron distance. Axonal morphologies are shown as a function of the distance from the AF explant in a–d (i). CGRP(+) axons in both random culture a) and multicellular system b) show a distance‐dependent increased length (ii) and count (iii) when exposed to a cytokine‐primed AF explant. CGRP(‐) axons do not show any distance‐dependent difference in length (i) or count (ii) in either random culture c) nor multicellular system d). Data is presented as boxplot which presents the interquartile range of data distribution. **: p < 0.01, ***: p < 0.001 by 2‐sided Wilcoxon signed‐rank test. n = 445, 647, 1150, and 700 axons in (ii) of (a–d), respectively. n = 51, 61, 85, and 48 neurons in (iii) of (a–d), respectively.
Figure 6
Figure 6
Effect of the cytokine‐primed AF explant on CGRP (+) axonal guidance. a) Schematic depiction illustrating the “maximum projection length” (i). Axons show a distance‐dependent “maximum projection length” in both random culture (ii) and multicellular system (iii). b) Turning angle of axons. (i) “Positive” and “negative” turning angles. (ii) A higher proportion of axons per neuron turn toward the cytokine‐primed AF explant, but not toward the non‐cytokine‐primed AF. iii) Illustration showing that larger turning angle corresponds to a larger AF guidance. (iv) Cytokine‐primed AF explant induces a larger turning angle than the control. As illustrated in (v) and quantitatively shown in (vi), the guidance on axons results in a larger turning angle only when axons initially sprout in the opposite direction in respect to AF (initial angle < 90°). Data is presented as boxplot which presents the interquartile range of data distribution. n = 27 neurons in (ii and iv) of (b). n = 15 neurons in (b‐vi).
Figure 7
Figure 7
Neurotrophic effect of AF explant is mediated by viable AF explant. Schematics of the study design are presented in (a‐i) and (b‐i), respectively. a) Direct neurotrophic effect of cytokines. Cytokines directly increase CGRP(+) axon length and frequency. b) Neurotrophic effect of cytokine‐primed AF. Viable AF primed by cytokines (Cyt AF) increases CGRP(+) axon length and frequency (i.e., the neurotrophic effect) compared to non‐primed AF (Con AF). Dead AF's conditioned medium (Dead AF) shows no neurotrophic effect, although they are processed by the same cytokine priming. This excludes the possibility that the unwashed cytokines confound the result. Data is presented as boxplot which presents the interquartile range of data distribution. In (a‐v), **: p < 0.01 by 2‐sided Wilcoxon signed‐rank test, n = 17 neurons. In (b‐v), ***: p < 0.001 by 2‐sided Wilcoxon signed‐rank test, n = 927 axons. In (b‐vi), p value is calculated using 2‐sided Wilcoxon signed‐rank test, n = 20 neurons.
Figure 8
Figure 8
Bulk RNA sequencing of bovine DRG cells. The effect of cytokine‐primed AF (Cyt AF) is compared to non‐primed AF (Con AF). a) Heatmap summarising the differentially expressed genes (DEGs). b) Principal component analysis (PCA) showing the separation of Cyt AF and Con AF groups. c) The top regulated GO terms determined by Metascape. d) Protein‐protein interaction analysis of DEGs. e,f) The expression levels of genes associated with neurite outgrowth e) and pain f).
Figure 9
Figure 9
Calcium signals of bovine DRG neurons. CGRP(+) and CGRP(‐) subtypes of neurons are labelled using immunofluorescence following calcium imaging. The effect of cytokine‐primed AF conditioned medium (CM) (Cyt AF) is compared with non‐primed AF CM (Con AF). To exclude dead neurons in the analysis, neurons without a response to potassium chloride (KCl) are excluded. a) Spontaneous calcium transients are represented as normalised fluorescent peaks. b) The spontaneous calcium peak height is consistent comparing different neuronal subtypes and treatment groups. c) The cytokine‐primed AF increases the frequency of spontaneous calcium response in CGRP(+) neurons (i), but not in CGRP(‐) neurons (ii). d) The capsaicin‐induced (100 nm) calcium response in both CGRP(+) and CGRP(‐) neurons. e,f) The capsaicin‐induced calcium response is not different in CGRP(+) nociceptors between Con AF (e‐i) and Cyt AF (e‐ii) groups. g,h) Cytokine‐primed AF CM (g‐i) increases capsaicin induced calcium response in CGRP(‐) neurons compared to the non‐primed AF CM (g‐ii). e) and g) are mean normalised fluorescent curves among different neurons. Blue straps are their standard deviation. Data is presented as boxplot which presents the interquartile range of data distribution. For (c‐i), *: p < 0.05 by 2‐sided Wilcoxon rank sum test; n = 90 CGRP(+) neurons and n = 161 CGRP(‐) neurons.

References

    1. Madsen J. E., Hukkanen M., Aune A. K., Basran I., Moller J. F., Polak J. M., Nordsletten L., Clin. Orthop. Relat. Res. 1998, 351, 230. - PubMed
    1. Ackermann P. W., Franklin S. L., Dean B. J. F., Carr A. J., Salo P. T., Hart D. A., Front. Biosci. FRONT BIOSCI‐LANDMRK 2014, 19, 1251. - PubMed
    1. Mapp P. I., Walsh D. A., Nat. Rev. Rheumatol. 2012, 8, 390. - PubMed
    1. a) Peng B., Hao J., Hou S., Wu W., Jiang D., Fu X., Yang Y., Spine 2006, 31, 560; - PubMed
    2. b) Peng B., Wu W., Hou S., Li P., Zhang C., Yang Y., Journal of Bone & Joint Surgery, British Volume 2005, 87‐B (1), 62; - PubMed
    3. c) Johnson W. E., Evans H., Menage J., Eisenstein S. M., El Haj A., Roberts S., Spine 2001, 26, 2550. - PubMed
    1. Chartier S. R., Thompson M. L., Longo G., Fealk M. N., Majuta L. A., Mantyh P. W., Pain 2014, 155, 2323. - PMC - PubMed

Grants and funding

LinkOut - more resources