. 2023 Dec 19;16(816):eadh3449.
doi: 10.1126/scisignal.adh3449. Epub 2023 Dec 19.

A noncanonical IRAK4-IRAK1 pathway counters DNA damage-induced apoptosis independently of TLR/IL-1R signaling

Affiliations

A noncanonical IRAK4-IRAK1 pathway counters DNA damage-induced apoptosis independently of TLR/IL-1R signaling

Yuanyuan Li et al. Sci Signal. .

Abstract

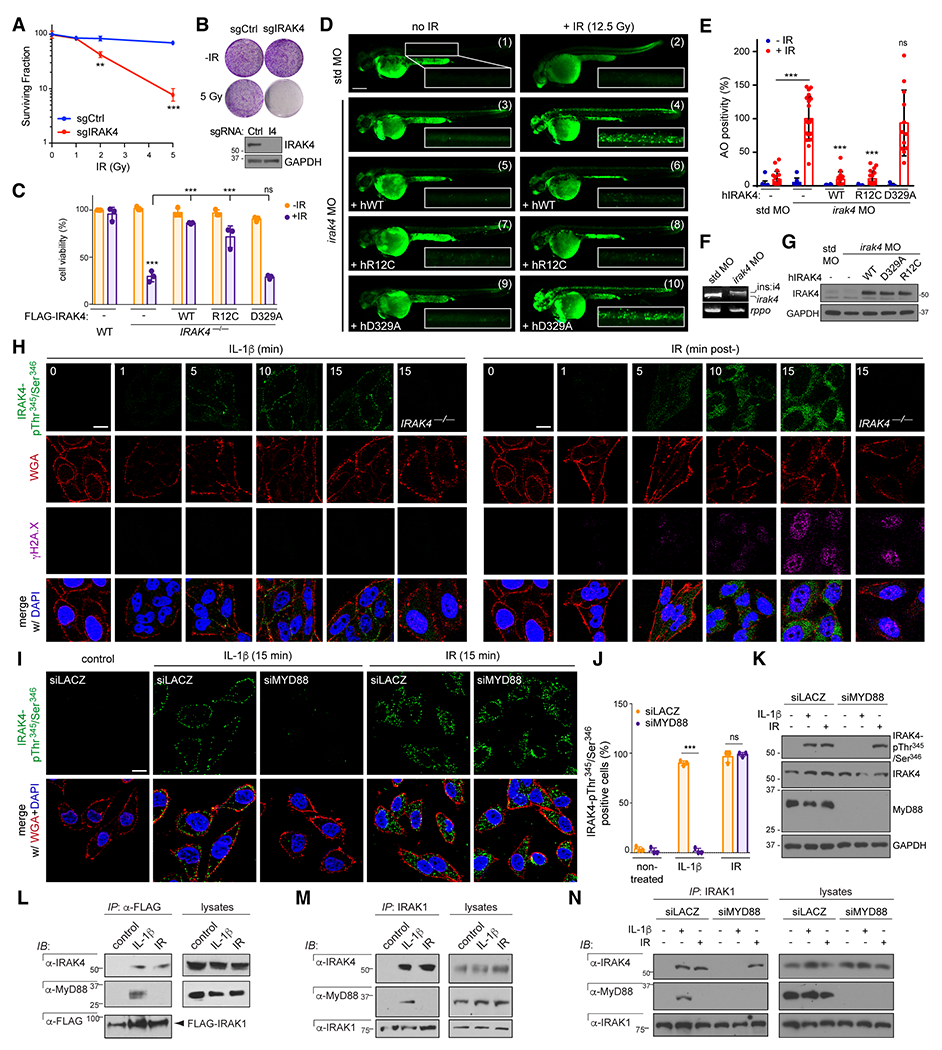
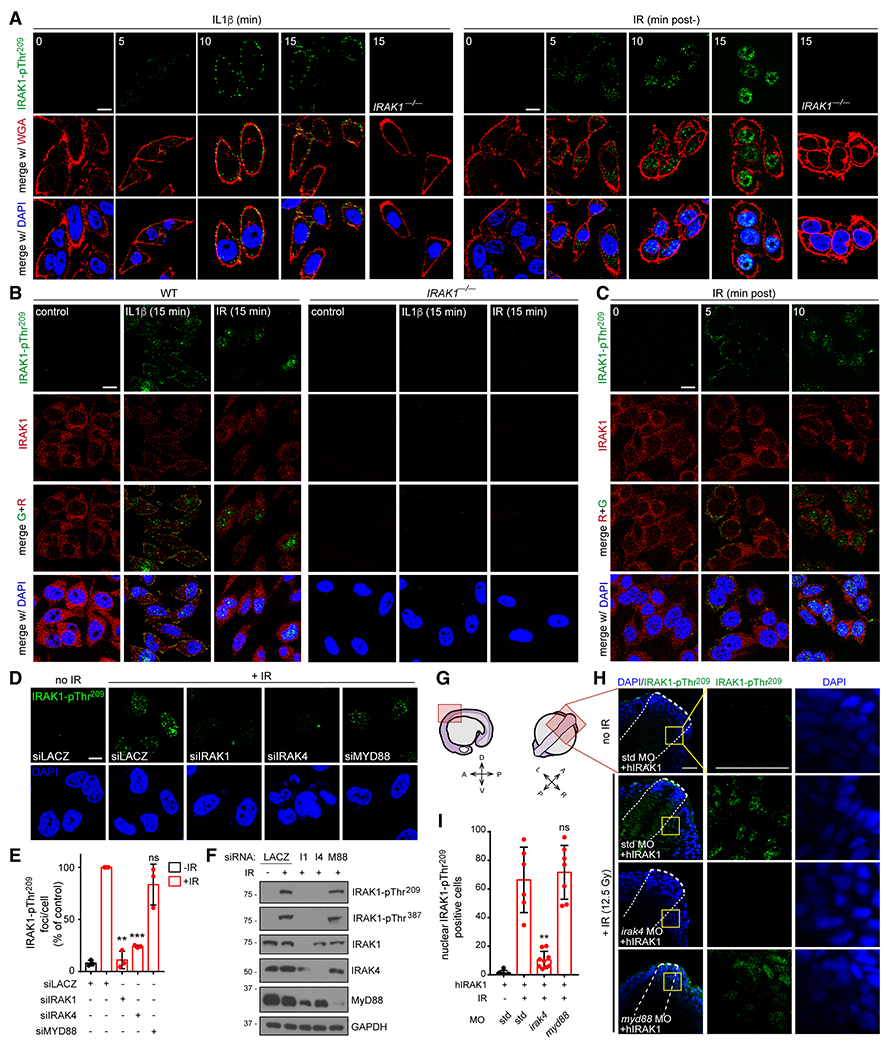
Interleukin-1 receptor (IL-1R)-associated kinases (IRAKs) are core effectors of Toll-like receptors (TLRs) and IL-1R in innate immunity. Here, we found that IRAK4 and IRAK1 together inhibited DNA damage-induced cell death independently of TLR or IL-1R signaling. In human cancer cells, IRAK4 was activated downstream of ATR kinase in response to double-strand breaks (DSBs) induced by ionizing radiation (IR). Activated IRAK4 then formed a complex with and activated IRAK1. The formation of this complex required the E3 ubiquitin ligase Pellino1, acting structurally but not catalytically, and the activation of IRAK1 occurred independently of extracellular signaling, intracellular TLRs, and the TLR/IL-1R signaling adaptor MyD88. Activated IRAK1 translocated to the nucleus in a Pellino2-dependent manner. In the nucleus, IRAK1 bound to the PIDD1 subunit of the proapoptotic PIDDosome and interfered with platform assembly, thus supporting cell survival. This noncanonical IRAK signaling pathway was also activated in response to other DSB-inducing agents. The loss of IRAK4, of IRAK4 kinase activity, of either Pellino protein, or of the nuclear localization sequence in IRAK1 sensitized p53-mutant zebrafish to radiation. Thus, the findings may lead to strategies for overcoming tumor resistance to conventional cancer treatments.


Conflict of interest statement

Competing Interests: The authors declare that they have no competing interests.

Figures

Fig. 1.
Fig. 1.. IRAK4 associates with IRAK1 and is required for cell survival after IR in a MyD88-independent manner.
(A and B) Parent and IRAK4−/− HeLa cells were treated with indicated doses of X-IR (IR) and colonies were counted (A) and imaged (B) at 12 days post-IR. Western blot verifying IRAK4 knockout shown in (B). (C) Parent and IRAK4−/− cells reconstituted with indicated FLAG-IRAK4 constructs were treated with or without IR (7.5 Gy). Cells were stained with alamarBlue 72 hours after IR. Expression levels of FLAG-IRAK4 variants are shown in fig. S1C. (D and E) p53MK/MK zebrafish embryos were co-injected at the 1-cell stage with the indicated MOs with or without synthetic mRNAs for the indicated human (h) FLAG-IRAK4 variants. Embryos were treated with or without whole-body IR (12.5 Gy) 18 hours later and stained with acridine orange (AO) at 24 hours after IR to label apoptotic cells in vivo. Spinal cord areas dorsal to the yolk tube (boxed) were quantified (E) from at least n = 6 embryos per condition over 3 independent experiments. Data are means ± SEM, *p < 0.05, **p < 0.01, ***p < 0.001, two-tailed Student’s t-test. Scale bar, 0.2 mm. (F) mRNA extracts from embryos injected with indicated MOs were analyzed by RT-PCR. irak4 MO targets the exon4/intron4 splice junction, resulting in the retention of intron 4 (199 bp), as verified by sequencing. (G) Pooled whole-embryo extracts from (D) analyzed by western blot. (H) HeLa cells were treated with IL-1β (0.1 μg/mL; left) or IR (7.5 Gy; right), fixed at indicated time points (min), stained with indicated antibodies, and co-stained with membrane marker wheat germ agglutinin (WGA) and nuclear marker DAPI. Confocal images representative of at least 80 cells per condition over n = 3 independent experiments. Scale bar, 5 μm. (I and J) HeLa cells transfected with indicated siRNA were treated with or without IL-1β (0.1 μg/mL) or IR (7.5 Gy) and fixed at 15 min. Confocal images representative of at least 80 cells per condition over n = 3 independent experiments (H) were quantified in (I). Single channels shown in fig. S1D. Scale bar, 5 μm. (K) Whole-cell lysates from cells in (I) were analyzed by western blot. (L and M) FLAG-IRAK1-transfected (L) or non-transfected (M) HeLa cells were treated with or without IL-1β (0.1 μg/mL) or IR (7.5 Gy) and lysed at 15 min. FLAG (L) or endogenous IRAK1 (M) immunoprecipitates were analyzed by western blot. IP, immunoprecipitate; IB, immunoblot. (N) HeLa cells transfected with the indicated siRNAs were treated with or without IL-1β (0.1 μg/mL) or IR (7.5 Gy) and lysed at 15 min. IRAK1 immunoprecipitates were analyzed by western blot. All blots (F, K-N) are representative of at least n = 2 independent experiments. Data in (A, C and J) are means ± SD of n = 3 independent experiments with **p < 0.01 and ***p < 0.001, two-tailed Student’s t-test.
Fig. 2.
Fig. 2.. Active IRAK1 accumulates in the nucleus of irradiated cells in an IRAK4-dependent but MyD88-independent manner
(A-C) Parental and IRAK1−/− HeLa cells were treated with IL-1β (0.1 μg/mL) or IR (7.5 Gy), fixed at indicated time points (min), stained with indicated antibodies and imaged by confocal microscopy. (D-F) HeLa cells transfected with indicated siRNA were treated with or without IR (7.5 Gy), fixed at 15 min, and stained with IRAK1pThr209 antibody (D; quantified in (E)) or analyzed by western blot (F). I1, IRAK1; I4, IRAK4; M88, MYD88. Data in (E) are means ± SD of 3 independent experiments. Statistical significance vs. bar 2: **p<0.01, ***p < 0.001; two-tailed Student’s t-test. (G) Schematic of lateral and dorsal views of the 18-hour zebrafish embryo, with imaged area (see H) boxed in pink. A, anterior; P, posterior; V, ventral; D, dorsal; L, left; R, right. (H and I) p53MK/MK embryos were co-injected at the 1-cell stage with the indicated MOs with or without synthetic mRNA encoding human FLAG-IRAK1 (hIRAK1) to detect IRAK1-pThr209 in vivo (std, standard control MO). 18 hours later, embryos were (or were not) whole-body exposed to IR (12.5 Gy), fixed 15 min later and stained as whole-mounts with IRAK1-pThr209 antibody (which does not cross-react with zebrafish Irak1) and DAPI. Higher-magnification images of the boxed areas shown to the right were used for quantification shown in (I). Anterior and spinal cord areas delineated by thick and thin dashed lines, respectively. Scale bar, 40 μm. (I) Quantification of spinal cord areas (such as boxed in (H)) of at least n = 6 embryos per condition over 3 independent experiments. Data are means +/− SEM, statistical significance vs. bar 2: **p < 0.01, two-tailed Student’s t-test. Confocal images in (A-D) and blots in (F) representative of n = 3 independent experiments, with at least 80 cells analyzed per condition in (A-D). Scale bars in (A-D), 5 μm.
Fig. 3.
Fig. 3.. IRAK1 autophosphorylates in the nucleus of irradiated cells and relocates to nucleoli as a fully active kinase
(A-H) IRAK1−/− HeLa cells reconstituted with indicated FLAG-IRAK1 constructs were treated ± IR (7.5 Gy), fixed 15 min after and stained with IRAK1-pThr387 antibody. (I) Quantification of stains such as in (A-H). Data are means ± SD of at least 80 cells analyzed per condition over n = 3 independent experiments. **p < 0.005, ***p < 0.001 ns, non-significant, by two-tailed Student’s t-test. (J) HeLa cells were treated with or without IR (7.5 Gy), fixed at indicated time points (min), stained with IRAK1-pThr387 antibody and co-stained with WGA and DAPI. Higher-magnification images of the boxed areas are also shown. (K) HeLa cells treated as above stained with antibodies to nucleolin (NCL) and IRAK1-pThr387 (top) and IRAK1-pThr209 (bottom). Images are close-ups of boxed areas in fig. S3C. (L) Quantification of images as shown in (J). Data are means +/− SD of 3 independent experiments with at least 80 cells analyzed per condition. **p < 0.05, **p < 0.005, ns, non-significant, by two-tailed Student’s t-test. (M) Zebrafish p53MK/MK embryos were co-injected at the 1 cell stage with the indicated MOs ± synthetic mRNAs for the indicated human FLAG-IRAK1 variants. Embryos were treated with or without whole-body IR (12.5 Gy) 18 hours later and stained with acridine orange (AO) at 24 hours after IR to label apoptotic cells in vivo. Spinal cord areas dorsal to the yolk tube (boxed in each panel) were used for quantification shown in (N). Scale bar, 0.2 mm. (N) Quantification of spinal cord areas (such as boxed in (M)) of at least n = 6 embryos per condition over at least 3 independent experiments. Data are means +/− SEM. Statistical significance vs. bars 2, 4 or 6: *p < 0.05, **p < 0.01, ***p < 0.001, by two-tailed Student’s t-test. Confocal images in (A-K) representative of n = 3 independent experiments. Scale bars, 10 μm.
Fig. 4.
Fig. 4.. Nuclear internalization of active IRAK1 enables PIDDosome inhibition and is essential for IR-induced IRAK1 signaling.
(A) Identification of a conserved putative NLS, Arg503-RAKR-Arg508, at the distal end of the IRAK1 kinase domain. DD, death domain; ProST, Pro/Ser/Thr -rich domain; ST kinase, Ser/Thr kinase; C1 and C2, C-terminal regions 1 and 2. (B) IRAK1−/− HeLa cells reconstituted with indicated FLAG-IRAK1 constructs were treated with IR (7.5 Gy), fixed 15 min later, and stained as indicated. Images are representative of at least 80 cells per condition over n = 3 independent experiments, quantified in (C). R4A, RRAKRR → AAAKAA. See fig. S4C–D for expression levels of FLAG-IRAK1 variants and non-irradiated and parental controls. (C) Quantification of signals from n = 3 independent experiments such as in (B). (D) Cells from (B) were analyzed by western blot. (E) Zebrafish p53MK/MK embryos were co-injected at the 1-cell stage with the indicated MOs with or without synthetic mRNAs for the indicated human (h) FLAG-IRAK1 variants. Embryos were treated with or without whole-body IR (12.5 Gy) 18 hours later and stained with acridine orange (AO) at 24 hours after IR to label apoptotic cells. Spinal cord areas dorsal to the yolk tube (boxed in each panel) were used for quantification shown in (F). Scale bar, 0.2 mm. (F) Quantification of spinal cord areas (such as boxed in (E)) of at least n = 6 embryos per condition over 3 independent experiments, with data expressed as means +/− SEM, *p < 0.05, **p < 0.01, by two-tailed Student’s t-test. (G) Pooled whole-embryo extracts from (E-F) analyzed by western blot. The human IRAK1 antibody does not detect endogenous zebrafish Irak1. (H and I) IRAK1−/− HeLa cells (H) and Daoy cells (I) reconstituted with indicated FLAG-IRAK1 constructs were treated ± IR (7.5 Gy) and stained with the vital dye alamarBlue 72 hours after IR. (J) Cells from (I) were lysed and analyzed by western blot. (K) SV40 MEF of indicated genotypes were treated with or without IR (7.5 Gy) and IRAK1 inhibitor pacritinib (0.1 μM) (see fig. S4I), harvested at 36 hours after IR and analyzed by western blot. P1, Pidd1; R, Raidd; proC2, procaspase-2; cl.C2, cleaved C2 (p19); proC3, procaspase-3; cl.C3, cleaved C3; PIDD1-CC, C-terminal double autocleavage product and subunit of the pro-apoptotic PIDDosome. (L and M) C2.Pro-BiFC HeLa cells (see fig. S4E–F) were transfected with indicated siRNA ± indicated FLAG-IRAK1 variants, treated with or without IR (10 Gy) and scored for nucleolar C2 BiFC 24 hours after IR. Arrowheads in (L) mark nucleolar C2 BiFC signals. Images representative of at least 80 cells per condition over n = 3 independent experiments. (N to U) HeLa cells of indicated genotypes (N-O, Q-U)) or stably expressing shPIDD1 (P), transfected with indicated FLAG-tagged constructs (P,Q,S), and treated as indicated with IR (7.5 Gy), IRAK1i pacritinib (pac, 0.1 μM, (S)) or IL-1β (0.1 μg/mL, (U)), were harvested at the indicated time points (O,R,U) or at 24 hours (N, T) or 6 hours (Q, S) after IR, or at 24 hours after transfection (P). Whole-cell lysates were directly analyzed by western blot (N) or immunoprecipitated with the indicated antibodies prior to NU-PAGE analysis (O-U). All blots are representative of at least n = 2 independent experiments. Data in (H, I and M) are means ± SD of n = 3 independent experiments, and ***p < 0.001 by two-tailed Student’s t-test. Scales bars in (B and L), 5 μm.
Fig. 5.
Fig. 5.. Non-canonical IRAK1 signaling is a DNA damage response
(A) Schematic of the medium-transfer experiments performed. (B and C) HeLa cells treated as shown in (A) were stained with IRAK1-pThr209 antibody and DAPI, imaged by confocal microscopy (B), and quantified (C). (D) Parental and IRAK1−/− HeLa cells treated with indicated genotoxins were stained with the vital dye alamarBlue 72 hours after treatment. (E) HeLa cells treated with the indicated genotoxins were fixed after 6 hours and stained with the indicated antibodies and DAPI. TOPO, topotecan (1 μM); CPT, camptothecin (1 μM); APH, aphidicolin (0.2 mM). See fig. S5E–G for the full time course. (F) Cells double-positive for γH2A.X and IRAK1-pThr209 were counted from n = 3 independent experiments such as shown in (E). (G) The percentages of γH2A.X+ cells positive for IRAK1-pThr209 (left), and vice versa (right), were counted as above. (H) Intensity of IRAK1-pThr7209 (G) signals relative to that of γH2A.X (R) in individual cells from (E) after treatment with TOPO (left) or CPT (right). (I) Percentages of γH2A.X+ foci positive for IRAK1pT209 (left), and vice versa (right), were counted from n = 3 independent experiments as in (E). (J) Pearson’s coefficient derived from image analyses in (I). (K) RFP-PCNA (top) and RFP-Ku80 (bottom) -expressing SV40 mouse embryonic fibroblasts (MEF) exposed to two photon laser micro-irradiation were stained with IRAK1-pThr209 antibody 15 min after treatment. DNA damage tracks indicated with arrowheads. Number of cells showing staining overlap between IRAK1-pThr209 and RFP-PCNA tracks (over n = 3 independent experiments) or RFP-Ku80 tracks or foci (over n = 2 independent experiments) are indicated. See fig. S5J for RFP-Ku80 foci. (L) HeLa cells exposed to the indicated kinase inhibitors were treated with or without IR (7.5 Gy), fixed at 15 min and stained for IRAK1-pThr209 antibody and DAPI. KU55933, ATMi (10 μM); ETP46464, ATRi (10 μM); NU7441, DNA-PKi (5 μM). (M) Quantification of stains from experiments as in (L). (N) HeLa cells transfected with indicated siRNA were treated with or without IR (7.5 Gy), fixed at 15 min and stained for IRAK1-pThr209 antibody and DAPI. (O) Quantification of IRAK1-pThr209 stains from experiments as in (N). (P) Whole cell lysates from cells as in (N) were analyzed by western blot. Confocal images in (B, E, L and N) and blots in (P) representative of n = 3 independent experiments, and data in (C, D, M and O) reported as means ± SD of 3 independent experiments, *p < 0.05, **p < 0.005, ***p < 0.001, two-tailed Student’s t-test. Scale bars, 5 μm. Confocal images in (B, E, K, L and N) are representative of at least 80 cells per condition over n = 3 independent experiments.
Fig. 6.
Fig. 6.. Essential and distinct roles of Peli1 and Peli2 in non-canonical IRAK1 signaling.
(A and B) Parent, PELI1−/− and PELI2−/− HeLa cells were treated with or without IR (7.5 Gy) or IL-1β (0.1 μg/mL), fixed at 15 min, stained as indicated (A), and signals were spatially quantified (B). (C) Parent, PELI1−/− (P1−/−) and PELI2−/− (P2−/−) cells reconstituted with indicated GFP-Peli constructs were treated with or without IR (7.5 Gy), fixed at 15 min, stained as indicated and additionally analyzed for GFP (green) by confocal microscopy. (D and E) Parent, PELI1−/− and PELI2−/− cells were treated with or without IR (7.5 Gy), fixed at 15 min, stained as indicated (D) and signals were quantified (E). (F) Whole-cell lysates from experiments as in (D) were analyzed by western blot. (G and H) C2.Pro-BiFC HeLa cells transfected with indicated siRNA were treated ± IR (7.5 Gy) and fixed at 24 hours after IR. Arrowheads mark nucleolar BiFC signals reflective of PIDDosome assembly (G), quantified in (H). (I) Parent, PELI1−/− and PELI2−/− cells were treated ± IR (7.5 Gy), fixed at 48 hours, and stained with antibody to active caspase-3 and DAPI. Representative images are shown in fig. S6D. (J) Cells as in (I) were stained with the vital dye alamarBlue 72 hours after IR. (K-N) Zebrafish p53MK/MK embryos were co-injected at the 1-cell stage with the indicated MOs with or without synthetic mRNA for corresponding human Peli (hPeli) proteins. Embryos were treated with or without whole-body IR (12.5 Gy) 18 hours later and stained with acridine orange (AO) to label apoptotic cells. Spinal cord areas dorsal to the yolk tube (boxed in each panel) were used for quantification, shown in (L and N). Scale bar, 0.2 mm. peli1b, zebrafish PELI1 ortholog, as based on Clustal Omega analysis (fig. S6E). At least n = 3 embryos per condition were analyzed in each of at least 2 independent experiments. Data are means +/− SEM, *p < 0.05, **p < 0.01, ***p < 0.001, two-tailed Student’s t-test. Data in (A, B, D, E, G, H, I and J) are representative of, and presented as means ± SD of, n = 3 independent experiments, with confocal images representative of at least 80 cells per condition; **p < 0.005; ***p < 0.001, by two-tailed Student’s t-test. Scale bars in (A, C, D and G), 5 μm.
Fig. 7.
Fig. 7.. Peli1 functionally substitutes for MyD88 in non-canonical IRAK1 signaling.
(A) Diagrams of full-length (FL) GFP-Peli1 and deletion constructs (54). FHA, forkhead-associated; RING-like, really interesting new gene-like (catalytic domain). See also fig. S7D. (B) Expression levels of GFP-Peli1 constructs depicted in (A) in reconstituted PELI1−/− cells as analyzed in (C-D). (C and D) Parent (WT) and PELI1−/− cells transfected with or without GFP-Peli1 constructs (see (A)) were treated with or without IR (7.5 Gy), fixed at 15 min and imaged by confocal microscopy (C), from which the percentage of cells with IRAK1-pThr209 signal-positive nuclei were quantified (D). Images are representative, and data are means ± SD of n = 3 independent experiments, with at least 80 cells analyzed per condition. Statistical significance vs. bar 4: ***p < 0.001; ns, non-significant; two-tailed Student’s t-test. (E) Parent, PELI1−/− and PELI2−/− cells were treated with or without IR (7.5 Gy), harvested at 15 min, immunoprecipitated with IRAK1 antibody and analyzed by western blot. (F) Hela cells were treated with or without IR (7.5 Gy) or IL-1β(0.1 μg/mL), harvested at indicated time points, immunoprecipitated with Peli1 antibody and analyzed by western blot. (G) Hela cells transfected with indicated siRNA were treated with or without IR (7.5 Gy) or IL-1β(0.1 μg/mL), harvested at 15 min, and Peli1 immunoprecipitates (top) and IRAK1-pThr209 immunoprecipitates (middle) were analyzed by western blot. (H) Parent, IRAK4−/− (I4−/−) and IRAK1−/− (I1−/−) cells were treated with or without IR (7.5 Gy), harvested at 15 min, and Peli1 immunoprecipitates were analyzed by western blot. (I) Cells of indicated genotypes were treated with or without IR (7.5 Gy), fixed at 15 min and stained with IRAK4-pThr345/Ser346 antibody and DAPI. Images are representative of at least 50 cells per condition over n = 2 independent experiments. (J) Cells as described in (I) were harvested at 15 min after IR and analyzed by western blot. (K) IRAK4−/− HeLa cells transfected with indicated FLAG-IRAK4 constructs were irradiated (7.5 Gy) and harvested at 10 min. Peli1 immunoprecipitates were analyzed by western blot. Blots in (B, E, F-H, J and K) are representative of at least n = 2 independent experiments. Scale bars in (C and I), 5 μm.
Fig. 8.
Fig. 8.. Two vertebrate IRAK signaling pathways.
Diagrams of the TLR/IL-1R innate immune pathway (canonical, left) and DSB-induced anti-apoptotic pathway (non-canonical, right) highlighting distinct transduction mechanisms and cellular dynamics upstream and downstream of the IRAK/IRAK1 core module. See text for details.

References

    1. Gay NJ, Keith FJ, Drosophila Toll and IL-1 receptor. Nature 351, 355–356 (1991). - PubMed
    1. Hashimoto C, Hudson KL, Anderson KV, The Toll gene of Drosophila, required for dorsal-ventral embryonic polarity, appears to encode a transmembrane protein. Cell 52, 269–279 (1988). - PubMed
    1. Nusslein-Volhard C, The Toll gene in Drosophila pattern formation. Trends Genet 38, 231–245 (2022). - PubMed
    1. Shelton CA, Wasserman SA, pelle encodes a protein kinase required to establish dorsoventral polarity in the Drosophila embryo. Cell 72, 515–525 (1993). - PubMed
    1. Lemaitre B, Nicolas E, Michaut L, Reichhart JM, Hoffmann JA, The dorsoventral regulatory gene cassette spatzle/Toll/cactus controls the potent antifungal response in Drosophila adults. Cell 86, 973–983 (1996). - PubMed

MeSH terms

Substances

LinkOut - more resources