. 2024 Mar 20;42(9):1077-1087.
doi: 10.1200/JCO.23.01115. Epub 2023 Dec 19.

Spatially Resolved Tumor Microenvironment Predicts Treatment Outcomes in Relapsed/Refractory Hodgkin Lymphoma

Affiliations

Spatially Resolved Tumor Microenvironment Predicts Treatment Outcomes in Relapsed/Refractory Hodgkin Lymphoma

Tomohiro Aoki et al. J Clin Oncol. .

Abstract

Purpose: About a third of patients with relapsed or refractory classic Hodgkin lymphoma (r/r CHL) succumb to their disease after high-dose chemotherapy followed by autologous stem-cell transplantation (HDC/ASCT). Here, we aimed to describe spatially resolved tumor microenvironment (TME) ecosystems to establish novel biomarkers associated with treatment failure in r/r CHL.

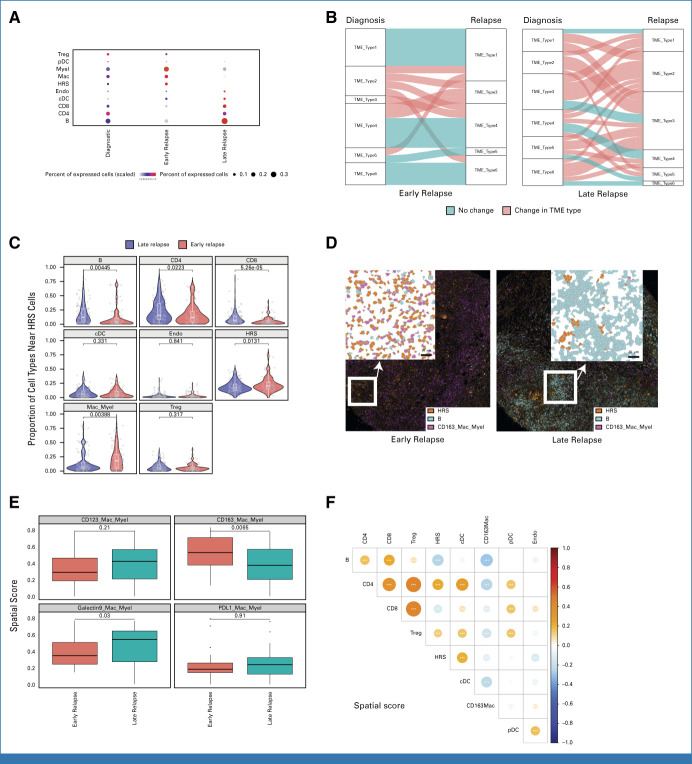
Patients and methods: We performed imaging mass cytometry (IMC) on 71 paired primary diagnostic and relapse biopsies using a marker panel specific to CHL biology. For each cell type in the TME, we calculated a spatial score measuring the distance of nearest neighbor cells to the malignant Hodgkin Reed Sternberg cells within the close interaction range. Spatial scores were used as features in prognostic model development for post-ASCT outcomes.

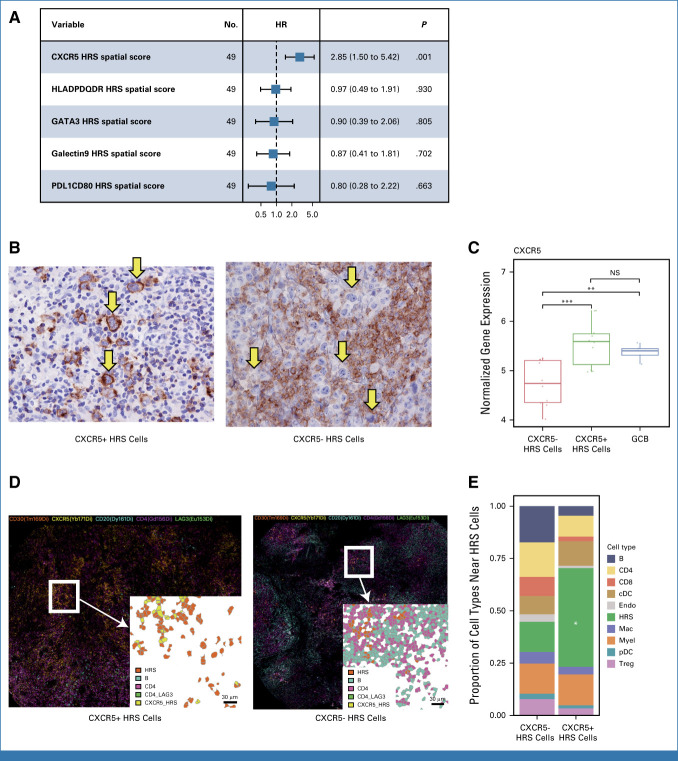
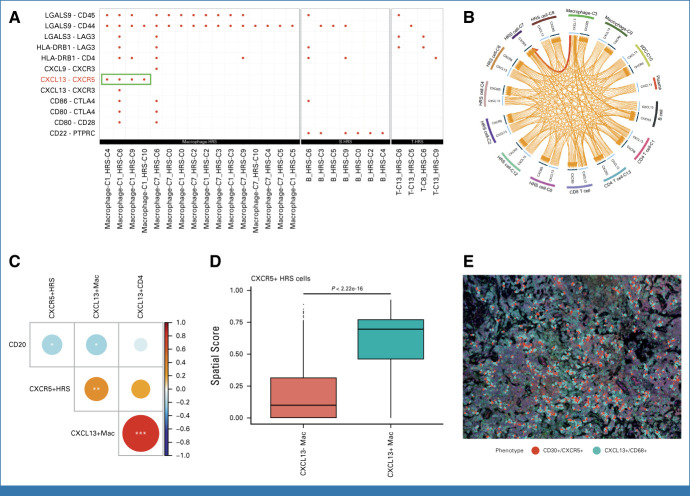
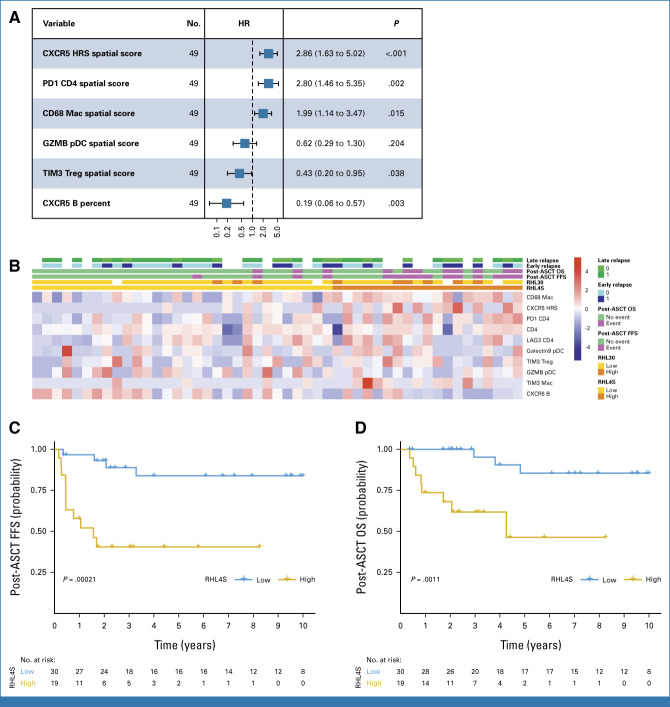
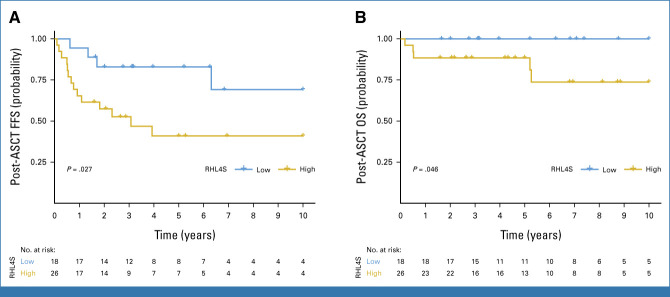
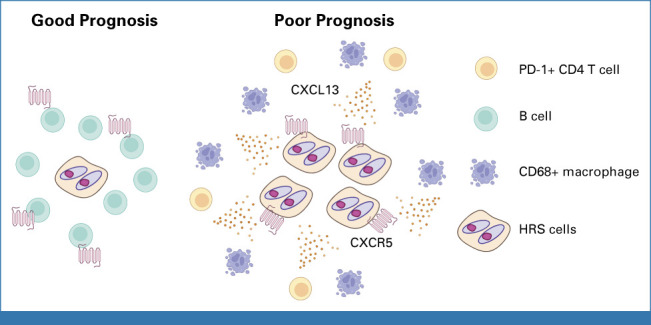
Results: Highly multiplexed IMC data revealed shared TME patterns in paired diagnostic and early r/r CHL samples, whereas TME patterns were more divergent in pairs of diagnostic and late relapse samples. Integrated analysis of IMC and single-cell RNA sequencing data identified unique architecture defined by CXCR5+ Hodgkin and Reed Sternberg (HRS) cells and their strong spatial relationship with CXCL13+ macrophages in the TME. We developed a prognostic assay (RHL4S) using four spatially resolved parameters, CXCR5+ HRS cells, PD1+CD4+ T cells, CD68+ tumor-associated macrophages, and CXCR5+ B cells, which effectively separated patients into high-risk versus low-risk groups with significantly different post-ASCT outcomes. The RHL4S assay was validated in an independent r/r CHL cohort using a multicolor immunofluorescence assay.

Conclusion: We identified the interaction of CXCR5+ HRS cells with ligand-expressing CXCL13+ macrophages as a prominent crosstalk axis in relapsed CHL. Harnessing this TME biology, we developed a novel prognostic model applicable to r/r CHL biopsies, RHL4S, opening new avenues for spatial biomarker development.


Conflict of interest statement

The following represents disclosure information provided by authors of this manuscript. All relationships are considered compensated unless otherwise noted. Relationships are self-held unless noted. I = Immediate Family Member, Inst = My Institution. Relationships may not relate to the subject matter of this manuscript. For more information about ASCO's conflict of interest policy, please refer to www.asco.org/rwc or ascopubs.org/jco/authors/author-center.

Open Payments is a public database containing information reported by companies about payments made to US-licensed physicians (Open Payments).

Figures

FIG 1.
FIG 1.
Distinct spatially resolved TME features according to relapse status. (A) Proportion for the indicated immune cell population by IMC-based cluster assignment. (B) The alluvial plot shows the TME types and their dynamic change between diagnostic samples and relapse samples according to relapse status. Horizontal ribbons represent individual cases and can be followed from left to right. Blue color of the ribbons indicates that there is no TME type change between diagnostic and relapse samples, whereas red-colored samples indicate the change in TME type. (C) Violin plot indicating the spatial score for the indicated cell types near HRS cells according to relapse status. (D) IMC analysis from FFPE sections of CHL shows localization of immune cells according to relapse status. (Left) A representative case with early relapse CHL case shows numerous CD163+ macrophage/myeloid cells and rare B cells. By contrast, (right) a representative late relapse HL case shows few CD163+ macrophage/myeloid cells and abundant B cells. (E) Box plot indicating the spatial scores of macrophage/myeloid cell subtypes near HRS cells according to relapse status. (F) Dot plot showing correlation of spatial scores of major immune cell markers by IMC. Dot size and color summarize Pearson correlation values, with positive correlations represented in red and negative correlations represented in blue. Asterisks represent associated P values (*P < .05; **P < .01; ***P < .001). cDC, conventional dendritic cell; CHL, classic Hodgkin lymphoma; FFPE, formalin-fixed paraffin-embedded; HRS, Hodgkin and Reed Sternberg; IMC, imaging mass cytometry; pDC, plasmacytoid dendritic cell; TME, tumor microenvironment; Treg, T regulatory cell.
FIG 2.
FIG 2.
Characteristics of the tumor microenvironment of CHL associated with CXCR5 positivity on HRS cells. (A) Forest plots summarize the prognostic factors in relapsed CHL treated with high-dose chemotherapy/autologous stem-cell transplantation according to HRS cells' features by IMC. (B) IHC staining for CXCR5 in representative cases with either (left) positive or (right) negative HRS cells (×400). (C) Expression of CXCR5 in microdissected HRS cells from primary CHL samples (separated by CXCR5 status evaluated by IHC) and germinal center cells from reactive tonsil tissue (GCB; t test; NS: P > .05; *P ≤ .05; **P ≤ .01 ; ***P ≤ .001). (D) IMC image for selected immune subsets in representative cases with either (left) CXCR5-positive or (right) CXCR5-negative HRS cells. (E) Relative proportion of cell subtypes near either negative (left) or positive (right) HRS cells. *P < .05. cDC, conventional dendritic cell; CHL, classic Hodgkin lymphoma; GCB, germinal center B cell; HR, hazard ratio; HRS, Hodgkin and Reed Sternberg; IHC, immunohistochemistry; IMC, imaging mass cytometry; NS, nodular sclerosis; pDC, plasmacytoid dendritic cell; Treg, T regulatory cell.
FIG 3.
FIG 3.
CXCL13/CXCR5 interaction in CHL. (A) The dot plot shows significant ligand and receptor interaction between HRS cells (receptor) and immune cell populations (ligand) using Cell Chat. (B) An interaction between CXCL13 and CXCR5 on immune cells and HRS cells in CHL samples was predicted using the iTALK tool. (C) Dot plot showing correlations of the proportions of selected immune cell subsets with emphasis on CXCL13/CXCR5 interaction (multicolor immunohistochemistry). Dot size and color summarize Pearson correlation values, with positive correlations represented in blue and negative correlations represented in red. Asterisks represent associated P values (*P < .05; **P < .01; ***P < .001). (D) Boxplot showing the spatial score of CXCL13+ and CXCL13− macrophages in the region surrounding CD30+ cells (HRS). (E) Membrane map depicting CD68+CXCL13+ macrophages (light blue) and CD30+CXCR5+ HRS cells (red). CHL, classic Hodgkin lymphoma; HRS, Hodgkin and Reed Sternberg.
FIG 4.
FIG 4.
Development of a novel prognostic model, RHL4S, which predicts FFS after ASCT. (A) Forest plots summarize the prognostic factors in relapsed classic Hodgkin lymphoma treated with high-dose chemotherapy/ASCT according to IMC. (B) Heatmap of the spatial scores in RHL4S according to IMC. Cases are ordered by the RHL4S model score. Kaplan-Meier curves of the high- versus low-risk groups for (C) post-ASCT FFS and (D) post-ASCT OS as identified by RHL4S. P values were calculated using a log-rank test. ASCT, autologous stem-cell transplantation; FFS, failure-free survival; HR, hazard ratio; HRS, Hodgkin and Reed Sternberg; IMC, imaging mass cytometry; OS, overall survival.
FIG 5.
FIG 5.
Validation of RHL4S in the independent cohort of relapsed and refractory classic Hodgkin lymphoma. Kaplan-Meier curves of the high- versus low-risk groups for (A) post-ASCT FFS and (B) post-ASCT OS as identified by RHL4S in the independent validation cohort, respectively. P values were calculated using a log-rank test. ASCT, autologous stem-cell transplantation; FFS, failure-free survival; OS, overall survival.
FIG 6.
FIG 6.
Graphical summary of findings in r/r CHL. r/r CHL with poor prognosis is characterized by CXCR5 positivity on HRS cells. CXCL13+ macrophages surround CXCR5+ HRS cells, and PD1+ CD4+ T cells were also present in the tumor microenvironment. By contrast, CXCR5+ B cells were enriched in r/r CHL with good prognosis. CHL, classic Hodgkin lymphoma; HRS, Hodgkin and Reed Sternberg; r/r, relapsed or refractory.

Similar articles

Cited by

References

    1. Scott DW, Gascoyne RD: The tumour microenvironment in B cell lymphomas. Nat Rev Cancer 14:517-534, 2014 - PubMed
    1. Danenberg E, Bardwell H, Zanotelli VRT, et al. : Breast tumor microenvironment structures are associated with genomic features and clinical outcome. Nat Genet 54:660-669, 2022 - PMC - PubMed
    1. Jain RK: Normalizing tumor microenvironment to treat cancer: Bench to bedside to biomarkers. J Clin Oncol 31:2205-2218, 2013 - PMC - PubMed
    1. Castellino SM, Geiger AM, Mertens AC, et al. : Morbidity and mortality in long-term survivors of Hodgkin lymphoma: A report from the Childhood Cancer Survivor Study. Blood 117:1806-1816, 2011 - PMC - PubMed
    1. Kelly KM, Hodgson D, Appel B, et al. : Children's Oncology Group's 2013 blueprint for research: Hodgkin lymphoma. Pediatr Blood Cancer 60:972-978, 2013 - PubMed