. 2024 Jan:99:104924.
doi: 10.1016/j.ebiom.2023.104924. Epub 2023 Dec 18.

Mucosal SARS-CoV-2 vaccination of rodents elicits superior systemic T central memory function and cross-neutralising antibodies against variants of concern

Affiliations

Mucosal SARS-CoV-2 vaccination of rodents elicits superior systemic T central memory function and cross-neutralising antibodies against variants of concern

Aled O'Neill et al. EBioMedicine. 2024 Jan.

Abstract

Background: COVID-19 vaccines used in humans are highly effective in limiting disease and death caused by the SARS-CoV-2 virus, yet improved vaccines that provide greater protection at mucosal surfaces, which could reduce break-through infections and subsequent transmission, are still needed.

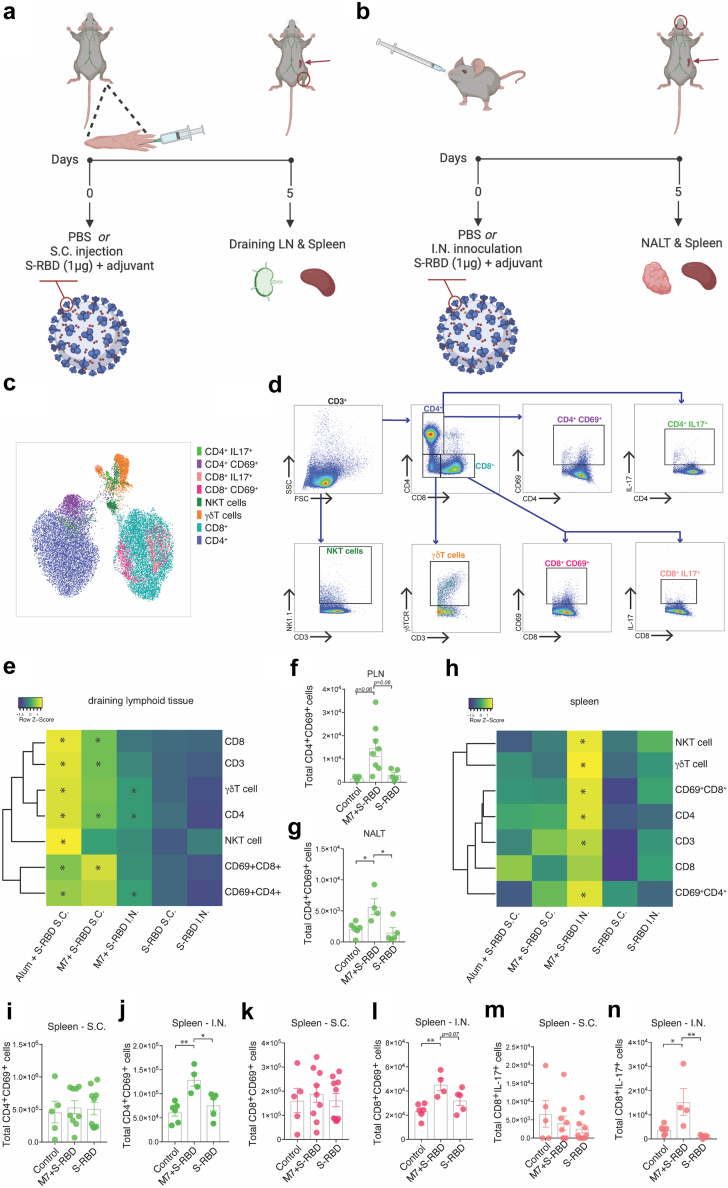
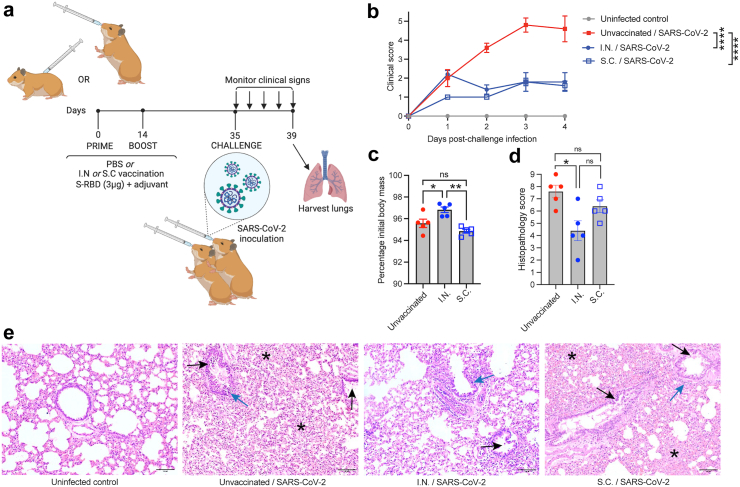
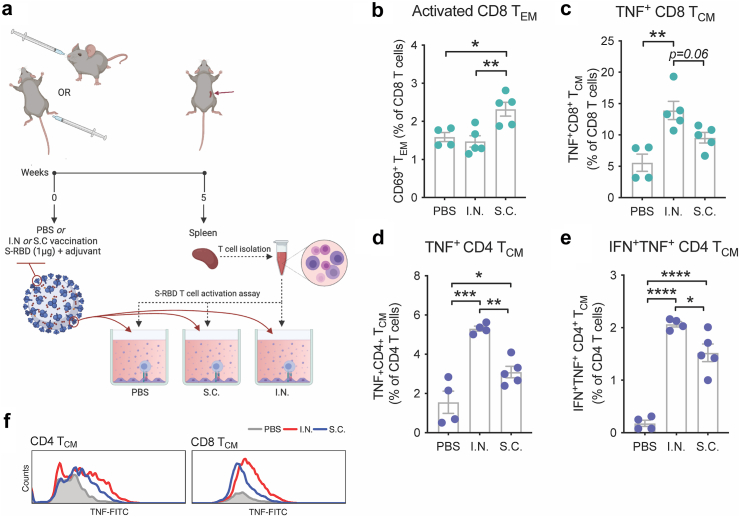
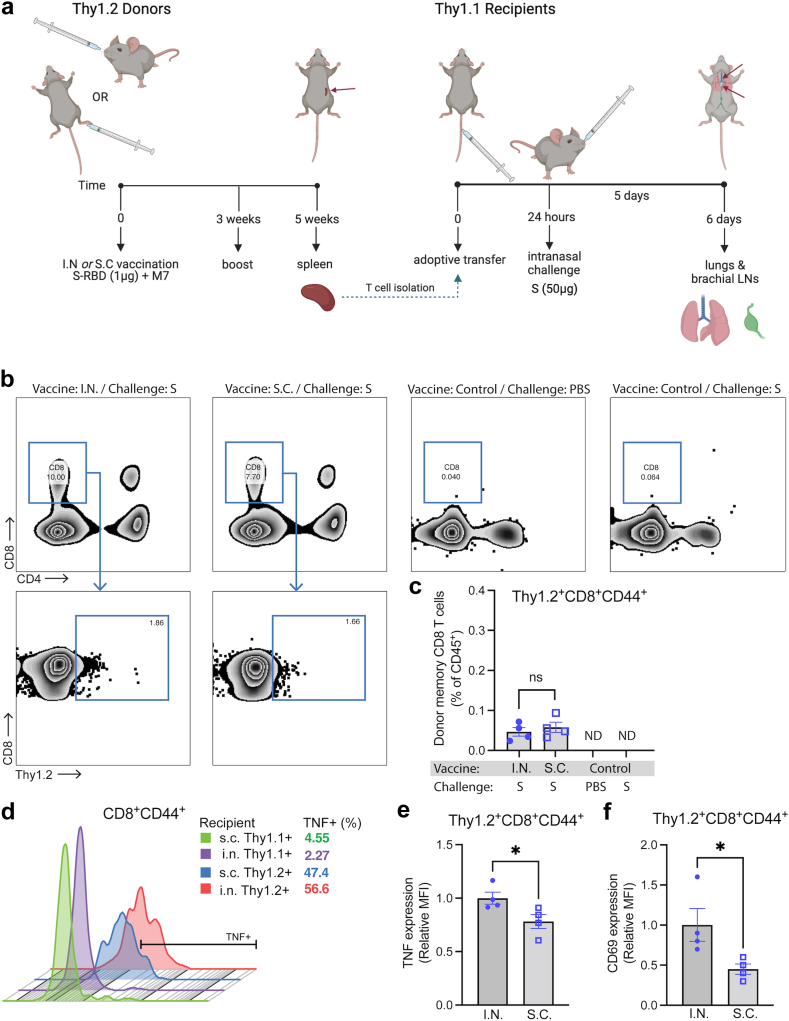
Methods: Here we tested an intranasal (I.N.) vaccination with the receptor binding domain of Spike antigen of SARS-CoV-2 (S-RBD) in combination with the mucosal adjuvant mastoparan-7 compared with the sub-cutaneous (S.C.) route, adjuvanted by either M7 or the gold-standard adjuvant, alum, in mice, for immunological read-outs. The same formulation delivered I.N. or S.C. was tested in hamsters to assess efficacy.

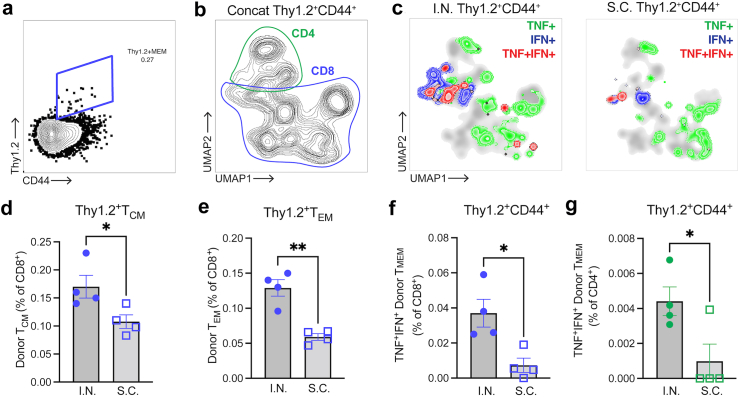
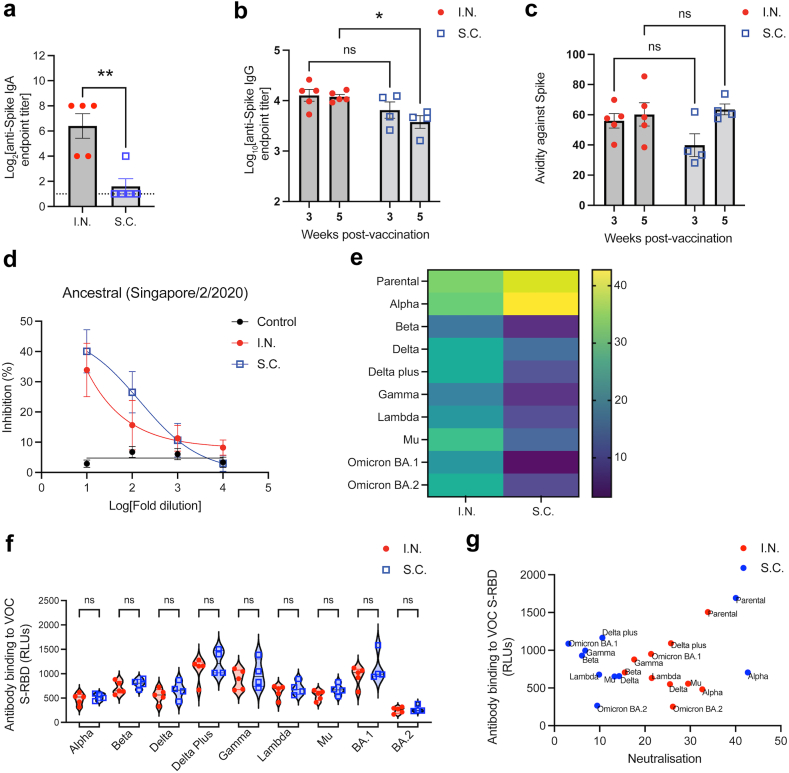
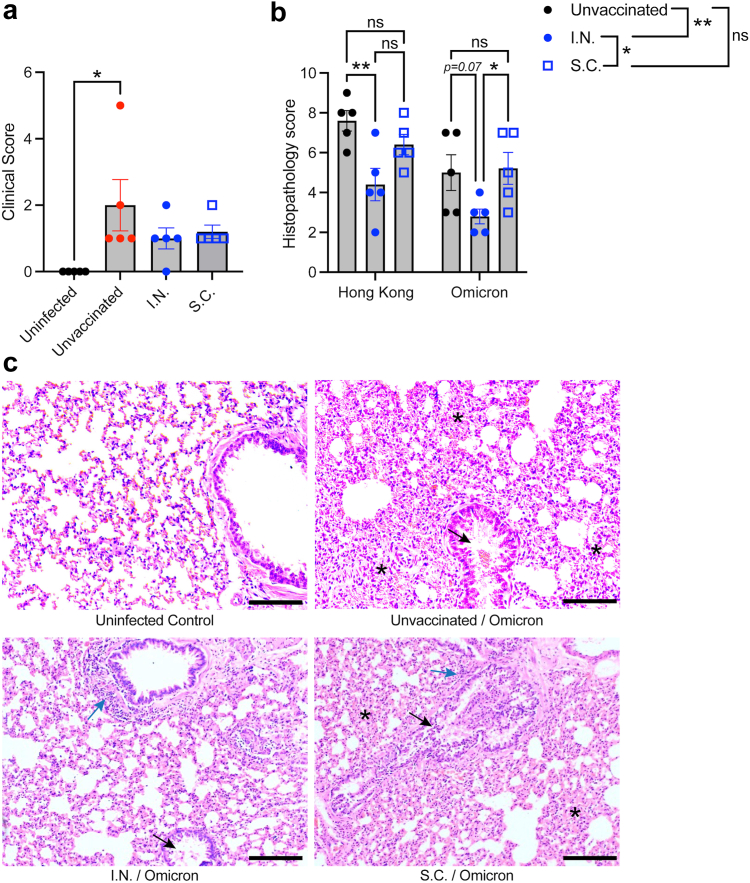
Findings: I.N. vaccination improved systemic T cell responses compared to an equivalent dose of antigen delivered S.C. and T cell phenotypes induced by I.N. vaccine administration included enhanced polyfunctionality (combined IFN-γ and TNF expression) and greater numbers of T central memory (TCM) cells. These phenotypes were T cell-intrinsic and could be recalled in the lungs and/or brachial LNs upon antigen challenge after adoptive T cell transfer to naïve recipients. Furthermore, mucosal vaccination induced antibody responses that were similarly effective in neutralising the binding of the parental strain of S-RBD to its ACE2 receptor, but showed greater cross-neutralising capacity against multiple variants of concern (VOC), compared to S.C. vaccination. I.N. vaccination provided significant protection from lung pathology compared to unvaccinated animals upon challenge with homologous and heterologous SARS-CoV-2 strains in a hamster model.

Interpretation: These results highlight the role of nasal vaccine administration in imprinting an immune profile associated with long-term T cell retention and diversified neutralising antibody responses, which could be applied to improve vaccines for COVID-19 and other infectious diseases.

Funding: This study was funded by Duke-NUS Medical School, the Singapore Ministry of Education, the National Medical Research Council of Singapore and a DBT-BIRAC Grant.

Keywords: COVID-19; Mucosal vaccine; SARS-CoV-2; T cell.


Conflict of interest statement

Declaration of interests ALS is an inventor on a patent relating to mucosal vaccination against COVID-19. LFW and TCW are co-inventors on a patent for the sVNT assay and receive royalties from the cPass kit.

Figures

Fig. 1
Fig. 1
Superior systemic T cell activation following mucosal vaccination against SARS-CoV-2. (a and b) Diagrams of (a) sub-cutaneous (S.C.) and (b) intra-nasal (I.N.) vaccination strategies. (c) UMAP representation of the populations of T cells assessed in lymphoid organs 5 days following vaccination. (d) Flow cytometry gating strategy on CD3+ cells to identify T cell subsets and their phenotypes and activation status corresponding to the populations depicted in panel C. (e) Heat map representation of the frequency of various T cell subsets day 5 following vaccination in the draining lymphoid tissue [either NALT for I.N. or popliteal LN (PLN) for S.C. vaccination]. Raw data and statistical comparisons for the M7 + S-RBD S.C. group are provided in Supplementary Figure S1A, for the Alum + S-RBD S.C. group are provided in Supplementary Figure S1B, and for the M7 + S-RBD I.N. group are provided in Supplementary Figure S1C. (f and g) Total activated CD4+CD69+ cells in the (f) PLN after S.C. M7 + S-RBD vaccination and (g) NALT after I.N. M7 + S-RBD vaccination. (h) Heat map representation of the frequency of various T cell subsets day 5 following vaccination in the spleen. (i and j) Numbers of CD4+CD69+ T cells in the spleen following (i) S.C. or (j) I.N. vaccination with M7 + S-RBD compared to controls or antigen (S-RBD) alone. (k and l) Numbers of CD8+CD69+ T cells in the spleen following (k) S.C. or (l) I.N. vaccination with M7 + S-RBD compared to controls or antigen (S-RBD) alone (m and n) Numbers of IL-17+ CD8 T cells in the spleen following (m) S.C. or (n) I.N. vaccination with M7 + S-RBD compared to controls or antigen (S-RBD) alone. Raw data and statistical comparisons for the spleen data for the M7 + S-RBD S.C. group are provided in Supplementary Figure S1D, for the Alum + S-RBD S.C. group are provided in Supplementary Figure S1E, and for the M7 + S-RBD I.N. group are provided in Supplementary Figure S1F. N = 5–10 mice per group; ∗p < 0.05 and ∗∗p < 0.01 by 1-way ANOVA.
Fig. 2
Fig. 2
Mucosal vaccination protects hamsters from SARS-CoV-2-induced clinical disease. (a) Diagram of the experimental design where hamsters were vaccinated with S-RBD and M7 via various routes using a prime (day 0) and boost (day 14). Animals were then challenged I.N. with of 105 plaque-forming units (PFU) SARS CoV-2 on day 35 and monitored for 4 days prior to necropsy. (b) Clinical scores of vaccinated animals were significantly reduced compared to unvaccinated infected controls by 2-way ANOVA with Tukey’s post-test; p < 0.0001. n = 5 per group. (c) Day 4 post-infection, I.N. vaccinated animals began to recover body mass compared to unvaccinated and S.C. vaccinated controls that were also infected. ∗p < 0.05 and ∗∗p < 0.01 by one-way ANOVA with Tukey’s post-test. (d) I.N. vaccinated animals had reduced lung tissue damage compared to unvaccinated animals following SARS-CoV-2 challenge, by histopathological score, determined by one-way ANOVA. p < 0.05. (e) Representative images of lung histology. Scale bar = 100 μm. Black arrows indicate examples of bronchiolar epithelial cell death and desquamation, although very mild in the I.N. group. Blue arrows indicate examples peribronchiolar cellular infiltration. Asterisks are placed to indicate examples of pronounced alveolar septal infiltration.
Fig. 3
Fig. 3
Mucosal vaccination enhances induction of antigen-specific polyfunctional TCM. (a) Schematic representing the experimental design where splenocytes isolated from mice vaccinated with M7 + S-RBD by either the I.N. or S.C. route were stimulated with antigen S-RBD. (b) Increased activation of CD8 TEM cells detected from mice vaccinated via the S.C. route, following stimulation with S-RBD. (c) Increased TNF+ CD8 TCM cells from mice vaccinated via the I.N. route following stimulation with S-RBD. (d and e) Quantification of the (d) TNF+ and (e) IFN-γ+TNF+ populations of CD4 TCM following antigen stimulation indicates an increase following either I.N. or S.C. vaccination compared to controls and for I.N. compared to S.C. vaccination with the same formulation of M7 + S-RBD. For (b and c) and (d and e), data points represent experimental replicates (4–5 individual mice for vaccine groups and 2 technical replicates from 2 mice for PBS group). (f) Representative histograms showing strong induction of TNF following I.N. compared to S.C. vaccination after antigen (S-RBD) stimulation. ∗p < 0.05, ∗∗p < 0.01, ∗∗∗p < 0.001, ∗∗∗∗p < 0.0001 by 1-way ANOVA with Tukey’s post-test.
Fig. 4
Fig. 4
Improved re-activation of memory T cells derived from I.N. vaccinated donors in recipient lungs upon challenge. (a) Diagram illustrating the experimental design of adoptive transfer of purified Thy1.2+ T cells from M7 + S-RBD-vaccinated donors (via S.C. or I.N. routes) into Thy1.1+ naïve recipients, followed by I.N. challenge with S protein. (b) Flow cytometry plots indicating the presence of donor Thy1.2+CD8+ T cells in the lungs of vaccinated recipient mice, but not control mice, 5 days after challenge. Full gating strategy provided in Supplementary Figure S4A. (c) Donor Thy1.2+CD8+ T cells constituted a minor portion of haemopoietic cells in the lung following challenge and did not differ in frequency between I.N. or S.C. vaccinated groups, but were not detected in control mice. (d) Histogram of TNF expression on donor (Thy1.2+) and recipient (Thy1.1+) CD44+CD8+ T cells representative of each group indicates an increase in TNF expression by donor T cells in lungs from vaccinated mice. Downsampling of 600 T cells was used to facilitate comparisons of equal numbers of cells for each sample. The percentage of TNF+ cells of total CD44+CD8+ T cells is indicated in the legend. (e and f) The MFI for (e) TNF expression and (f) CD69 expression were compared for Thy1.2+ donor CD8 TMEM cells in the lungs following S challenge. For (e and f), vaccinated groups were not compared to control groups since there were insufficient donor memory T cells in the lungs of unvaccinated control groups for TNF expression quantification. N = 4–5 mice per group derived from two independent experiments. ∗p < 0.05 by Student’s unpaired t-test.
Fig. 5
Fig. 5
Mucosal vaccination enhances memory T cell responses in brachial LNs. (a) Identification of donor Thy1.2+ TMEM cells and (b) UMAP presentation (concatenated representation of all groups) with the locations of CD4 and CD8 T cell subsets outlined on the plot. Full gating strategy is provided in Supplementary Figure S4C. (c) Donor TMEM cells (Thy1.2+CD44+) expressing the cytokines TNF and/or IFN-γ are shown by overlaying the cytokine-positive subpopulations over the total UMAP plots for each group I.N. (left) versus S.C. (right). All samples from each experimental or control group (n = 4 mice) are concatenated to generate the respective plots. (d and e) Plots indicating the percentage of donor-derived CD8 T cells with the (d) TCM or (e) TEM phenotypes. Percentage of (f) CD8 and (g) CD4 T cells that are donor TMEM cells, staining double-positive for cytokines (TNF+IFN-γ+). N = 4–5 mice per group derived from two independent experiments ∗p < 0.05, ∗∗p < 0.01 by Student’s unpaired t-test.
Fig. 6
Fig. 6
Superior antibody titre and SARS-CoV-2 variant cross-neutralisation after mucosal vaccination. (a) Anti-S-RBD IgA endpoint titres in nasal washes, 21 days post-immunisation. (b and c) Serum Anti-S-RBD IgG (b) endpoint titres and (c) avidity (percentage serum antibody that remains bound after stringent ELISA washing) following S.C. or I.N. vaccination. ∗p < 0.05, by two-way ANOVA. ns = not significant. (d) Percentage inhibition of S-RBD association with its receptor hACE-2 by serum antibodies, determined by s-VNT. For control versus I.N, p = 0.003; for control versus S.C. p < 0.001. For I.N. versus S.C., the comparison was not significantly different. (e) Heatmap depicting the % inhibition against S-RBD from multiple SARS-CoV-2 variants at 1:10 serum dilution. Corresponding dose response curves with p-values are provided in panel (d) and Supplementary Figure S5. (f) Comparison of serum antibody binding to S-RBD from multiple VOC between the I.N. and S.C. vaccination groups, determined by ELISA. RLU = relative light units. (g). No correlation between antigen binding and neutralisation (by sVNT) was observed.
Fig. 7
Fig. 7
Improved lung histopathological scores for I.N. vaccinated hamsters during a heterologous challenge with Omicron. Groups of vaccinated and unvaccinated hamsters (n = 5) were challenged with 105 PFU of Omicron VOC (USA/PHC658/2021). (a) Elevated clinical scores day 4 post-Omicron challenge in unvaccinated animals compared to uninfected controls. ∗p < 0.05 by 1-way ANOVA with Tukey’s post-test. (b) Comparison of histopathological scores for Hong Kong (parental strain, Hong Kong/VM20001061/2020) and Omicron-challenged hamsters. Data from Hong Kong challenged hamsters is re-presented from Fig. 2 to aid comparison. Comparisons of individual vaccine groups for each challenge are indicated on the graphs and comparisons of the influence of vaccination group, independent of the virus challenge strain, are indicated on the figure legend. ∗∗p < 0.01 and ∗p < 0.05 by two-way ANOVA with Tukey’s post-test. The virus strain accounted for 19.7% (p = 0.0034) of the variation in the data, while 33.5% of the variation was accounted for by the vaccination group (p = 0.0012). (c) Representative images of lung tissue from Omicron-infected hamsters, day 4 post-infection. Scale bar = 100 μm. Black arrows indicate examples of bronchiolar epithelial cell death and desquamation, although very mild in the I.N. group. Blue arrows indicate examples peribronchiolar cellular infiltration. Asterisks are placed to indicate examples of pronounced alveolar septal infiltration.

References

    1. Huang C., Wang Y., Li X., et al. Clinical features of patients infected with 2019 novel coronavirus in Wuhan, China. Lancet. 2020;395(10223):497–506. - PMC - PubMed
    1. St John A.L., Rathore A.P.S. Early insights into immune responses during COVID-19. J Immunol. 2020;205(3):555–564. - PubMed
    1. Wool G.D., Miller J.L. The impact of COVID-19 disease on platelets and coagulation. Pathobiology. 2021;88(1):15–27. - PMC - PubMed
    1. Li Q., Guan X., Wu P., et al. Early transmission dynamics in Wuhan, China, of novel coronavirus-infected pneumonia. N Engl J Med. 2020;382:1199–1207. - PMC - PubMed
    1. Munro A.P.S., Janani L., Cornelius V., et al. Safety and immunogenicity of seven COVID-19 vaccines as a third dose (booster) following two doses of ChAdOx1 nCov-19 or BNT162b2 in the UK (COV-BOOST): a blinded, multicentre, randomised, controlled, phase 2 trial. Lancet. 2021;398(10318):2258–2276. - PMC - PubMed