. 2024 Jan:99:104914.
doi: 10.1016/j.ebiom.2023.104914. Epub 2023 Dec 18.

Circulating biomarkers in familial cerebral cavernous malformation

Affiliations

Circulating biomarkers in familial cerebral cavernous malformation

Francesca Lazzaroni et al. EBioMedicine. 2024 Jan.

Abstract

Background: Cerebral Cavernous Malformation (CCM) is a rare cerebrovascular disease, characterized by the presence of multiple vascular malformations that may result in intracerebral hemorrhages (ICHs), seizure(s), or focal neurological deficits (FND). Familial CCM (fCCM) is due to loss of function mutations in one of the three independent genes KRIT1 (CCM1), Malcavernin (CCM2), or Programmed Cell death 10 (PDCD10/CCM3). The aim of this study was to identify plasma protein biomarkers of fCCM to assess the severity of the disease and predict its progression.

Methods: Here, we have investigated plasma samples derived from n = 71 symptomatic fCCM patients (40 female/31 male) and n = 17 healthy donors (HD) (9 female/8 male) of the Phase 1/2 Treat_CCM trial, using multiplexed protein profiling approaches.

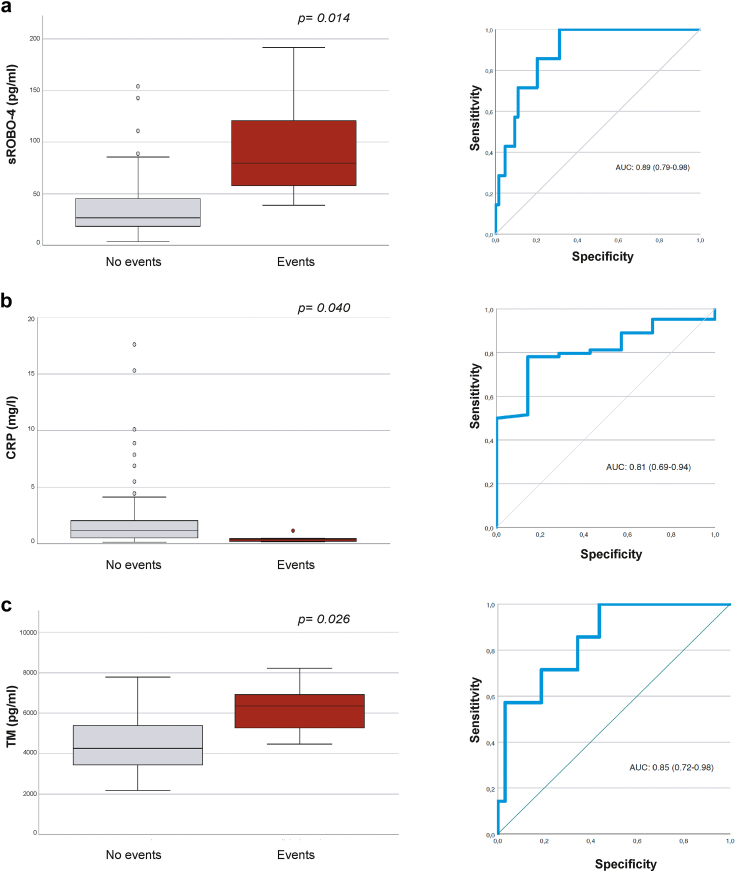
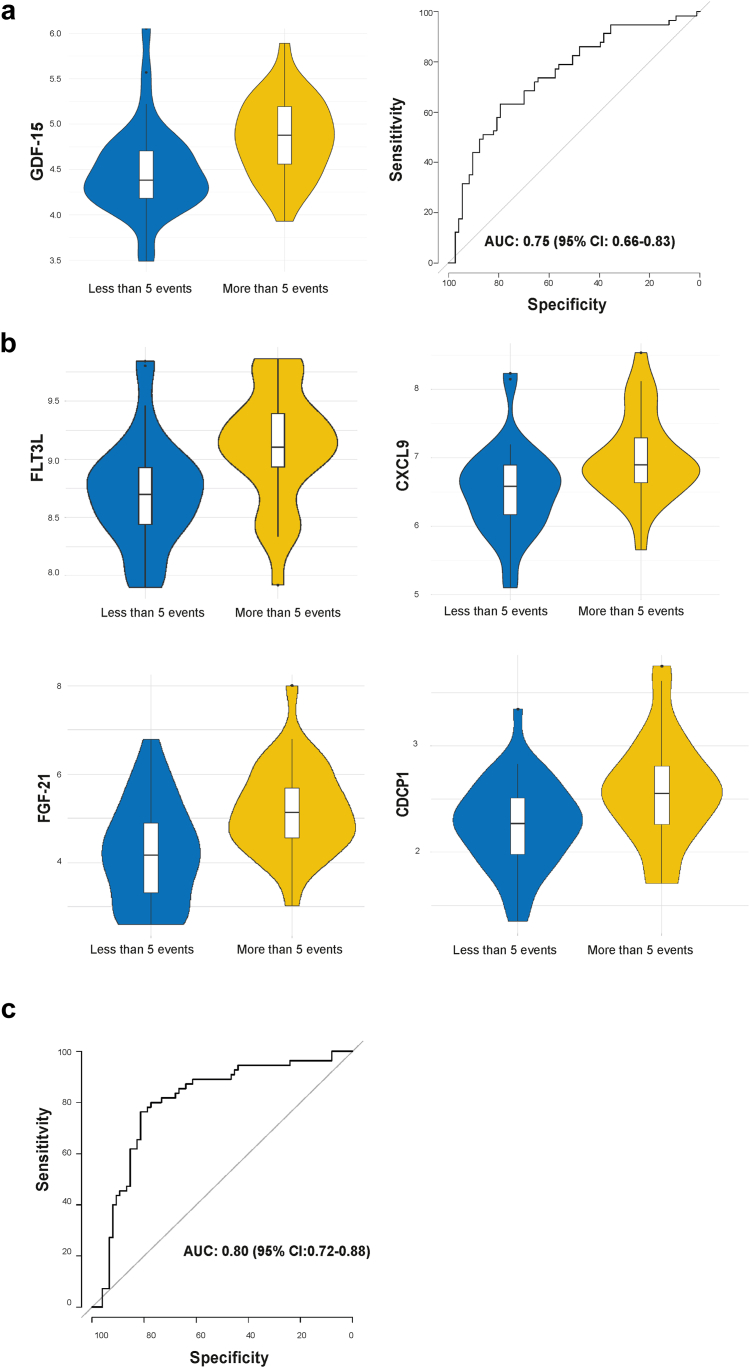
Findings: Biomarkers as sCD14 (p = 0.00409), LBP (p = 0.02911), CXCL4 (p = 0.038), ICAM-1 (p = 0.02013), ANG2 (p = 0.026), CCL5 (p = 0.00403), THBS1 (p = 0.0043), CRP (p = 0.0092), and HDL (p = 0.027), were significantly different in fCCM compared to HDs. Of note, sENG (p = 0.011), THBS1 (p = 0.011) and CXCL4 (p = 0.011), were correlated to CCM genotype. sROBO4 (p = 0.014), TM (p = 0.026) and CRP (p = 0.040) were able to predict incident adverse clinical events, such as ICH, FND or seizure. GDF-15, FLT3L, CXCL9, FGF-21 and CDCP1, were identified as predictors of the formation of new MRI-detectable lesions over 2-year follow-up. Furthermore, the functional relevance of ang2, thbs1, robo4 and cdcp1 markers was validated by zebrafish pre-clinical model of fCCM.

Interpretation: Overall, our study identifies a set of biochemical parameters to predict CCM progression, suggesting biological interpretations and potential therapeutic approaches to CCM disease.

Funding: Italian Medicines Agency, Associazione Italiana per la Ricerca sul Cancro (AIRC), ERC, Leducq Transatlantic Network of Excellence, Swedish Research Council.

Keywords: Biomarkers; Familial cerebral cavernous malformation; Proteomics; Vascular biology.


Conflict of interest statement

Declaration of interests B.B is inventor of patents on PTX3 and obtains royalties on PTX3-related reagents. N.B. serves on Advisory Board and Speakers Bureau for Celgene and Janssen, and on Speakers Bureau for Takeda, Amgen.

Figures

Fig. 1
Fig. 1
Workflow, sample information and expression of inflammatory proteins in fCCM patients (a) A schema depicting the workflow of this study. 71 fCCM patients were enroled in Treat_CCM clinical trial. In addition, 17 healthy subjects were enrolled. Selected biomarkers and circulating proteins of Inflammation and Cardiovascular III Olink biomarker panels were analysed. (b) Box and whisker plots (box represent the interquartile range and outliers are 1.5 box lengths rom median) of the concentrations of plasma biomarkers. Among the 17 plasma molecules (n = 3 technical replicates), fCCM patients showed upper plasma levels of CCL5, CRP, ICAM1, LBP, sCD14, THBS1 and a lower level of ANG2. fCCM are represented by red box, and HDs by green box. p-values were calculated by means of Kruskall–Wallis test and account for false discovery rate (FDR). CCL5, Chemokine (C–C motif) ligand 5; CRP, C reactive protein; ICAM1, intercellular adhesion molecule 1; LBP, lipopolysaccharide binding protein; sCD14, cluster of differentiation 14; THBS1, thrombospondin1; ANG2, angiopoietin2. (c) Colored heatmap of the pair-wise Spearman's rank correlation coefficients computed for circulating plasma molecules. The colors refer to the correlation coefficient direction and magnitude, ranging from −1 (blue) to 1 (red).
Fig. 2
Fig. 2
Expression levels of biomarkers to stratify patients according to genotype. Box and whisker plots (box represent the interquartile range and outliers are 1.5 box lengths from median) of the concentrations of plasma CXCL4 (a), sENG (b) and THBS1 (c) markers for each fCCM genetic group (n = 3 technical replicates). The central black lines show the median values, regions above and below these lines show the upper and lower quartiles, respectively. CCM1 is represented by orange box, CCM2 by light red and CCM3 by dark red boxes. The p-values were calculated by means of Kruskall–Wallis test and account for false discovery rate. CXCL4, chemokine (C-X-C motif) ligand 4; sENG, soluble endogline; THBS1, thrombospondin1.
Fig. 3
Fig. 3
Plasma concentrations of sROBO4, TM and CRP by incident adverse clinical events and ROC curve analyses. Box and whisker plots (box represent the interquartile range and outliers are 1.5 box lengths from median) of the plasma concentrations of (a) sROBO4, (b) CRP and (c) TM in patients who had confirmed incident adverse CCM-related clinical events that occurred during the 2-years trial period (n = 3 technical replicates). The AUC ROC curve analyses of the differentiation between the participants who experienced clinical events versus patients without any clinical outcomes. The p-values were calculated by means of Kruskall Wallis test and account for false discovery rate (FDR).
Fig. 4
Fig. 4
Plasma proteomic predictors of new MRI-detectable lesions. (a) Violin plot of normalized protein expression (NPX) of GDF-15 for patients with more than 5 new CCM-MRI lesions and less than 5 lesions over 2 years of trial period; and ROC curve analysis for predictive model using GDF-15 (derived from OLINK® cardiovascular panel) as a predictor to discriminate between patients with more than 5 new CCM-MRI lesions or less than 5 lesions over 2 years trial period. (b) Violin plot of normalized protein expression (NPX) of FLT3L, CXCL9, FGF-21 and CDCP1 for patients with more than 5 new CCM-MRI lesions and less than 5 lesions over 2 years of trial period. (c) ROC curve analysis for predictive CCM progression using a panel of predictors, FLT3L, CXCL9, FGF-21 and CDCP1 (derived from OLINK® inflammation panel) to discriminate between patients with more than 5 new CCM-MRI lesions or less than 5 lesions over 2 years trial period.

References

    1. Cox E.M., Bambakidis N.C., Cohen M.L. Pathology of cavernous malformations. Handb Clin Neurol. 2017;143:267–277. - PubMed
    1. Kivelev J., Niemelä M., Hernesniemi J. Treatment strategies in cavernomas of the brain and spine. J Clin Neurosci. 2012;19:491–497. - PubMed
    1. Fischer A., Zalvide J., Faurobert E., Albiges-Rizo C., Tournier-Lasserve E. Cerebral cavernous malformations: from CCM genes to endothelial cell homeostasis. Trends Mol Med. 2013;19:302–308. - PubMed
    1. Labauge P., Denier C., Bergametti F., Tournier-Lasserve E. Genetics of cavernous angiomas. Lancet Neurol. 2007;6:237–244. - PubMed
    1. Lampugnani M.G., Malinverno M., Dejana E., Rudini N. Endothelial cell disease: emerging knowledge from cerebral cavernous malformations. Curr Opin Hematol. 2017;24:256–264. - PubMed

Supplementary concepts