. 2024 Feb 1;32(2):228-241.e4.
doi: 10.1016/j.str.2023.11.011. Epub 2023 Dec 18.

Accurate modeling of peptide-MHC structures with AlphaFold

Affiliations

Accurate modeling of peptide-MHC structures with AlphaFold

Victor Mikhaylov et al. Structure. .

Abstract

Major histocompatibility complex (MHC) proteins present peptides on the cell surface for T cell surveillance. Reliable in silico prediction of which peptides would be presented and which T cell receptors would recognize them is an important problem in structural immunology. Here, we introduce an AlphaFold-based pipeline for predicting the three-dimensional structures of peptide-MHC complexes for class I and class II MHC molecules. Our method demonstrates high accuracy, outperforming existing tools in class I modeling accuracy and class II peptide register prediction. We validate its performance and utility with new experimental data on a recently described cancer neoantigen/wild-type peptide pair and explore applications toward improving peptide-MHC binding prediction.

Keywords: AlphaFold; T-cells; major histocompatibility complex; neoantigens; protein structure prediction.


Conflict of interest statement

Declaration of interests A.J.L. is a founder, director, and shareholder and receives fees for these activities of PMV Pharma. He also is a consultant for Chugai Pharma and receives a fee for that position. Neither company works in the topic of this manuscript. V.M. is an employee and shareholder of BioNTech US, Inc.

Figures

Figure 1.
Figure 1.
Structure dataset and the modeling pipeline. (A) Counts of non-redundant pMHCs in the discovery and test datasets, for class I and class II. (B) A schematic of a peptide position relative to the MHC binding groove. (For class I, positions P2 and P9 are the primary anchors. For class II, positions P1 and P9 are the two ends of the peptide core.) Peptide registers can be parameterized by the lengths of the C-terminal and N-terminal regions n,nr. The sets of class I and class II registers observed in the discovery dataset can be characterized by a few simple rules. (C) The four registers that are possible for a class I 9-mer peptide, according to our register selection rules. (D) For a pMHC sequence and a choice of peptide register, our pipeline assigns templates and a paired peptide-MHC multiple sequence alignment. From these data, AlphaFold (AF) produces a model and an error score. (We use 100-pLDDT averaged over the peptide core as the score.) (E) A neural net seqnn predicts the pMHC dissociation constant Kd for each peptide register. Only registers with Kd within a certain factor of the lowest Kd for a given pMHC are then considered in modeling.
Figure 2.
Figure 2.
Results of pMHC modeling for class I structures. (A) Numbers of non-redundant pMHCs for different MHC loci and species in the class I dataset. (B) Cα-pRMSD (alpha-carbon peptide RMSD) for TFold models in the class I discovery and test datasets. RMSD is computed upon superimposing MHC chains of the model and the experimental structure. Results shown for models selected by predicted LDDT (“best pLDDT”) and by peptide RMSD (“best RMSD”). Here and below, box plots show median value and first quartiles, whiskers show the rest of the distribution. (C) Fractions of incorrect predictions of peptide registers for class I models in the discovery and test datasets, for different methods. The first method (“assign canonical”) assigns the canonical register to all pMHCs. Error bars show 95% confidence intervals (Agresti-Coull estimate). (D) Score vs accuracy plots for TFold models in the discovery and test datasets. Four accuracy groups of models based on Cα-pRMSD are denoted by color: sub-angstrom (<1 Å), good (1–1.5 Å), poor (1.5–2.5 Å), and unacceptable (>2.5 Å). For every score cutoff (100-pLDDT plotted along the horizontal axis), the plot shows fractions of pMHCs with models in the four accuracy groups among the pMHCs with score below the cutoff. The fractions are computed relative to the total number of pMHCs to illustrate what fraction of targets is retained for each cutoff. A vertical dashed line marks the median score. For models below and above the median score, percentages of models with Cα-pRMSD>1.5Å are shown to illustrate the score’s discrimination ability. Spearman’s ρ for the score vs RMSD is also printed on the plots. (E) Detailed diagram of register errors made by different algorithms on the discovery and test datasets. Rows correspond to algorithms, and columns to structures, with PDB IDs indicated below. Columns are colored by MHC locus and species. Each filled square indicates that the corresponding algorithm predicted the register incorrectly for the corresponding pMHC structure. (F) Comparison of Cα-pRMSDs for class I models produced by PANDORA and TFold. Percentages in the left plot are fractions of pMHCs above and below the diagonal. Both algorithms were run on the subset of the test set that only includes human and mouse MHC proteins. (G) Score vs accuracy plots for models produced by PANDORA and TFold. (See caption for figure 2D for a description of such plots.) For PANDORA, the scores in the plot are values of the MODELLER molpdf energy function. (H) TFold modeling results for the set of class I pMHC pairs that are similar in sequence but differ in geometry (“difficult pMHC pairs”). Each point in the scatterplot is a modeled pMHC, and the coordinates are Cα-pRMSD of the model relative to the native structure (“true RMSD”) or to the experimental structure for the other pMHC in the pair (“cross RMSD”). Percentages indicate fractions of points above and below the diagonal. Points are colored by error score (100-pLDDT) of the models. (I) Details on the modeling results for the class I difficult pMHC pairs. Each column corresponds to a pair of pMHCs similar in sequence. (Some of them differ only by mutations in the MHC sequence, which are not shown.) Markers indicate Cα-pRMSDs for models w.r.t. their experimental structures, between the two experimental structures, and between the models. Markers for model to native RMSDs are colored by the error scores, and average scores for each pair are used to sort the columns left to right. A perfect modeling algorithm would have low error for the models (colored markers near zero) and similar RMSDs between models and between true structures (crosses and empty circles overlapping).
Figure 3.
Figure 3.
Additional details on structures and modeling results. (A) Comparison of peptide geometry in pairs of PDB entries that share the same class I pMHC sequence. Data for pairs of TCR-unbound pMHC structures and TCR-bound vs unbound pMHC structures are shown separately. Here and below, box plots show median value and first quartiles, whiskers show the rest of the distribution. (B), (C) TFold models compared to TCR-bound and unbound pMHC structures, for class I pMHCs for which both bound and unbound experimental structures exist. (D), (E) Comparison of peptide Cα-RMSD for TFold models selected by best pLDDT or best RMSD and pMHC templates selected by best sequence match or best RMSD. (F)-(I) Modeling accuracy as a function of different features, for the class I discovery dataset. The features include peptide length, MHC locus and species, MHC sequence mismatch of the best available template, and dissociation constant as predicted by netMHCpan 4.1. (J) Modeling accuracy for the class I difficult pMHC pairs (see also Figure 2H,I). The two box plots are for models selected by predicted accuracy (“best pLDDT”) and for the best models (“best RMSD”). (K) Score vs accuracy plots for TFold models for the class I difficult pMHC pairs. (See caption for figure 2D for a description of such plots.) (L) MHC sequence mismatch for the best template, for different MHC species and loci. Each point is a pMHC from the class I discovery dataset. (M) Fraction of incorrect registers as predicted by different algorithms for class II pMHCs from the discovery and test datasets, stratified by HLA-DQ vs all other loci. Error bars show 95% confidence intervals (Agresti-Coull estimates). (N) MHC sequence mismatch for the best template, for HLA-DQ vs all other loci or species. Each point is a pMHC from the class II discovery dataset.
Figure 4.
Figure 4.
Results of pMHC modeling for class II structures. (A) Counts of non-redundant pMHCs for different MHC loci and species in the class II dataset. IA and IE denote the two class II mouse loci H2-IA and H2-IE. The dataset only includes human and mouse structures. (B) Cα-сRMSD (alpha-carbon peptide core RMSD) for TFold models in the class II discovery and test datasets. RMSD is computed upon superimposing MHC chains of the model and the experimental structure, and only includes residues of the extended core P0-P9. Results shown for models selected by predicted LDDT (“best pLDDT”) and by peptide RMSD (“best RMSD”). Here and below, box plots show median value and first quartiles, whiskers show the rest of the distribution. Log scale. (C) Fractions of incorrect predictions of peptide registers for class II models in the discovery and test datasets, for different methods. Bars show 95% confidence intervals (Agresti-Coull estimate). p-value is computed by Fisher’s exact test. (D) Score vs accuracy plots for TFold models in the discovery and test datasets. (See caption for figure 2D for a description of such plots.) (E) Detailed diagram of register errors made by different algorithms on the discovery and test datasets. (See caption for figure 2E for a description of such diagrams.) (F) Spearman’s ρ for the predicted vs measured pMHC dissociation constant Kd, for four different prediction algorithms. The test set here consists of Kd measurements for 472 pMHCs with data deposited to IEDB after the netMHCIIpan 4.0 training date. Error bars show the 95% confidence intervals estimated by bootstrap (1000 draws).
Figure 5.
Figure 5.
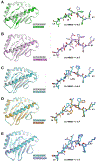
Structures and models of the KLSHQLVLL neoantigen and wild-type peptides bound to HLA-A2. (A) Comparison of the KLSHQLVLL neoantigen peptide/HLA-A2 structure with the TFold model, colored as indicated. The left image shows a structural overview, the right image shows a comparison of the peptide at the atomic level with the Cα RMSD indicated (replicated for all panels below). The TFold model was in excellent agreement with the structure. (B) Comparison of the KLSHQLVLL neoantigen peptide/HLA-A2 structure with the PANDORA model. PANDORA performed less favorably than TFold, mismodeling the peptide’s central bulge as shown. (C) Comparison of the KLSHQLVLL neoantigen peptide/HLA-A2 structure with the KLSHQPVLL wild-type peptide/HLA-A2 structure. The conformations of the two peptides are nearly identical. (D) Comparison of the KLSHQPVLL wild-type peptide/HLA-A2 structure with the TFold model. While the path of the peptide was captured, TFold misplaced the orientation of the proline at position 6. (E) Comparison of the KLSHQPVLL wild-type peptide/HLA-A2 structure with the PANDORA model. Notably, PANDORA made the same error as TFold with regard to the orientation of proline at position 6, although the overall prediction is slightly better.

Update of

Similar articles

Cited by

References

    1. Antunes D, Abella JR, Devaurs D, Rigo MM, Kavraki LE (2018). Structure-based methods for binding mode and binding affinity prediction for peptide-MHC complexes. Curr. Top. Med. Chem. 18(26), 2239–2255, 10.2174/1568026619666181224101744. - DOI - PMC - PubMed
    1. Chaudhury S, Lyskov S, Gray JJ (2010). PyRosetta: a script-based interface for implementing molecular modeling algorithms using Rosetta. Bioinformatics 26, 689–91, 10.1093/bioinformatics/btq007. - DOI - PMC - PubMed
    1. Webb B, Sali A (2016). Comparative protein structure modeling using MODELLER. Curr. Protoc. Bioinformatics 54, 5.6.1–5.6.37, 10.1002/cpbi.3. - DOI - PMC - PubMed
    1. Riley TP, Keller GLJ, Smith AR, Davancaze LM, Arbuiso AG, Devlin JR, Baker BM (2019). Structure based prediction of neoantigen immunogenicity. Front. Immunol. 10, 2047, 10.3389/fimmu.2019.02047. - DOI - PMC - PubMed
    1. Jensen KK, Rantos V, Jappe EC, Olsen TH, Jespersen MC, Lanzarotti E, Mahajan S, Peters B, Nielsen M, Marcatili P, et al. (2019). TCRpMHCmodels: structural modelling of TCR-pMHC class I complexes. Scientific Reports 9, 14530, 10.1038/s41598-019-50932-4. - DOI - PMC - PubMed

Publication types

MeSH terms

Substances

LinkOut - more resources