. 2023 Dec 19;14(1):8434.
doi: 10.1038/s41467-023-43970-0.

Optimized design and in vivo application of optogenetically functionalized Drosophila dopamine receptors

Affiliations

Optimized design and in vivo application of optogenetically functionalized Drosophila dopamine receptors

Fangmin Zhou et al. Nat Commun. .

Abstract

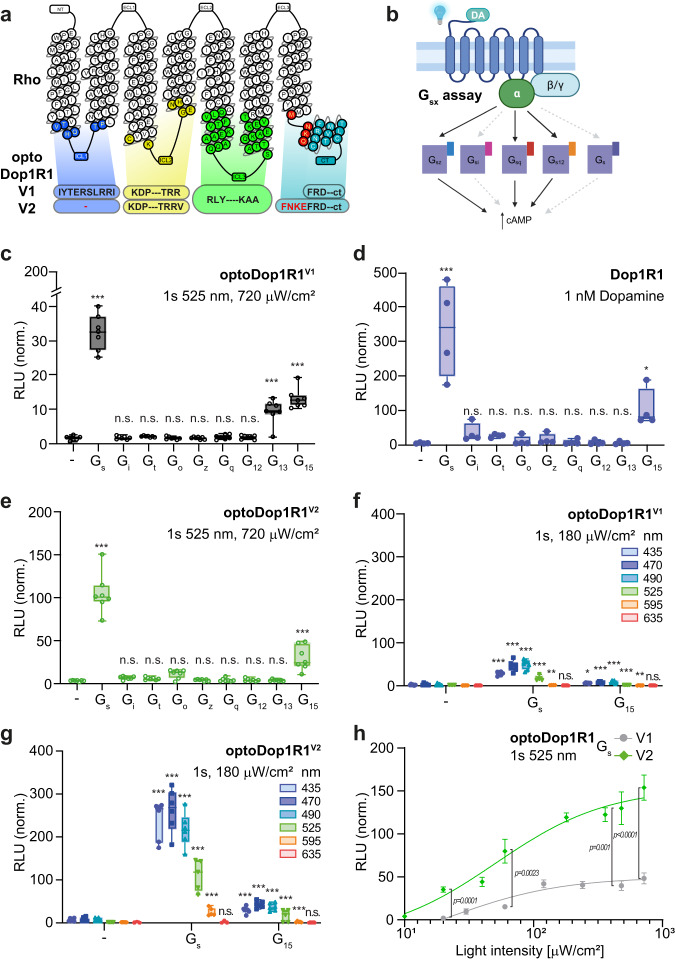
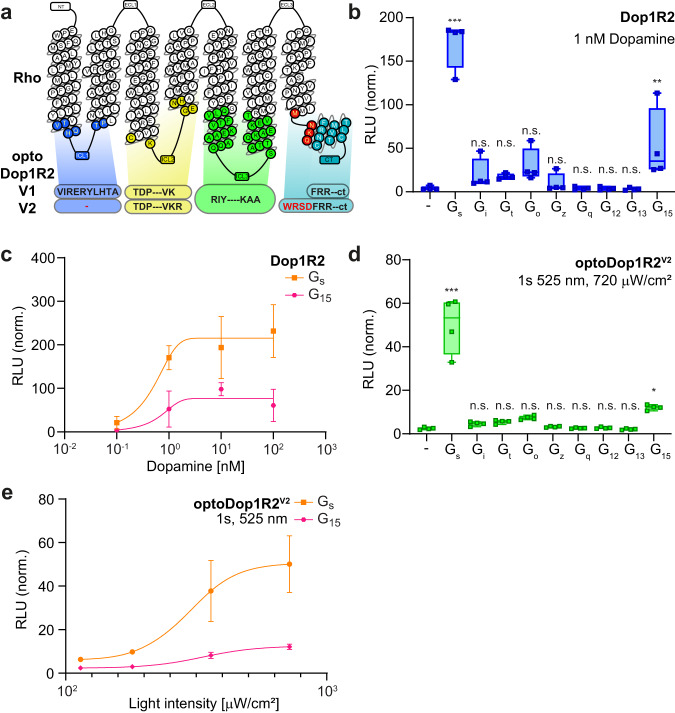
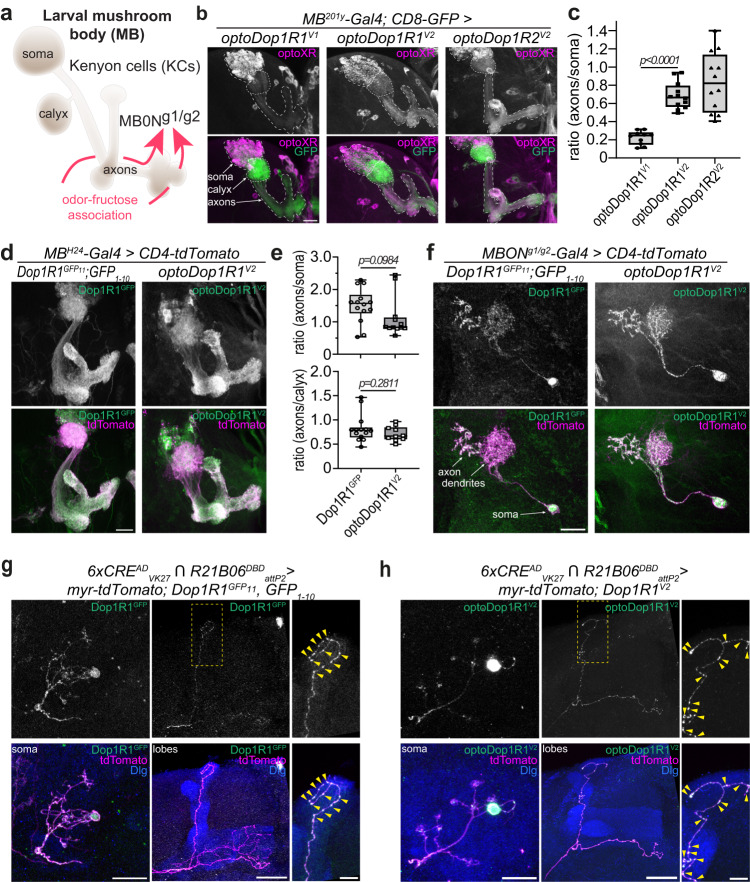
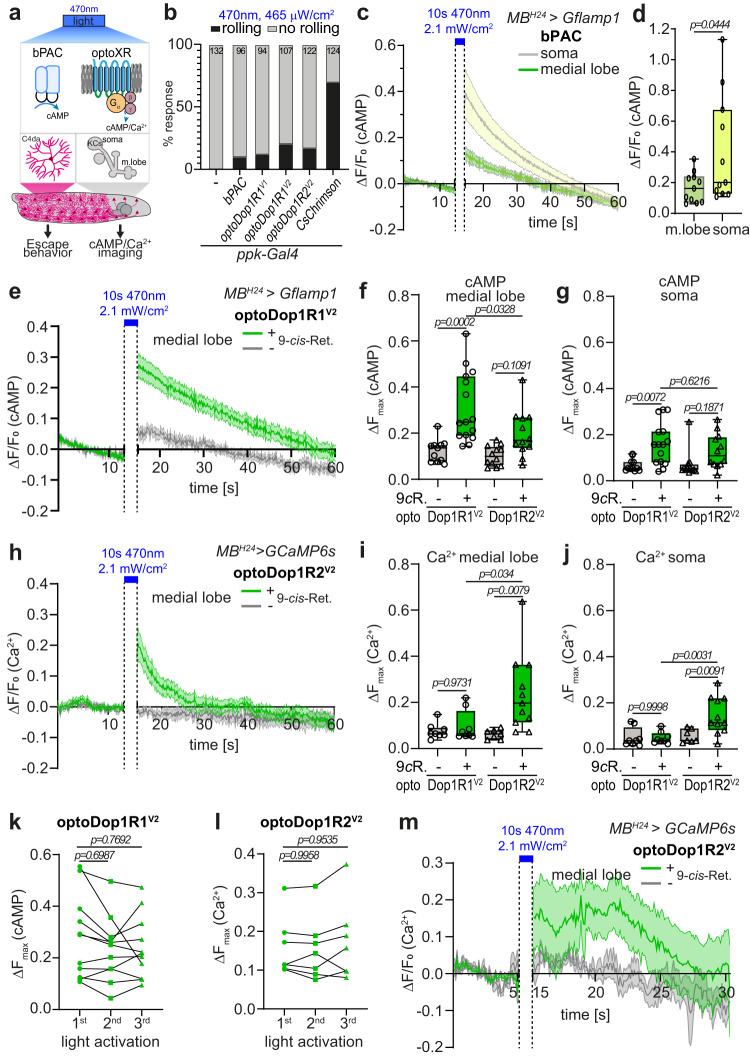
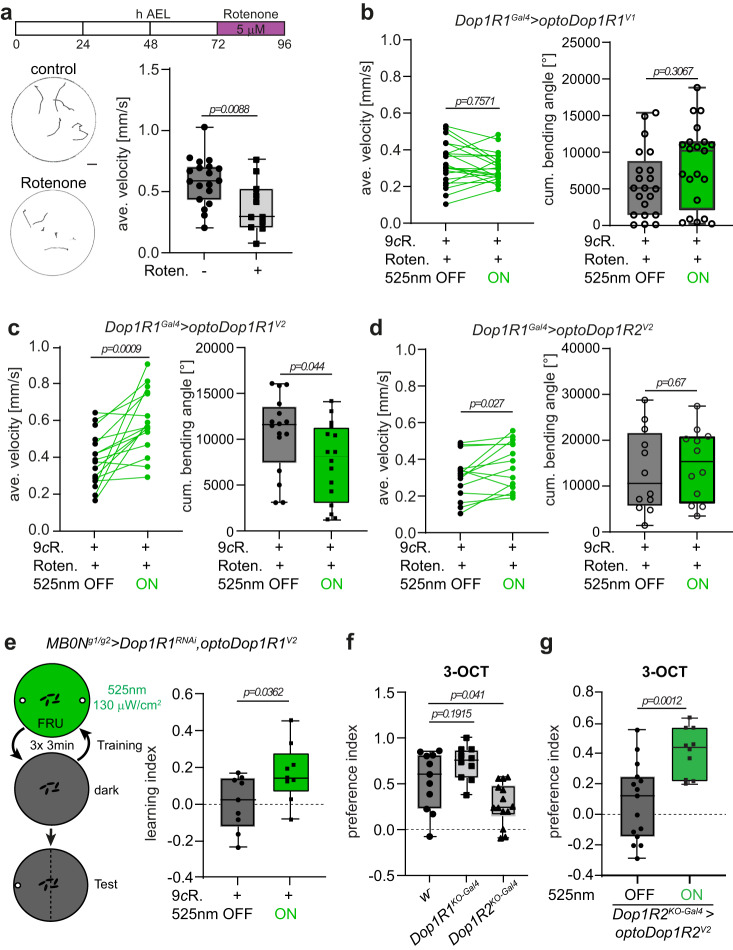
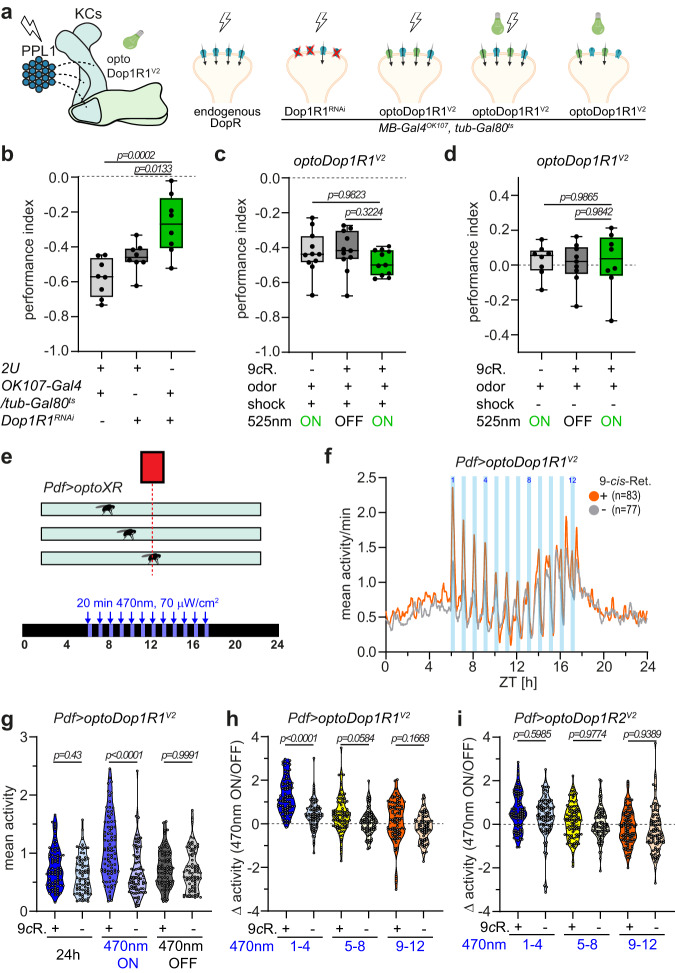
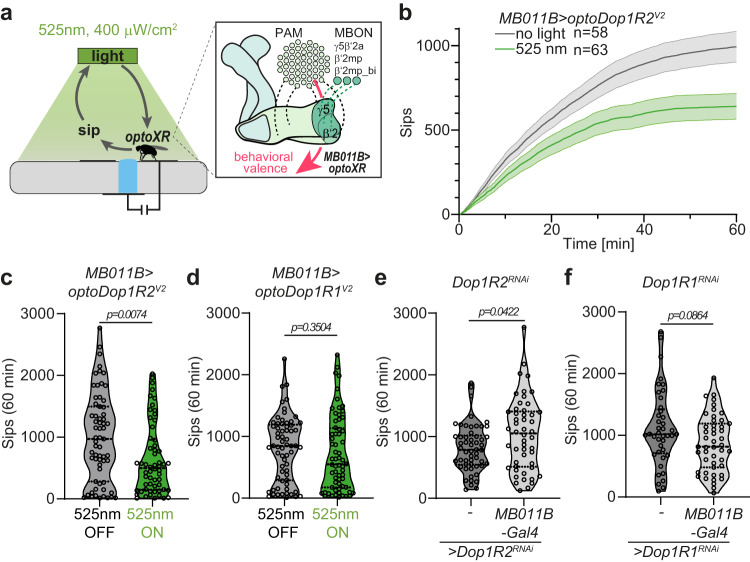
Neuromodulatory signaling via G protein-coupled receptors (GPCRs) plays a pivotal role in regulating neural network function and animal behavior. The recent development of optogenetic tools to induce G protein-mediated signaling provides the promise of acute and cell type-specific manipulation of neuromodulatory signals. However, designing and deploying optogenetically functionalized GPCRs (optoXRs) with accurate specificity and activity to mimic endogenous signaling in vivo remains challenging. Here we optimize the design of optoXRs by considering evolutionary conserved GPCR-G protein interactions and demonstrate the feasibility of this approach using two Drosophila Dopamine receptors (optoDopRs). These optoDopRs exhibit high signaling specificity and light sensitivity in vitro. In vivo, we show receptor and cell type-specific effects of dopaminergic signaling in various behaviors, including the ability of optoDopRs to rescue the loss of the endogenous receptors. This work demonstrates that optoXRs can enable optical control of neuromodulatory receptor-specific signaling in functional and behavioral studies.


Conflict of interest statement

The authors declare no competing interests.

Figures

Fig. 1
Fig. 1. Design and characterization of optoDop1R1V2.
a Schematic overview of optoDop1R1 variants based on the original approach (V1) and the optimized design (V2). b Schematic overview of the GsX assay. Coupling to chimeric Gα subunits (GsX) redirects all G protein signaling to the same cellular response (cAMP). Created with BioRender.com. c G protein-coupling properties of optoDop1R1V1 after activation with light (1 s, 525 nm, 720 μW/cm2). Maximum normalized responses are shown as relative light units (RLU, n = 7, **p < 0.01, ***p < 0.001, one-way ANOVA with Dunnett’s post hoc test). d G protein-coupling properties of Drosophila Dop1R1 with 1nM dopamine. Maximum normalized responses are shown as relative light units (RLU, n = 4, *p < 0.05, ***p < 0.001, one-way ANOVA with Dunnett’s post hoc test). e G protein-coupling properties of improved optoDop1R1V2 after activation with light (1 s, 525 nm, 720 μW/cm2). Maximum normalized responses are shown as relative light units (RLU, n = 7, ***p < 0.001, one-way ANOVA with Dunnett’s post hoc test). f Wavelength-dependent maximum G protein activation of optoDop1R1V1 after activation with light (1 s, 180 μW/cm2, n = 7, *p < 0.05 **p < 0.01, ***p < 0.001, one-way ANOVA with Dunnett’s post hoc test). g Wavelength-dependent maximum G protein coupling of optoDop1R1V2 after activation with light (1 s, 180 μW/cm2, n = 6, ***p < 0.001, one-way ANOVA with Dunnett’s post hoc test). h Light intensity-dependent maximum of cAMP induction (Gs coupling) of optoDop1R1V1 and optoDop1R1V2 after activation with light shown as relative light units (RLU, 1 s, 525 nm, mean ± SEM, optoDop1R1V1: 20 μW/cm2: n = 6, 30/240 μW/cm2: n = 3, 60/480/720 μW/cm2: n = 4, 120 μW/cm2: n = 8; optoDop1R1V2: 10/20/40/360 μW/cm2 n = 6, 60/720 μW/cm2: n = 8, 180 μW/cm2: n = 4; 480 μW/cm2: n = 10; p-values as indicated, unpaired two-tailed Student’s t-test with Welch’s correction). All n indicate the number of independent experiments. All boxplots depict 75th (top), median (central line) and 25th (bottom) percentile, whiskers depict 99th (top) and 1st (bottom) percentile. Source data and statistical details are provided as a Source Data file.
Fig. 2
Fig. 2. Design and characterization of optoDop1R2V2.
a Schematic overview of optoDop1R2V2 design compared to V1. b G protein-coupling properties of Drosophila Dop1R2 with 1nM dopamine. Maximum normalized responses are shown as relative light units (RLU, n = 4, **p < 0.01, ***p < 0.001, one-way ANOVA with Dunnett’s post hoc test). c DA concentration dependent maximum activation of Gs and G15 signaling of Dop1R2 (mean ± SEM, 0.1/10 nM: n = 3; 1.0/100 nM: n = 4). d G protein-coupling properties of optoDop1R2V2 after activation with light (1 s, 525 nm, 720 μW/cm2). Maximum normalized responses are shown as relative light units (RLU, n = 4, *p < 0.05, ***p < 0.001, one-way ANOVA with Dunnett’s post hoc test). e Light intensiy-dependent maximum of Gs and G15 signaling induced by optoDop1R2V2 (1 s, 525 nm, mean ± SEM, n = 4). All n indicate the number of independent experiments. All boxplots depict 75th (top), median (central line) and 25th (bottom) percentile, whiskers depict 99th (top) and 1st (bottom) percentile. Source data and statistical details are provided as a Source Data file.
Fig. 3
Fig. 3. In vivo localization of optoDopRs and endogenous Dop1R1.
a Schematic model of the larval mushroom body consisting of Kenyon cells (KCs) receiving input from dopaminergic neurons and connecting to output neurons (MBONs). Odor-Fructose association and learning require dopaminergic input and MBONg1/g2 (adapted from ref. ). b Immunohistochemistry of optoXRs (anti-Rho labeling) expression in KCs (labeled with CD8-GFP) in the larval mushroom body. Localization of KC somata, calyx (dendrites) and axons are outlined (scale bar: 25 μm). c Quantification of the optoDopR signal intensity ratios of axons/soma (n = 10, 12, 12 samples from 5, 6, 6 biologically independent animals, respectively, unpaired two-tailed Student’s t-test). d Expression of endogenous Dop1R1 and optoDop1R1V2 in the larval mushroom body (scale bars: 25 μm). e Quantification of the Dop1R1 and optoDop1R1 signal intensity ratios of axons/soma and axons/calyx. (n = 14, 10 samples from 7, 5 biologically independent animals, respectively, unpaired two-tailed Student’s t-test). f Labeling of endogenous GFP-tagged Dop1R1 and expression of optoDop1R1V2 (anti-Rho labeling) in MBONg1/g2. Axon terminals, dendrites and soma are indicated and co-labeled by CD4-tdTomato expression (representative image from two independent experiments with multiple samples). Scale bar: 20 µm. g Single-cell labeling of endogenous GFP-tagged Dop1R1 in adult KCs using activity-dependent induction of Gal4 activity. Example of KC labeled with myristoylated(myr)-tdTomato and endogenous Dop1R1GFP (anti-GFP-labeled) in the somatodendritic region, axonal lobes and enlarged axon region (MB labeled by anti-Dlg). Presynaptic varicosities are indicated by arrowheads (representative images from two independent experiments with multiple samples). Scale bars: 10 µm, 20 µm, 5 µm. h Single-cell expression of optoDop1R1V2 in adult MB showing a labeled KC expressing myr-tdTomato and optoDop1R1V2 (anti-Rho labeled) displaying localization to the somatodendritic compartment, axonal lobes and enlarged axon region (MB labeled by anti-Dlg). Presynaptic varicosities are indicated by arrowheads (representative image from two independent experiments with multiple samples). Scale bars: 10 µm, 20 µm, 5 µm. All boxplots depict 75th (top), median (central line) and 25th (bottom) percentile, whiskers depict 99th (top) and 1st (bottom) percentile. Source data and statistical details are provided as a Source Data file.
Fig. 4
Fig. 4. In vivo characterization of optoDopR signaling activity.
a Schematic of of bPAC and optoXRs activation in larval nociceptors (C4da) or Kenyon cells (KCs). cAMP increase in C4da neurons elicits spontaneous larval escape responses. KC expression of GFlamp1 or GCaMP6s was used to image cAMP or Ca2+ responses, respectively. b Spontaneous escape responses (rolling) upon blue light illumination in larvae expressing bPAC, optoXRs, or CsChrimson in larval nociceptors (n animals as indicated). c cAMP responses over time in the larval mushroom body (soma and medial lobe) induced by bPAC activation (mean ± SEM, n = 11, 11 biologically independent samples). d Maximum cAMP responses in the KC soma and MB medial lobe after light-induced activation of bPAC (n = 11, 11 biologically independent samples, unpaired two-tailed Student’s t-test). e cAMP responses in the medial lobe after optoDop1R1V2 activation (mean ± SEM, n = 11, 15 biologically independent samples). f Maximum cAMP responses in the MB medial lobe after light-induced activation of optoDop1R1V2 and optoDop1R2V2 (n = 11, 15, 12, 12 biologically independent samples, one-way ANOVA with Tukey’s post hoc test). g Maximum cAMP responses in the KC soma region after light-induced activation of optoDop1R1V2 and optoDop1R2V2 (n = 11, 15, 12, 12 biologically independent samples, one-way ANOVA with Tukey’s post hoc test). h Calcium imaging in the larval mushroom body of isolated brains using GCaMP6s and optoDop1R2V2 with and without 9-cis-Retinal feeding (mean ± SEM, n = 7, 11 biologically independent samples). i Maximum calcium responses in the MB medial lobe after light-induced activation of optoDop1R1V2 and optoDop1R2V2 (n = 8, 8, 7, 11 biologically independent samples, one-way ANOVA with Tukey’s post hoc test). j Maximum calcium responses in the KC soma region after light-induced activation of optoDop1R1V2 and optoDop1R2V2 (n = 8, 8, 7, 11 biologically independent samples, one-way ANOVA with Tukey’s post hoc test). k Maximum cAMP responses in the MB medial lobe after repeated light-induced activation of optoDop1R1V2 (n = 9 biologically independent samples, one-way ANOVA with Tukey’s post hoc test). l Maximum calcium responses in the MB medial lobe after repeated light-induced activation of optoDop1R2V2 (n = 6 biologically independent samples, one-way ANOVA with Tukey’s post hoc test). m In vivo calcium imaging of the larval mushroom medial lobe using GCaMP6s and light-induced activation of optoDop1R2V2 in animals reared with or without 9-cis-retinal (mean ± SEM, n = 5, 5 animals). All boxplots depict 75th (top), median (central line) and 25th (bottom) percentile, whiskers depict 99th (top) and 1st (bottom) percentile. Source data and statistical details are provided as a Source Data file.
Fig. 5
Fig. 5. Functional validation of optoDopRs in Drosophila larvae in vivo.
a Larvae were fed with 5 μM Rotenone for 24 h at 72 h after egg laying (AEL), inducing locomotion defects due to impaired dopaminergic neuron function. Representative larval tracks of control or Rotenone-fed animals are shown (1 min, scale bar: 10 mm). Quantification of the average velocity of control or Rotenone-fed animals (n = 19, 11 animals, two-tailed unpaired Student’s t-test). b Average velocity and cumulative bending angles of larvae fed with 9-cis-Retinal (9cR) and Rotenone expressing optoDop1R1V1 in an endogenous Dop1R1 pattern (Dop1R1ko-Gal4>optoDop1R1V2) before and during 525 nm light illumination (1 min each, n = 29, 29 animals, two-tailed paired Student’s t-test). c Average velocity and cumulative bending angles of larvae fed with 9-cis-Retinal (9cR) and Rotenone expressing optoDop1R1V2 (Dop1R1ko-Gal4>optoDop1R1V2) before and during 525 nm light illumination (1 min each, n = 12, 16 animals, two-tailed paired Student’s t-test). d Average velocity and cumulative bending angles of larvae fed with 9-cis-Retinal (9cR) and Rotenone expressing optoDop1R2V2 (Dop1R1ko-Gal4>optoDop1R2V2) before and during 525 nm light illumination (1 min each, n = 14, 12 animals, two-tailed paired Student’s t-test). e MBONg1/g2 and Dop1R1-dependent single odor-fructose learning in larvae. Animals expressing optoDop1R1V2 and Dop1R1RNAi in MBONg1/g2 were trained using fructose-odor learning (3x3min) with or without light activation during fructose exposure (3 min 525 nm, 130 μW/cm2). Learning index of 9cR-fed animals with and without light activation during training are shown (n = 9, 9 independent experiments, two-tailed unpaired Student’s t-test). f Innate preference for 3-Octanol (3-OCT) in control (w-), Dop1R1KO-Gal4 and Dop1R2KO-Gal4 3rd instar larvae (n = 11, 10, 14 independent experiments, one-way ANOVA with Tukey’s post hoc test). g Innate preference for 3-OCT in Dop1R2KO-Gal4 3rd instar larvae expressing optoDop1R1V2. Innate preference for 3-OCT in 9cR-fed 3rd instar animals with and without light activation during the assay (n = 15, 10 independent experiments, two-tailed unpaired Student’s t-test). All boxplots depict 75th (top), median (central line) and 25th (bottom) percentile, whiskers depict 99th (top) and 1st (bottom) percentile. Source data and statistical details are provided as a Source Data file.
Fig. 6
Fig. 6. Cell type-specific function of acute Dop1R1 activity in adult flies.
a Schematic of adult mushroom body organization and associative odor-shock learning under different conditions (shock and/or light and altered Dop1R1 activity). Adult flies (OK107-Gal4; tub-Gal80ts; UAS-RNAi/optoXR) for experiments (bd) were shifted to the permissive temperature (31 °C) 4 days prior to the behavioral assay to induce Gal4 expression. b Performance index after aversive odor-shock learning with or without adult-specific RNAi-mediated knockdown of Dop1R1 in Kenyon cells (n = 8 independent experiments, one-way ANOVA with Dunnett’s post hoc test). c Performance index after aversive odor-shock learning with or without additional activation of optoDop1R1V2 in Kenyon cells (n = 11 independent experiments, one-way ANOVA with Dunnett’s post hoc test). d Performance index after pairing odor and optoDop1R1V2 activation in Kenyon cells without shock (n = 8 independent experiments, one-way ANOVA with Dunnett’s post hoc test). e Schematic of activity monitor with flies expressing optoXRs in PDF neurons with daytime-dependent light activation using a blue light stimulus. The gray bar indicates the flies’ subjective day. f Mean activity during 24-h monitoring in flies expressing optoDop1R1V2 in PDF neurons (mean, n = 83, 77 animals). Blue light pulses (12x 20 min, 1/h) during subjective daytime increase fly activity during the morning hours. g Mean activity of Pdf>optoDop1R1V2 -expressing flies during the entire 24 h, all light on and light off phases (n = 83, 77 animals, one-way ANOVA with Tukey’s post hoc test). h Activity difference of flies expressing optoDop1R1V2 in PDF neurons during light on/off times in the morning (1–4), midday (5–8) and afternoon (9–12) (n = 83, 77 animals, one-way ANOVA with Tukey’s post hoc test). i Activity difference of flies expressing optoDop1R2V2 in PDF neurons during light on/off times in the morning (1–4), midday (5–8) and afternoon (9–12) (n = 90 animals, one-way ANOVA with Tukey’s post hoc test). All boxplots depict 75th (top), median (central line) and 25th (bottom) percentile, whiskers depict 99th (top) and 1st (bottom) percentile. All violin plots with single data points depict data distribution. Source data and statistical details are provided as a Source Data file.
Fig. 7
Fig. 7. Cell type-specific function of operant Dop1R2 activity in adult satiety.
a OptoPAD setup allowing light stimulation upon feeding action. Flies expressing optoXRs in a subset of MBONs (MBONγ5β’2a,β2mp and β2mp-bilateral) related to behavioral valence receive a light stimulus (1 s 525 nm 400 μW/cm2) every time they feed on the sucrose drop. b Cumulative sips over time for flies expressing optoDop1R2V2 using MB011B-Gal4 without or with light stimulation (mean ± SEM, n = 58, 63 animals). c Total sips at 60 min for flies expressing optoDop1R2V2 using MB011B-Gal4 without or with light stimulation (n = 58, 63 animals, two-tailed Mann-Whitney test). d Total sips at 60 min for flies expressing optoDop1R1V2 using MB011B-Gal4 without or with light stimulation (n = 65, 65 animals, two-tailed Mann-Whitney test). e Total sips at 60 min for flies expressing Dop1R2RNAi control or with MB011B-Gal4 (n = 54, 50 animals, two-tailed Mann-Whitney test). f Total sips at 60 min for flies expressing Dop1R1RNAi control or with MB011B-Gal4 (n = 41, 47 animals, two-tailed Mann-Whitney test). All boxplots depict 75th (top), median (central line) and 25th (bottom) percentile, whiskers depict 99th (top) and 1st (bottom) percentile. All violin plots with single data points depict data distribution, dotted lines depict 75th (top) and 25th (bottom) percentile, solid central line the median. Source data and statistical details are provided as a Source Data file.

References

    1. Bargmann CI, Marder E. From the connectome to brain function. Nat. Methods. 2013;10:483–490. doi: 10.1038/nmeth.2451. - DOI - PubMed
    1. Klein MO, et al. Dopamine: functions, signaling, and association with neurological diseases. Cell. Mol. Neurobiol. 2018;39:31–59. doi: 10.1007/s10571-018-0632-3. - DOI - PMC - PubMed
    1. Girault JA, Greengard P. The neurobiology of dopamine signaling. Arch. Neurol. 2004;61:641–644. doi: 10.1001/archneur.61.5.641. - DOI - PubMed
    1. Beaulieu JM, Gainetdinov RR. The physiology, signaling, and pharmacology of dopamine receptors. Pharmacol. Rev. 2011;63:182–217. doi: 10.1124/pr.110.002642. - DOI - PubMed
    1. Siju KP, De Backer JF, Grunwald Kadow IC. Dopamine modulation of sensory processing and adaptive behavior in flies. Cell Tissue Res. 2021;383:207–225. doi: 10.1007/s00441-020-03371-x. - DOI - PMC - PubMed

Publication types

MeSH terms

LinkOut - more resources