. 2023 Dec 19;14(1):8353.
doi: 10.1038/s41467-023-43458-x.

High resolution mapping of the tumor microenvironment using integrated single-cell, spatial and in situ analysis

Affiliations

High resolution mapping of the tumor microenvironment using integrated single-cell, spatial and in situ analysis

Amanda Janesick et al. Nat Commun. .

Abstract

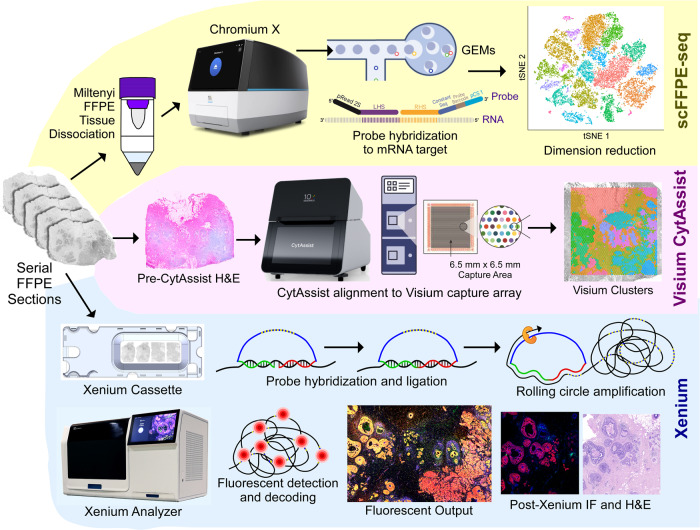
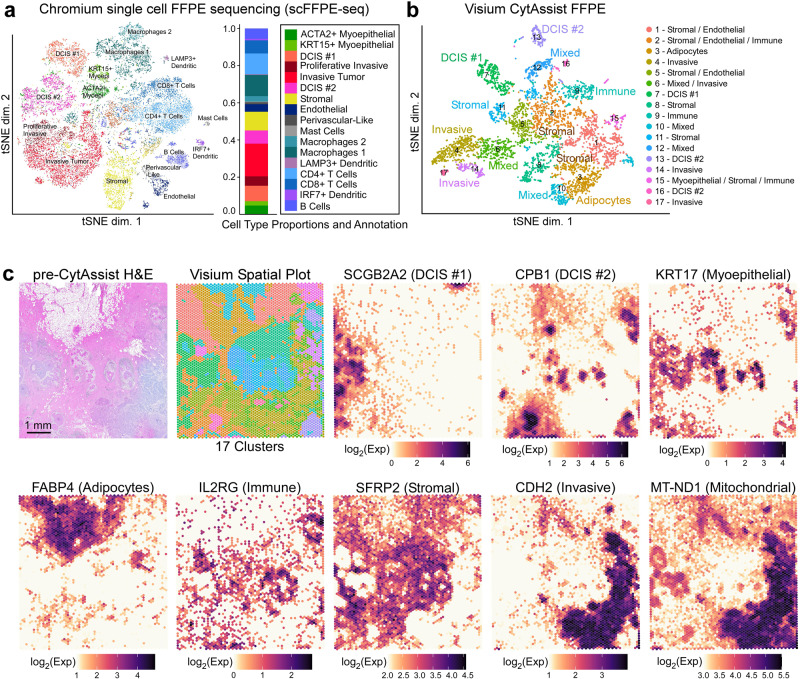
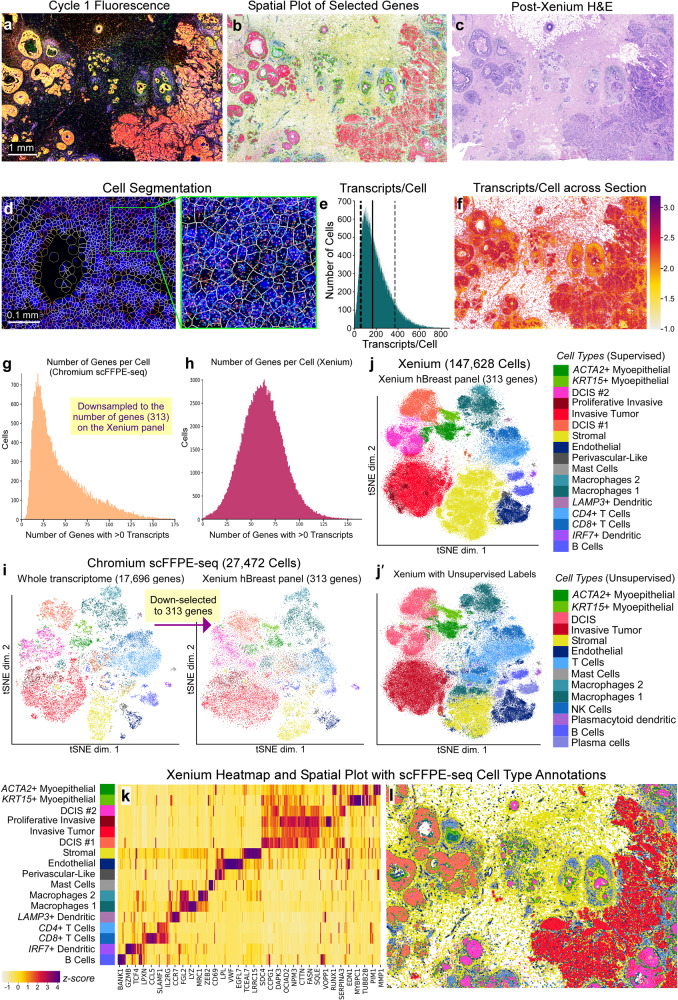
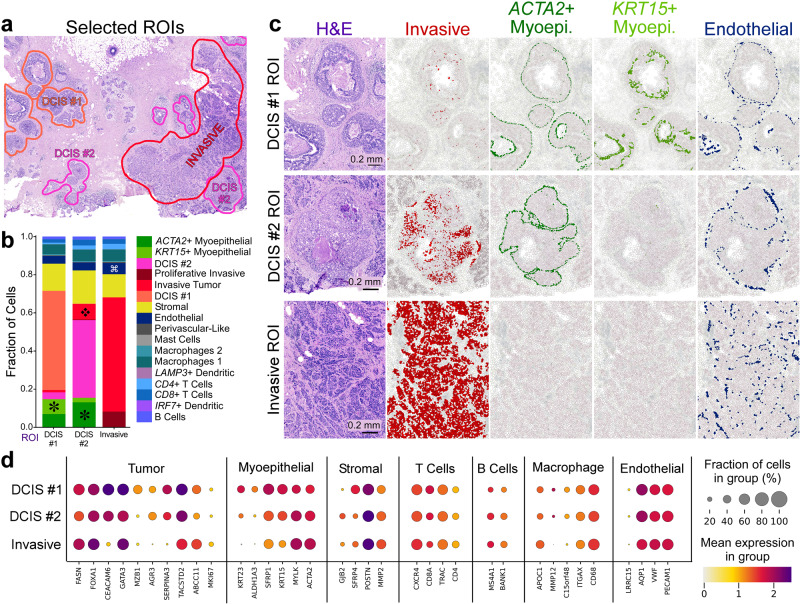
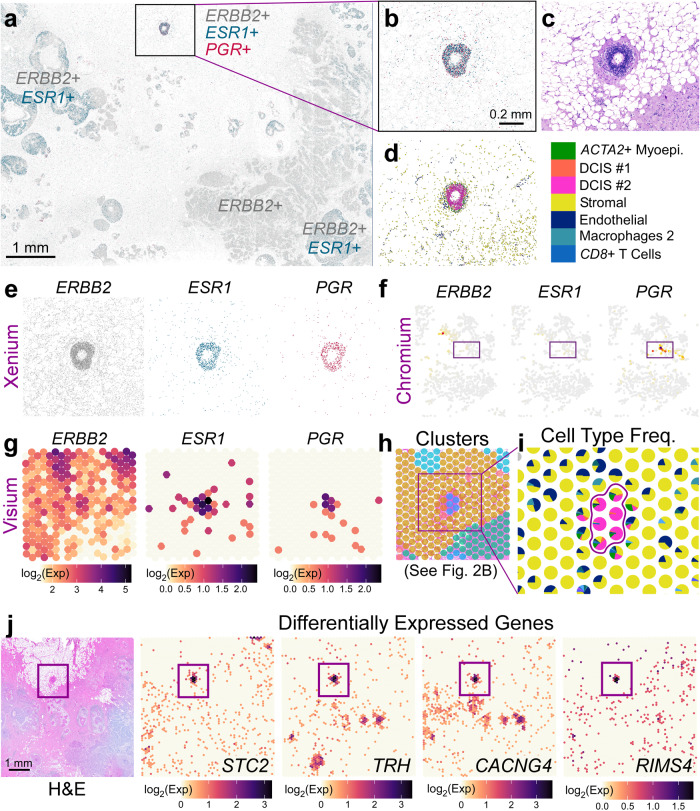
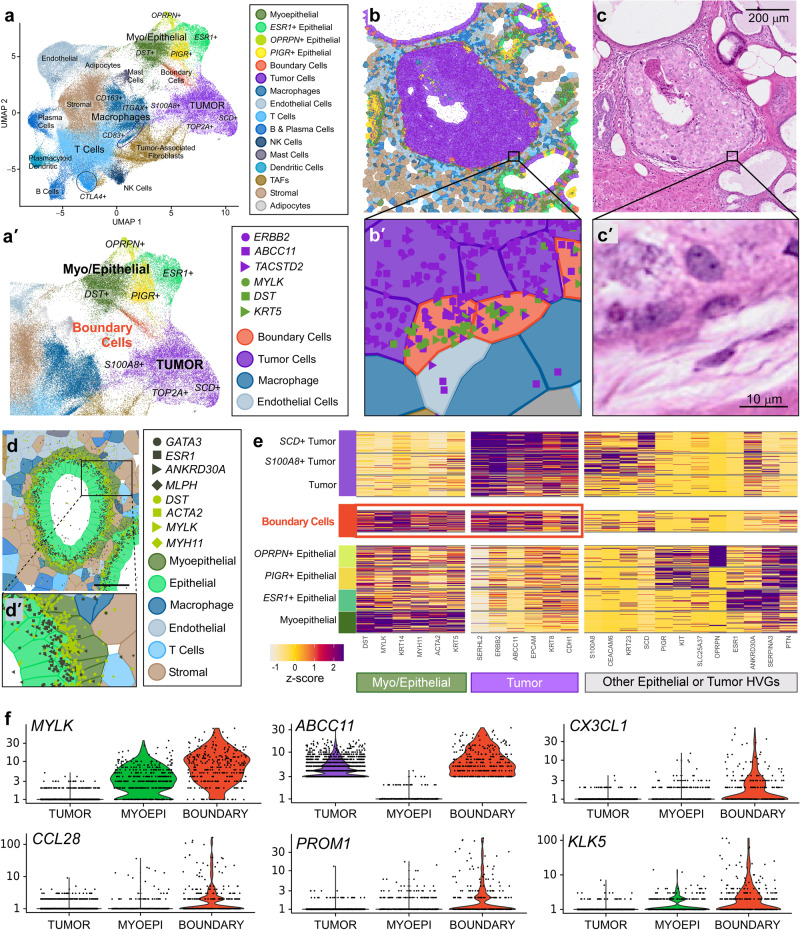
Single-cell and spatial technologies that profile gene expression across a whole tissue are revolutionizing the resolution of molecular states in clinical samples. Current commercially available technologies provide whole transcriptome single-cell, whole transcriptome spatial, or targeted in situ gene expression analysis. Here, we combine these technologies to explore tissue heterogeneity in large, FFPE human breast cancer sections. This integrative approach allowed us to explore molecular differences that exist between distinct tumor regions and to identify biomarkers involved in the progression towards invasive carcinoma. Further, we study cell neighborhoods and identify rare boundary cells that sit at the critical myoepithelial border confining the spread of malignant cells. Here, we demonstrate that each technology alone provides information about molecular signatures relevant to understanding cancer heterogeneity; however, it is the integration of these technologies that leads to deeper insights, ushering in discoveries that will progress oncology research and the development of diagnostics and therapeutics.


Conflict of interest statement

All authors are current or previous employees of 10x Genomics.

Figures

Fig. 1
Fig. 1. Experimental design.
A single FFPE tissue block was analyzed with a trio of complementary technologies. Top: the Chromium Single Cell Gene Expression Flex workflow with the Miltenyi FFPE Tissue Dissociation protocol (scFFPE-seq). Middle: Visium CytAssist enabled whole transcriptome analysis with spatial context, and was readily integrated with single-cell data from serially adjacent FFPE tissue sections. Bottom: The Xenium In Situ technology uses a microscopy based readout. A 5 μm tissue section was sectioned onto a Xenium slide, followed by hybridization and ligation of specific DNA probes to target mRNA, followed by rolling circle amplification. The slide was placed in the Xenium Analyzer instrument for multiple cycles of fluorescent probe hybridization and imaging. Each gene has a unique optical signature, facilitating decoding of the target gene, from which a spatial transcriptomic map was constructed across the entire tissue section. The Xenium data could be easily registered with post-Xenium immunofluorescence (IF)/H&E images (as the workflow is non-destructive to the tissue) and integrated with scFFPE-seq and Visium data. Metrics from these experiments are contained in Supp. Table 1.
Fig. 2
Fig. 2. Characterization of an FFPE-preserved breast cancer sample using whole transcriptome single cell and spatial technologies reveals complex tumor and myoepithelial heterogeneity.
A human breast cancer sample was obtained as an FFPE block (annotated by pathologist as invasive ductal carcinoma) and processed for single cell analysis and spatial transcriptomics as described in Fig. 1. a Dimension reduction of the scFFPE-seq data yielded a t-SNE projection with 17 unsupervised clusters. Each point represents a cell and the colors/labels show annotated cell types. Macrophages 1 cluster is marked by LYZ, IFI30, and ITGAX. Macrophages 2 cluster is marked by SELENOP, F13A1, and RNASE1. b t-SNE projection of Visium spots also identifies 17 clusters. Based on differential gene expression analysis, ten clusters could be unequivocally assigned to cell types, while the others were mixtures of cell types. c H&E staining conducted pre-CytAssist is shown for reference alongside the spatial distribution of clusters in (b). Scale bar = 1 mm. Cell type-specific marker genes are expressed as log2(normalized UMI counts). The Visium data elucidated the spatial location of two molecularly distinct DCIS and invasive subtypes and the general locations of immune, myoepithelial, adipocytes, and stromal cells. Additionally, Visium features mitochondrial probes (e.g., MT-ND1), and their spatial distribution correlates with the invasive region of the tissue section. This experiment was performed in replicate on two serial sections, with one representative section shown here.
Fig. 3
Fig. 3. Xenium data provide extremely high-resolution single-cell information with spatial localization from a targeted panel of genes.
a Maximum intensity projection of RNA fluorescence signal in Cycle 1 from a 5 μm FFPE section. Fifteen of such images (unprojected, original z-stacks), one per cycle, were input into the on-instrument pipeline to decode 313 genes. Scale bar = 1 mm. b Selected genes representing major cell types are shown: stromal (POSTN, yellow), lymphocytes (IL7R, blue), macrophage (ITGAX, turquoise), myoepithelial (ACTA2, KRT15, green), endothelial (VWF, dark blue), DCIS (CEACAM6, pink), and invasive tumor (FASN, red). c H&E staining performed post-Xenium workflow, highlighting the minimal impact of the Xenium assay on tissue integrity. d Deep learning-based cell segmentation assigns individual transcripts to cells. Scale bar = 0.1 mm. e Histogram showing the distribution of transcripts per cell (Q ≥ 20). Dotted lines: 10th percentile = 61 and 90th percentile = 372 median transcripts per cell. Solid line: 50th percentile = 166 median transcripts per cell. f Log10(transcripts per cell) across the entire section. g, h Bar plots showing the number of genes detected per cell for scFFPE-seq (downsampled to the 313 genes on the Xenium panel) compared to Xenium. i t-SNE projection of scFFPE-seq data using all 17,696 genes (left) then down-selected to 313 genes (right). j t-SNE projection of Xenium cells annotated using supervised labels derived from scFFPE-seq data. Cells which were not unambiguously identified in the Xenium data (<50% of the nearest neighbors coming from one cell type) were unlabeled (~14% of cells). j′ t-SNE projection of Xenium cells annotated using unsupervised labels, agnostic to the scFFPE-seq data. k Heatmap representation of the t-SNE j showing the relative expression of genes across different cell types found in the Xenium data. Scale bar is a z-score computed across cell types for each gene by subtracting the mean and dividing by the standard deviation. See Supp. Figure 3 for the corresponding scFFPE-seq heatmap. l Spatial plot with cell type labels transferred. The Xenium experiment was performed in replicate on two serial sections, with one representative section shown here. The scFFPE-seq data is N = 1 due to inherent limitations in using a single block for multiple technologies (see “Methods”).
Fig. 4
Fig. 4. Integrating scFFPE-seq and Xenium data deciphers differences in cell type composition and molecular markers between DCIS subtypes and invasive tumor regions.
a With histology/pathology and scFFPE-seq guidance, we selected three ROIs capturing DCIS #1, DCIS #2, and invasive tumor cell types, and all other cell types in their proximity. b We determined the proportions of 17 cell types within these ROIs. We identified four major differences in cell type composition across the ROIs: asterisk = ACTA2+ and KRT15+ myoepithelial cell populations are distinct in DCIS #1 and DCIS #2 ROIs, but completely absent from invasive tumor ROI; diamond = invasive tumor cells are found within the DCIS #2 ROI; looped square = endothelial cells are found in slightly larger numbers within the invasive ROI. c Validation of the finding in (b). Scale bar = 0.2 mm. d Dot plots showing canonical markers of cell types as well as differentially expressed genes between the tumor subtypes. This experiment was performed in replicate on two serial sections, with one representative section shown here.
Fig. 5
Fig. 5. Visium and Xenium integration derive differentially expressed genes in a triple-positive receptor ROI.
a Xenium spatial plot for ERBB2 (HER2—gray), ESR1 (estrogen receptor—green), and PGR (progesterone receptor—magenta) decoded transcripts. Scale bar = 1 mm. b Closer view of triple-positive ROI. Scale bar = 0.2 mm. c Corresponding H&E image. d Cell types contained within ROI reveal that this is a DCIS #2 tumor epithelium. e Individual Xenium spatial plots from (b). f Chromium scFFPE-seq yields only about 30 cells that are positive for PGR, but these cells do not express ERBB2 or ESR1. g Triple-positive region is identified in Visium (given a priori knowledge from Xenium) and is h part of a distinct cluster (see Fig. 2b). i Spot interpolation (see Supp. Fig. 10) provides cell type frequencies within each Visium spot. Color code legend is shown in (d). j Visium H&E and four representative differentially expressed genes in the tumor epithelium (94 genes; log2FC > 1.5; p-value < 0.05) revealed by Visium data across the whole transcriptome. Scale bar = 1 mm. Differential expression was performed in Loupe Browser (see “Methods”), which performs a variant of the negative binomial exact test (for small gene counts), or a fast asymptotic beta test derived from edgeR (for large gene counts). P-values were adjusted for multiple testing using the Benjamini–Hochberg procedure to control for the false discovery rate. Both the Xenium and Visium experiments were performed in replicate on two serial sections, with one representative section from each technology shown here.
Fig. 6
Fig. 6. Chromium and Xenium integration derive differentially expressed genes in a rare cell type.
a Xenium UMAP for a different biological section (different donor) of invasive ductal carcinoma (Sample #2). Most cell types are driven by a single marker (Supp. Fig. 12). TAFs = Tumor-Associated Fibroblasts. When subclustering the epithelial and myoepithelial populations, we noticed a group of cells situated between tumor and DST+ cells, which we label “boundary” and color red. a′ Zoomed-in view of UMAP from (a) showing myoepithelial and epithelial cell subtypes. b DCIS ROI containing these cells which are viewed close-up in (b′), along with markers for both tumor (purple) and myoepithelial (green) cells. c and c′ Corresponding H&E images. Scale bar = 200 µm in c and 10 µm in (c′). d Normal duct ROI containing myoepithelial and epithelial cells in closer proximity. d′ Zoomed in region of (d) showing minimal comingling of transcripts representing each cell type: myoepithelial (dark green) and epithelial (light green). Scale bar = 50 µm. e Heatmap representation of the UMAP showing relative expression for selected features. HVGs = highly variable genes. Scale bar is a z-score computed across cell types for each gene. Red box highlights that these rare boundary cells express both tumor and myoepithelial markers. The Xenium experiment was performed in replicate on two serial sections, with one representative section shown here. f Using the gene expression profile of the rare boundary cells shown in (e), we identified this cell type (~283 cells) in the scFFPE-seq data of Sample #1 shown in Figs. 1–5. We conducted a differential gene expression analysis of these cells compared to tumor and myoepithelial cells and validated that these cells express both myoepithelial (MYLK) and tumor (ABCC11) markers. We further derived genes CX3CL1, CCL28, PROM1, and KLK5 which are differentially expressed in the boundary cells. Differential expression was performed in Loupe Browser (see “Methods”) which performs a variant of the negative binomial exact test (for small gene counts), or a fast asymptotic beta test derived from edgeR (for large gene counts). P-values are adjusted for multiple testing using the Benjamini–Hochberg procedure to control for the false discovery rate.

References

    1. Zheng GXY, et al. Massively parallel digital transcriptional profiling of single cells. Nat. Commun. 2017;8:14049. doi: 10.1038/ncomms14049. - DOI - PMC - PubMed
    1. Regev A, et al. The human cell atlas. eLife. 2017;6:e27041. doi: 10.7554/eLife.27041. - DOI - PMC - PubMed
    1. He B, et al. Integrating spatial gene expression and breast tumour morphology via deep learning. Nat. Biomed. Eng. 2020;4:827–834. doi: 10.1038/s41551-020-0578-x. - DOI - PubMed
    1. Karlsson M, et al. A single-cell type transcriptomics map of human tissues. Sci. Adv. 2021;7:eabh2169. doi: 10.1126/sciadv.abh2169. - DOI - PMC - PubMed
    1. Eraslan G, et al. Single-nucleus cross-tissue molecular reference maps toward understanding disease gene function. Science. 2022;376:eabl4290. doi: 10.1126/science.abl4290. - DOI - PMC - PubMed

Substances