. 2023 Dec 19;14(1):8043.
doi: 10.1038/s41467-023-43781-3.

Efficient generation of a self-organizing neuromuscular junction model from human pluripotent stem cells

Affiliations

Efficient generation of a self-organizing neuromuscular junction model from human pluripotent stem cells

Alessia Urzi et al. Nat Commun. .

Abstract

The complex neuromuscular network that controls body movements is the target of severe diseases that result in paralysis and death. Here, we report the development of a robust and efficient self-organizing neuromuscular junction (soNMJ) model from human pluripotent stem cells that can be maintained long-term in simple adherent conditions. The timely application of specific patterning signals instructs the simultaneous development and differentiation of position-specific brachial spinal neurons, skeletal muscles, and terminal Schwann cells. High-content imaging reveals self-organized bundles of aligned muscle fibers surrounded by innervating motor neurons that form functional neuromuscular junctions. Optogenetic activation and pharmacological interventions show that the spinal neurons actively instruct the synchronous skeletal muscle contraction. The generation of a soNMJ model from spinal muscular atrophy patient-specific iPSCs reveals that the number of NMJs and muscle contraction is severely affected, resembling the patient's pathology. In the future, the soNMJ model could be used for high-throughput studies in disease modeling and drug development. Thus, this model will allow us to address unmet needs in the neuromuscular disease field.


Conflict of interest statement

MG and AU are co-inventors in patent applications related to the generation of a self-organizing neuromuscular junction cell culture model filed in USA (18/335,765); Singapore (10202301703 V); Canada (P4410CA). The remaining authors declare no competing interests.

Figures

Fig. 1
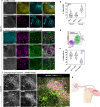
Fig. 1. Generation of self-organizing neural and mesodermal progenitors from human PSCs in adherent culture.
a Schematic representation illustrating the strategy employed to generate the soNMJ model and NPs from hPSCs. b qPCR analysis on day 6 demonstrated that administration of dual SMADi (2SMADi) from day 0 – day 6 resulted in the differentiation of hPSCs to NPs expressing high levels of SOX2, SOX1, NKX1.2 and PAX6. Administration of 2SMADi from day 3 − day 6 was sufficient to generate both NP cells and PSM cells expressing MEOX1, FOXC1, FOXC2 and MYF5. The statistical tests employed included an unpaired t-test with Welch’s correction. *P ≤ 0.05; **P ≤ 0.01; ***P ≤ 0.001; ****P ≤ 0.0001. Each dot with the same colour/shape represents different wells from a single differentiation experiment of a specific cell line. The dashed line is the median value. XM001: N = 3, n = 9; H1: N = 2, n = 6; H9: N = 1, n = 3. Source data are provided as a Source Data file. c Representative brightfield images of NP and NP + PSM cultures at day 6. Circles mark PSM colonies. Scale bars: 100 µm. d Immunofluorescence analysis at day 6 of differentiation showed that exposure to 2SMADi since day 0 resulted in the generation of SOX2+ NPs in the absence of mesodermal cells. Co-expression of PAX3 and SOX2 corresponded to dorsal NPs. Conversely, exposure to 2SMADi after day 3 resulted in the segregation of NMP cells to SOX2+ NPs and PAX3+ PSM cells. e We quantified the number of PAX3+ cells in H1 (37.5% ± 6.6%), H9 (30.6% ± 6.5%) and XM001 (30.6% ± 7.6) lines, and the number of SOX2+ cells in H1 (60.4% ±6.4%), H9 (64% ± 6.7%) and XM001 (71.8% ± 5.6%). The statistical tests employed included one-way ANOVA with Bonferroni’s multiple comparison test. *P ≤ 0.05; **P ≤ 0.01; ***P ≤ 0.001; ****P ≤ 0.0001. Each dot with the same colour/shape represents a sample from a single differentiation experiment of a specific cell line. The dashed line is the median value. XM001: N = 3, n = 9; H1: N = 3, n = 9; H9: N = 3, n = 9. Scale bars: 50 µm. Source data are provided as a Source Data file. f Immunofluorescence analysis at day 20 of differentiation showed that early exposure to 2SMADi from day 0 - day 6 resulted in the generation of TUBB3+ neurons. Exposure to 2SMADi after day 3 resulted in the segregation of NMPs into DESMIN+ myoblast cells and TUBB3+ neurons. The immunofluorescence analysis was performed in the H1, H9 and XM001 cell lines (also see Table S1). Scale bars 75 µm. NPs Neural progenitors, PSM Pre-somitic mesoderm, 2SMADi dual-SMAD-inhibition, soNMJ model: self-organizing neuromuscular junction model.
Fig. 2
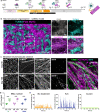
Fig. 2. Generation of position-specific brachial MNs corresponding to the MMC and LMC identity.
a Immunofluorescence analysis at day 20 in the soNMJ model revealed the presence of MYF5+ skeletal muscle progenitors and SOX1+ NPs. The presence of MNs was shown by the expression of ISL1 and ChAT. Scale bars: 75 µm. b Quantification of SOX1+ NPs (20.9% ± 7.6%), MNs expressing ISL1 (18.9% ± 10.1%), and skeletal muscle progenitors expressing MYF5 (58.4% ± 10.7%). ISL1 (H1: N = 3, n = 16; XM001: N = 3; n = 13); SOX1 (H1: N = 2, n = 6; XM001 N = 3; n = 9); MYF5 (H1: N = 2, n = 6; XM001: N = 2; n = 6) Source data are provided as a Source Data file. c Analysis of the MN population at day 20 revealed the presence of brachial MNs co-expressing HOXC6 and ISL1. Both LMC MNs expressing ISL1/FOXP1 and MMC MNs expressing ISL1/LHX3 were present in the soNMJ model. Scale bars: 50 µm. d Schematic illustration of MN columnar organization at the brachial spinal cord. e Quantification of HOXC6+/ISL1+ cells showing a prevalence of brachial MNs in the soNMJ model (80.2% ± 11.9%). Both MMC MNs (72.4% ± 14.4%), characterized by ISL1/LHX3 co-expression, and LMC MNs (25.3% ± 10%), characterized by ISL1/FOXP1 co-expression were present. ISL1 + HOXC6+ (H1: N = 3, n = 11; XM001: N = 3; n = 9; H9: N = 3, n = 9); ISL1 + LHX3+ (H1: N = 3, n = 9; XM001 N = 3; n = 9; H9: N = 1, n = 3); ISL1 + FOXP1+ (H1: N = 3, n = 9; XM001: N = 1; n = 3; H9: N = 2, n = 4). Source data are provided as a Source Data file. f Immunofluorescence analysis of brachial MNs expressing TUBB3, HOXC6, and ChAT at day 50. Scale bars: 50 µm. H1: N = 3, n = 9; XM001: N = 3, n = 9. g Schematic illustration of the neuromuscular connectivity in the human body at the forelimb level. soNMJ model: self-organizing neuromuscular junction model; NPs: neural progenitors; MNs: motor neurons; MMC: median motor column; LMC: lateral motor column.
Fig. 3
Fig. 3. Formation of functional NMJs in the soNMJ model.
a Schematic illustration of the strategy used to generate the soNMJ model from hPSCs under adherent culture conditions. b High-content imaging of whole well at day 50 soNMJ model. The representative image depicts the self-organization of the neurons TUBB3+ (cyan) and skeletal muscle fibers that express Fast MyHC (magenta) in 20 fields acquired in the same well. Scale bars: 1 mm and 100 µm. H1: N = 1; H9: N = 1; XM001: N = 1. c Representative immunofluorescence image at day 50 and day 100 of differentiation showing the presence of TUBB3+ neurites in contact with α-bungarotoxin+ (αBTX+) AChR clusters on fast-twitch skeletal muscle fibers (Fast MyHC+) revealing the presence of neuromuscular junctions. Scale bars: 25 µm. d Quantification of the number of αBTX clusters at day 50 and day 100 of hPSC differentiation normalized to the number of Fast MyHC myofibers. The number of NMJs increased significantly from day 50 (H1: 0,419 ± 0,048; H9: 0,435 ± 0,067; XM001: 0,447 ± 0,051) to day 100 (H1: 0,832 ± 0,09; H9: 0,872 ± 0,099; XM001: 0,861 ± 0,059). The statistical tests employed included unpaired t-test with Welch’s correction. *P ≤ 0.05; **P ≤ 0.01; ***P ≤ 0.001; ****P ≤ 0.0001. Each dot with the same colour/shape represents the number of NMJs in a well from a single differentiation experiment of a specific cell line. The different colours correspond to different cell lines and the different shapes to different experiments (N). H1: N = 3, n = 9; H9: N = 3, n = 9; XM001: N = 3, n = 9. Source data are provided as a Source Data file. e At day 100 of differentiation, there was a spontaneous contraction of the skeletal muscles. Contraction analysis by live imaging showed that muscle contraction was increased by administering 10 μM acetylcholine and blocked by adding the acetylcholine receptor inhibitor, curare (10 μM). H1: N = 3, n = 9; XM001: N = 9, n = 27. soNMJ: self-organizing neuromuscular junction. Source data are provided as a Source Data file.
Fig. 4
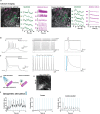
Fig. 4. Functional characterization of the soNMJ model.
a The neuromuscular cultures were incubated with Fluo8-AM at day 75 for visualizing calcium transients with a spinning disk confocal microscope. Representative frames are shown for both spontaneous and 10 µM curare conditions. Individual neurons and muscle cells were identified by their morphology, and their calcium transients were plotted separately. Administration of 10 μM curare blocked the calcium activity in the skeletal muscle fibers but not in the neurons, supporting that the muscle contraction was driven by the neurons through the NMJs. Scale bars: 50 µm. H1: N = 2; XM001: N = 1. Source data are provided as a Source Data file. b Current clamp recording from a neuron transduced with an AAV encoding hSYN:NLS-GFP to label neuronal nuclei. The static current injection caused spontaneous action potential firing, while 10 Hz stimulation with brief square pulses revealed the potential for the repetitive firing of the neurons. Inset shows the first action potential. c Current clamp recording from a neuron transduced with an AAV encoding hSYN:ChR2(H134R)-GFP. The neuron reliably fired action potentials in response to 0.5 ms blue light (470 nm) flashes delivered at 2 Hz. Inset shows the first light-evoked action potential. d schematic representation of the optogenetic experiments. Neurons transduced with an AAV encoding hSYN:ChR2(H134R)-GFP were stimulated with blue light to drive the contraction of the skeletal muscle cells. e Immunofluorescence image of day 75 soNMJ culture model showing neurons expressing ChR2-GFP 3 weeks post-transduction with an AAV encoding hSYN:ChR2(H134R)-GFP. Scale bars: 100 µm. H1: N = 1; XM001: N = 2. Source data are provided as a Source Data file. f Optogenetic analysis of the soNMJ model at day 75. Every stimulation of ChR2-GFP+ neurons by 470 nm light pulse resulted in the concomitant contraction of the skeletal muscle cells. Exposure to 10 μM curare blocked the neural transmission at the NMJs resulting in the inhibition of muscle contraction even upon optogenetic stimulation. The muscle contraction response to blue light stimulation of the neurons was restored by washing out curare.
Fig. 5
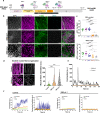
Fig. 5. Generation of an all human SMA soNMJ model.
a Schematic illustration of the soNMJ differentiation from SMA type I hiPSCs. b Representative images of αBTX clusters in SMA iPSC derived soNMJs and control at day 50 of differentiation. Scale bars: 75 µm. c Quantifications at day 50 of the αBTX+ clusters revealed a significant reduction in the number and size of αBTX clusters in the SMA type I soNMJ cultures compared to H1, H9, and XM001 control lines. The statistical tests employed included one-way ANOVA with Bonferroni’s multiple comparison test. *P ≤ 0.05; **P ≤ 0.01; ***P ≤ 0.001; ****P ≤ 0.0001. Each dot with the same colour/shape represents the number of NMJs in a well from a single differentiation experiment of a specific cell line. The different colours correspond to different cell lines and the different shapes to different experiments (N). H1: N = 3, n = 9; H9: N = 3, n = 9; XM001: N = 3, n = 9; SMA pt.1: N = 3, n = 9; SMA pt.2: N = 3, n = 9. d Immunofluorescence analysis using Fast MyHC marker at day 50 showed compromised skeletal muscle fiber organization in the two SMA type I hiPSC lines compared to H1 hPSC control. Results are shown as the angle of deviation of each individual fiber from the average fiber orientation. H1: N = 3, n = 9; SMApt1: N = 3, n = 9; SMApt2 N = 3, n = 9. Scale bars: 10 µm. e Skeletal muscle contraction was impaired in SMA type I compared to XM001 control hiPSC line at day 50 of differentiation. H1: N = 3, n = 9; XM001: N = 3, n = 9; SMA pt1: N = 3, n = 9. f Muscle contraction analyzed in SMA type I at day 50 did not respond to 10 μM acetylcholine and 10 μM curare administration compared to H1 hPSC control line. hiPSCs: Human induced pluripotent stem cells; soNMJ: self-organizing neuromuscular junction.

References

    1. Sances S, et al. Modeling ALS with motor neurons derived from human induced pluripotent stem cells. Nat. Neurosci. 2016;19:542–553. doi: 10.1038/nn.4273. - DOI - PMC - PubMed
    1. Chal J, et al. Generation of human muscle fibers and satellite-like cells from human pluripotent stem cells in vitro. Nat. Protoc. 2016;11:1833–1850. doi: 10.1038/nprot.2016.110. - DOI - PubMed
    1. Chal J, et al. Differentiation of pluripotent stem cells to muscle fiber to model Duchenne muscular dystrophy. Nat. Biotechnol. 2015;33:962–969. doi: 10.1038/nbt.3297. - DOI - PubMed
    1. Maury Y, et al. Combinatorial analysis of developmental cues efficiently converts human pluripotent stem cells into multiple neuronal subtypes. Nat. Biotechnol. 2015;33:89–96. doi: 10.1038/nbt.3049. - DOI - PubMed
    1. Mouilleau, V. et al. Dynamic extrinsic pacing of the HOX clock in human axial progenitors controls motor neuron subtype specification. Development148. 10.1242/dev.194514 (2021). - PMC - PubMed

Publication types

MeSH terms