. 2023 Dec 19;14(1):8438.
doi: 10.1038/s41467-023-44221-y.

A type VII-secreted lipase toxin with reverse domain arrangement

Affiliations

A type VII-secreted lipase toxin with reverse domain arrangement

Stephen R Garrett et al. Nat Commun. .

Abstract

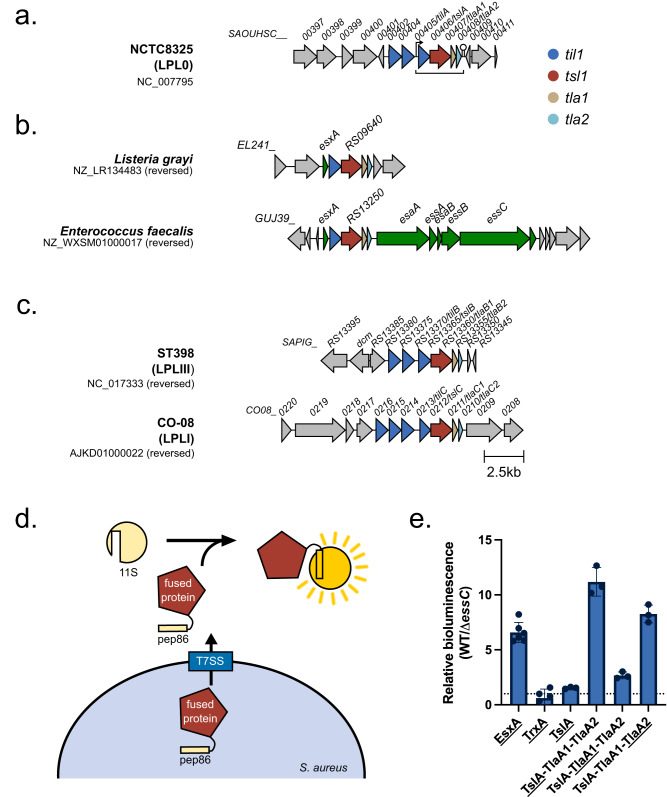
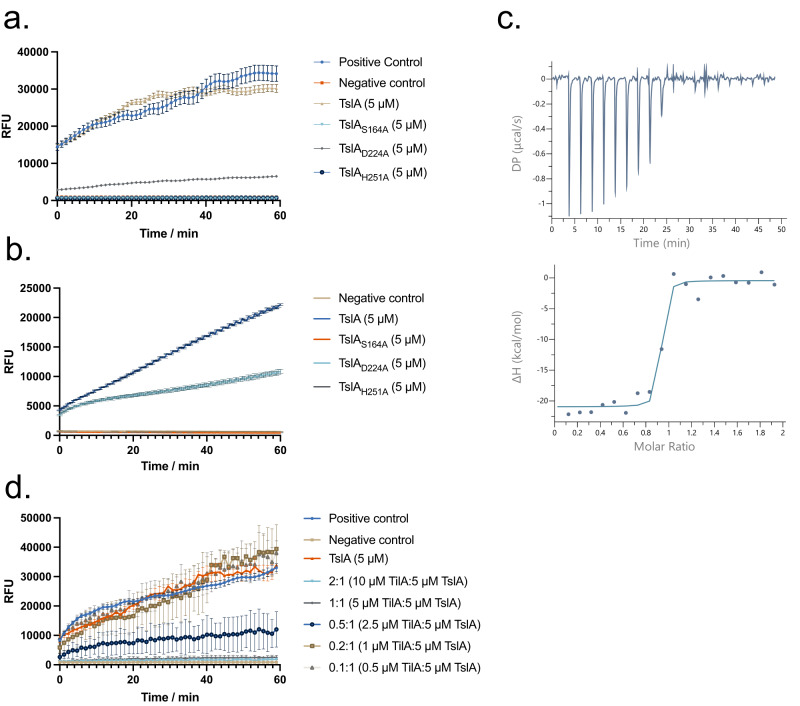
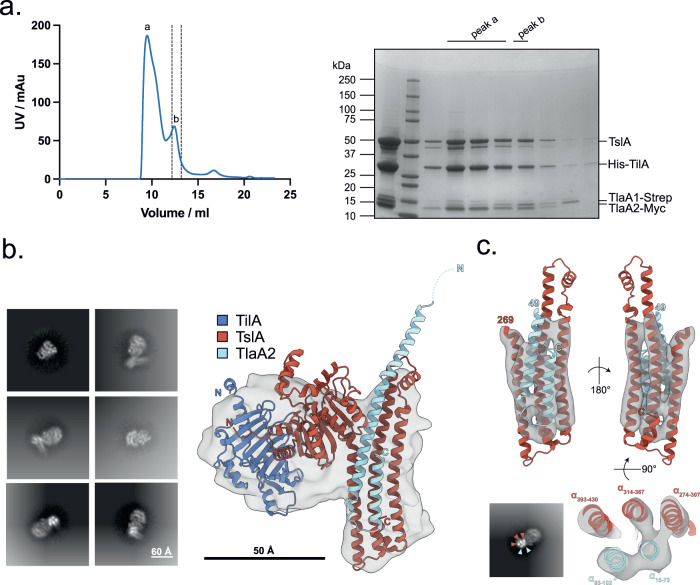
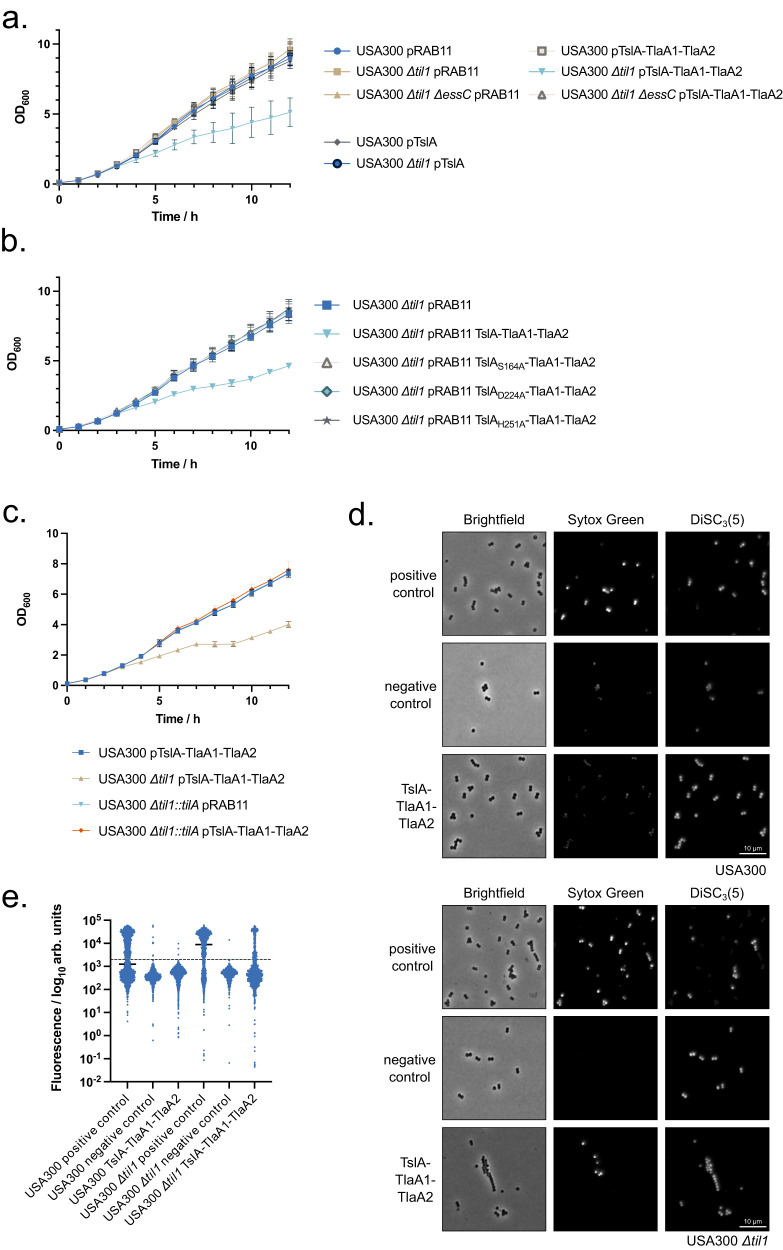
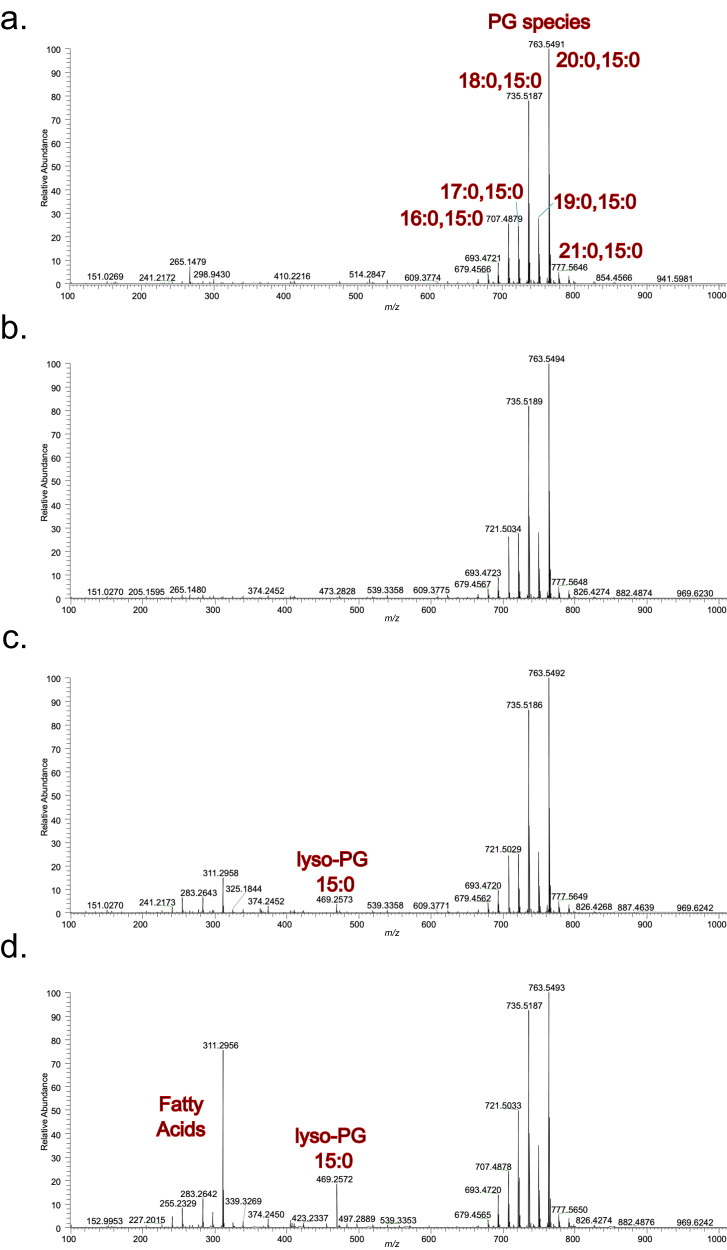
The type VII protein secretion system (T7SS) is found in many Gram-positive bacteria and in pathogenic mycobacteria. All T7SS substrate proteins described to date share a common helical domain architecture at the N-terminus that typically interacts with other helical partner proteins, forming a composite signal sequence for targeting to the T7SS. The C-terminal domains are functionally diverse and in Gram-positive bacteria such as Staphylococcus aureus often specify toxic anti-bacterial activity. Here we describe the first example of a class of T7 substrate, TslA, that has a reverse domain organisation. TslA is widely found across Bacillota including Staphylococcus, Enterococcus and Listeria. We show that the S. aureus TslA N-terminal domain is a phospholipase A with anti-staphylococcal activity that is neutralised by the immunity lipoprotein TilA. Two small helical partner proteins, TlaA1 and TlaA2 are essential for T7-dependent secretion of TslA and at least one of these interacts with the TslA C-terminal domain to form a helical stack. Cryo-EM analysis of purified TslA complexes indicate that they share structural similarity with canonical T7 substrates. Our findings suggest that the T7SS has the capacity to recognise a secretion signal present at either end of a substrate.


Conflict of interest statement

The authors declare no competing interests.

Figures

Fig. 1
Fig. 1. SAOUHSC_00406/TslA is encoded at a conserved gene cluster and secreted by the T7SS.
a SAOUHSC_00406/TslA is encoded on the νSaα island, at a locus also known as the LPL0 lipoprotein gene cluster. A variable number of SAOUHSC_00405/TilA homologues are encoded upstream of this cluster across different S. aureus strains, in RN6390 there are two (SAOUHSC_00402 and SAOUHSC_00404). b The four gene cassette is encoded in Listeria grayi and enterococcal genomes. c Homologues of SAOUHSC_00406/tslA can be found at a further two loci, LPLI and LPLIII, in a strain-dependent manner. Where strains do not encode a paralogue, the tla1 (SAOUHSC_00407-like) and tla2 (SAOUHSC_00408-like) genes are also absent, but variable numbers of til1 (SAOUHSC_00405-like) genes are present. To date no SAOUHSC_00406 paralogue is found at the LPLII locus which always appears to encode a single, phylogenetically diverse Til1 protein (see also Supplementary Fig. 7). d Schematic representation of the split nanoluciferase assay to detect T7SS-dependent secretion. e The pep86 fragment of nanoluciferase was fused to the indicated protein of interest (denoted with an underline) and expressed from plasmid pRAB11 in strain USA300 or an otherwise isogenic essC mutant as described in the methods. To 100 µl of whole cell samples, 11S fragment of nanoluciferase and furimazine were added, and luminescence readings taken over a 10 min time course. Peak readings were used to calculate relative luminescence of the wild type compared to the essC mutant strain as described in the methods. Data are presented as the mean ± SD (n = 3 biologically independent experiments). Readings for supernatant and cytoplasmic fractions from these samples are displayed in Supplementary Fig. 3a, b and the raw data from these experiments is shown in Supplementary Fig. 4. Source data are provided as a Source Data file.
Fig. 2
Fig. 2. TslA has ‘reverse’ LXG architecture but can interact with Lap-like proteins.
a Structural model of TslA obtained from the AlphaFold Database. The N- terminus is indicated. The inset shows the predicted active site. b The LXG-like C-terminus of TslA (maroon) aligned with the S. intermedius LXG protein, TelC (obtained from the AlphaFold Database and shown in gold). The inset depicts the L-X-G motif of TelC (yellow) and the G-X-L motif of TslA (red). c Model of the complex composed of TilA (blue), TslA (maroon), TlaA1 (beige), TlaA2 (pale blue) generated with AlphaFold Colab. The predicted alignment error for the model is provided, with the sequence order being the same as the order listed above. d Size exclusion chromatogram of TslACT-TlaA1-TlaA2 containing fractions that had been previously co-purified by Ni-affinity chromatography followed by Streptactin affinity chromatography. This experiment has been performed three times, with similar results observed for each. AU—absorbance units. e SDS PAGE analysis of the indicated peak fractions from (d). f The protein fraction indicated with an asterisk in (e) was analysed by western blotting with anti-TslA, anti-Strep and anti-Myc antibodies, as indicated. This experiment has been performed twice, each with similar results. The uncropped blots from (f) can be found in Supplementary Fig. 10.
Fig. 3
Fig. 3. TslA has phospholipase A1 activity, which is inhibited by the immunity protein, TilA.
a, b Purified TslA and TslA with point mutants in the active site were incubated with (a) the PLA1 substrate PED-A1 or (b) the PLA2 substrate PED6. Fluorescence released upon substrate hydrolysis was measured at 515 nm over the course of 1 h. Data are presented as the mean ± SD. RFU—relative fluorescence units. c Calorimetric titration of TslA with TilA. (Upper) Raw data for the heat effect during titration. DP—differential power. (Lower) Binding isotherm. The best fit to the data gave n = 0.88 ± 0.01 binding sites, ΔH = −20.5 ± 0.8 kcal mol−1. d Hydrolysis of PED-A1 mediated by TslA alone, TilA alone or TslA and TilA at the indicated molar ratios. Negative control values were subtracted from each condition. The data presented in (a), (b) and (d) is n = 3 technical replicates. These experiments were repeated three times, with similar results observed each time. Error bars are ± SD. Source data are provided as a Source Data file.
Fig. 4
Fig. 4. TslA forms a complex with TilA, TlaA1 and TlaA2.
a Copurification of TilA, TsIA, TIaA1 and TlaA2. (Left) SEC of the His-TilA-TslA-TlaA1-Strep-TlaA2-Myc complex following prior purification via HisTrap and StrepTrap affinity chromatography and (right) SDS PAGE analysis of peak fractions a and b from SEC. This experiment has been performed once. Peak fraction b was used for cryo-EM. AU—absorbance units. b 2D class averages (left) and 7.3 Å cryo-EM volume of TilA-TslA-TlaA2 complex (grey) with AlphaFold model docked into density at low contour level (right). c Side view of C-terminal TslA and TlaA2 α-helices docked into the same cryo-EM volume but at higher contour level (top). 2D class average demonstrating strong density for C-terminal TslA and TlaA2 α-helices coloured by subunit (bottom left) and slab view showing positioning of TslA and TlaA2 α-helices into cryo-EM density (bottom right). Residues corresponding to each α-helix are labelled.
Fig. 5
Fig. 5. TslA causes membrane damage to S. aureus cells in the absence of Til1 immunity proteins, in a T7SS-dependent manner.
ac the indicated strain and plasmid combinations were cultured for 2 h, after which 500 ng ml−1 ATc was added to induce plasmid-encoded gene expression. OD600 readings, in triplicate, were taken manually every hour. The experiment was repeated three times and each point is an average of 3 biological and 3 technical replicates. Data are presented as mean values ± SD and n = 3 independent biological experiments. d. USA300 and USA300 Δtil1 harbouring pRAB11 or pRAB11 encoding TslA-TlaA1-TlaA2 were cultured with ATc for 1 h 50 min, after which an aliquot of USA300/pRAB11 and USA300 Δtil1/pRAB11 were treated with 10 μM melittin for 5 min. Subsequently, all samples were stained with 200 nM Sytox green and 2 μM DiSC3(5), spotted onto an agarose pad and imaged by fluorescence microscopy. Representative fields of view, avoiding large clusters of cells are displayed. This experiment was repeated three times, each with similar results. Source data are provided on Figshare (10.6084/m9.figshare.24648513). e. Fluorescence intensity of Sytox green for individual cells from each group plotted on a log10 axis. At least 100 cells were analysed for each condition, pooled across three biological replicates. The exact number of cells analysed is provided in the Source Data file. Note that due to signal saturation in some fields, quantitative analysis could not be performed. Cells are therefore placed into high and low groups based on negative control values, depicted by the dashed line. The percentage of cells in each group with membrane damage is given in Supplementary Table 2.
Fig. 6
Fig. 6. Analysis of S. aureus membrane lipids following intoxication by TslA.
USA300 and USA300 Δtil1 harbouring pRAB11 encoding TslA-TlaA1-TlaA2, were cultured for 2 h after which 500 ng ml−1 ATc was added to induce plasmid-encoded gene expression. Samples were subsequently withdrawn at 2 and 6 h post-induction and membranes prepared as described in methods. Mass spectrometric analysis, in negative ion mode (100-1000 m/z) was carried out on membranes for a. USA300 pRAB11 and b. USA300 TslA-TlaA1-TlaA2 after 2 h post-induction, c. USA300 Δtil1 TslA-TlaA1-TlaA2 after 2 h post-induction and d. USA300 Δtil1 TslA-TlaA1-TlaA2 after 6 h post induction.
Fig. 7
Fig. 7. TslA does not play a significant role in virulence in a murine skin abscess model.
Skin abscesses were induced by mixing 5 × 10⁴ cells of each indicated strain with an equal volume of cytodex beads and inoculating into the flanks of mice. Abscesses were excised after 48 h, and c.f.u were enumerated. One-way ANOVA, assuming Gaussian distribution and equal SD was used to determine statistical significance. Multiple comparison of each strain against the wild type was used to demonstrate deviation from the control (n.s. p > 0.05; *p < 0.05). The p-values are as follows for wild type v.: til1 = 0.0392; essC = 0.0197; tslA = 0.1622. n = 10 abscesses per condition. CFU – colony forming units. Source data are provided as a Source Data file.

References

    1. Tsirigotaki A, De Geyter J, Sostaric N, Economou A, Karamanou S. Protein export through the bacterial Sec pathway. Nat. Rev. Microbiol. 2017;15:21–36. doi: 10.1038/nrmicro.2016.161. - DOI - PubMed
    1. Palmer T, Stansfeld PJ. Targeting of proteins to the twin-arginine translocation pathway. Mol. Microbiol. 2020;113:861–871. doi: 10.1111/mmi.14461. - DOI - PMC - PubMed
    1. Bunduc CM, et al. Structure and dynamics of a mycobacterial type VII secretion system. Nature. 2021;593:445–448. doi: 10.1038/s41586-021-03517-z. - DOI - PMC - PubMed
    1. Rivera-Calzada A, Famelis N, Llorca O, Geibel S, Type VII. secretion systems: structure, functions and transport models. Nat. Rev. Microbiol. 2021;19:567–584. doi: 10.1038/s41579-021-00560-5. - DOI - PubMed
    1. Abdallah AM, et al. Type VII secretion-mycobacteria show the way. Nat. Rev. Microbiol. 2007;5:883–891. doi: 10.1038/nrmicro1773. - DOI - PubMed

Publication types

MeSH terms