. 2023 Dec 18;14(1):8406.
doi: 10.1038/s41467-023-44162-6.

High-throughput deconvolution of 3D organoid dynamics at cellular resolution for cancer pharmacology with Cellos

Affiliations

High-throughput deconvolution of 3D organoid dynamics at cellular resolution for cancer pharmacology with Cellos

Patience Mukashyaka et al. Nat Commun. .

Abstract

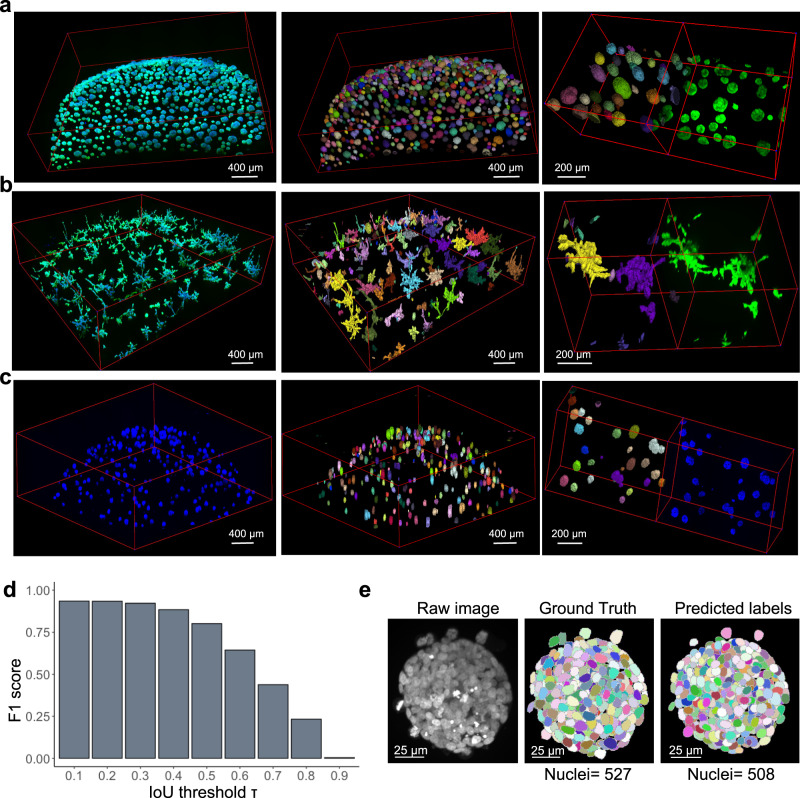
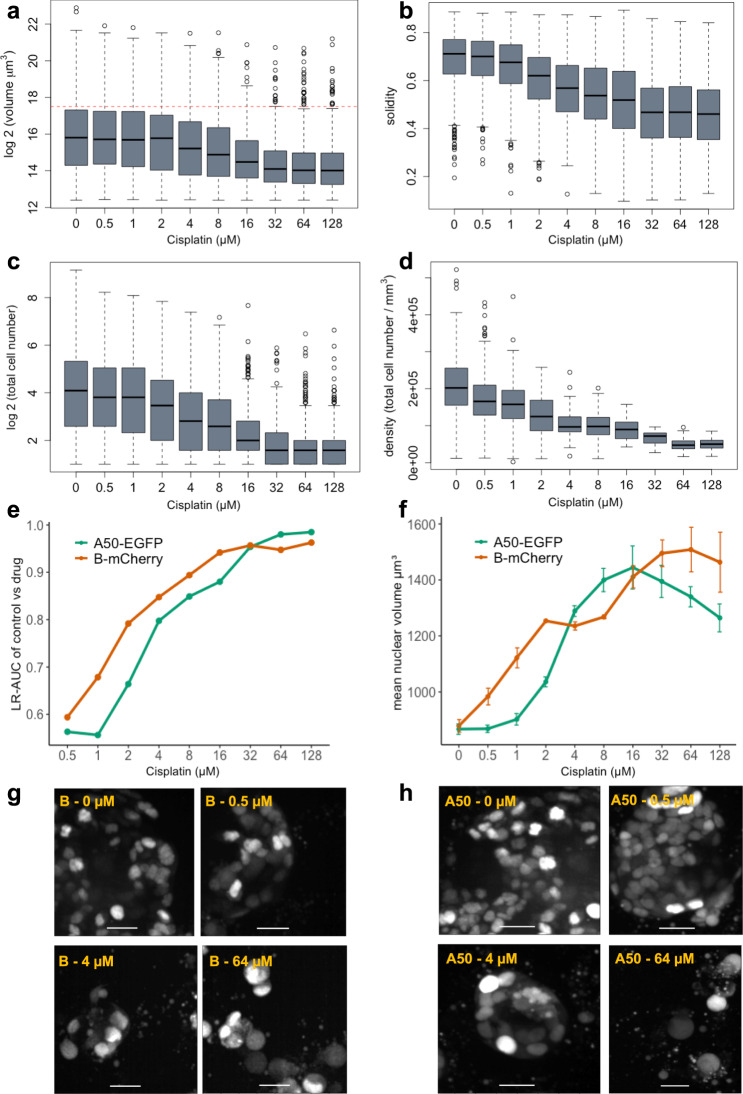
Three-dimensional (3D) organoid cultures are flexible systems to interrogate cellular growth, morphology, multicellular spatial architecture, and cellular interactions in response to treatment. However, computational methods for analysis of 3D organoids with sufficiently high-throughput and cellular resolution are needed. Here we report Cellos, an accurate, high-throughput pipeline for 3D organoid segmentation using classical algorithms and nuclear segmentation using a trained Stardist-3D convolutional neural network. To evaluate Cellos, we analyze ~100,000 organoids with ~2.35 million cells from multiple treatment experiments. Cellos segments dye-stained or fluorescently-labeled nuclei and accurately distinguishes distinct labeled cell populations within organoids. Cellos can recapitulate traditional luminescence-based drug response of cells with complex drug sensitivities, while also quantifying changes in organoid and nuclear morphologies caused by treatment as well as cell-cell spatial relationships that reflect ecological affinity. Cellos provides powerful tools to perform high-throughput analysis for pharmacological testing and biological investigation of organoids based on 3D imaging.


Conflict of interest statement

The authors declare no competing interests.

Figures

Fig. 1
Fig. 1. Outline of Cellos pipeline and cellular system.
a Cisplatin IC50 curves for two clones A50 (blue line) and B (gray line) from 3D homogeneously mixed organoids using a cell-destructive luminescence readout. Mean of three replicate wells is plotted and error bars represent the standard deviation. Source data is provided as a source data file. b Cellos: Two-stage pipeline for 3D organoids and nuclei segmentation on 3D images. Scale bar represents 400 µm for top and middle panel and 25 µm for the bottom panel. c Top panel represents steps for 3D organoid segmentation. The inputs are 3D z-stack images, and the outputs are the segmented and labeled organoids. Bottom panel shows an example of 3D organoids before and after segmentation. Scale bars shown represent 125 µm. d Steps for nuclei segmentation. A Stardist-3D with Resnet backbone model is trained using the training dataset. The trained model is then applied to experimental data with individual segmented organoids as input, and segmented and labelled nuclei as outputs. The 3D figures were generated using the napari python library, which is integrated into the Cellos pipeline.
Fig. 2
Fig. 2. Evaluation of organoid and nuclei segmentation.
a For each pair of images, the top panel shows fluorescence z-axis maximum projections with A50 cells labeled with EGFP and B cells labeled with mCherry. The bottom panel shows organoids segmented by Cellos. Segmented individual organoids are in distinct colors. Organoids from untreated, 2 µM, and 128 µM cisplatin wells are shown and scale bar represents 100 µm. Representative segmentation for one field per condition is shown. Segmentation was performed on 25 fields per well and three replicate wells for each condition. b F1 score for nucleus identification vs. IoU threshold. Mean and standard deviation across six cross-validations are shown. A total of 3,862 nuclei were used for this analysis. Source data is provided as a source data file. c Example of EGFP-labeled organoid image (left panel) with manually annotated ground truth nuclei annotations (middle panel) and Cellos predicted labels (right panel), respectively. Images are z-axis maximum projections and scale bar represents 25 µm.
Fig. 3
Fig. 3. Application of Cellos on diverse organoid datasets.
3D images of a HCC1806, b MDA-MB231 and c MCF10A organoids. Raw images are shown in the left panel, organoid segmentations via Cellos are shown in the middle panel, and a smaller field for better visualization of organoid segmentation is shown in the right panel. Individual segmented organoids are displayed in different randomly selected colors. Segmentation was performed on at least three replicate wells for each cell line and representative segmentation for one well per condition is shown. Scale bars represent 400 or 200 µm as indicated. d F1 score of Cellos nuclei segmentation in spheroids of breast carcinoma from Boutin et al. vs. IoU threshold. A total of 1585 nuclei was used for the analysis. Source data is provided as a source data file. e. Example DAPI stained image (left panel) from Boutin et al. with ground truth (middle panel) and Cellos predictions (right panel), respectively and scale bar representing 25 µm.
Fig. 4
Fig. 4. Cellos distinguishes proportions of co-cultured cells.
a Representative z-axis maximum projection images of homogeneously mixed organoids generated with seeding percentages of 20%, 40%, 60% and 80% A50-EGFP, respectively, with the remaining cells being A50-mCherry. Images shown are from day4. Twenty-five fields per well and three replicate wells for each condition were analyzed and representative images for one field per condition is shown. b Stacked bar plot showing the percentage of A50-EGFP+A50mCherry cells detected by Cellos at day0 and day4 for each of the seeding conditions. Analogous experiments for B-EGFP + B-mCherry mixed organoids are shown in the right panel. Mean of three replicate wells are plotted for each condition, white points show the data for individual replicates wells and error bars indicate the standard deviation. A total of 1,123,444 cells were analyzed. c Number of cells labelled with EGFP vs. mCherry detected in each homogeneously mixed A50 organoid. Each dot depicts an organoid Seeding conditions of EGFP-20% (blue), EGFP-40% (orange), EGFP-60% (green) and EGFP-80% (red) are shown from left to right. In total, 3245 organoids with a total of 185,702 cells were analyzed. The slope of the fitted linear regression is noted with the shaded bands indicating the 95% confidence interval. Source data for b and c are provided as source data files.
Fig. 5
Fig. 5. Cellos quantification of treatment response for organoids consisting of co-cultured clones.
a Total cell density (for both A50 and B) after exposure to cisplatin (0-128 µM) for 4 days. Mean and standard deviation across three replicate wells per condition are shown and data for individual replicates are shown as black dots. b IC50 curves for A50-EGFP and B-mCherry clones when co-cultured in heterogeneously mixed organoids. Mean values with standard deviation across triplicates indicated for each condition. c Control normalized cell proportions vs. cisplatin treatment concentration range, for A50-EGFP and B-mCherry clones cultured as mixed organoids. Line plots shows mean and standard deviation of three replicates for all conditions. A total of 137,765 cells were examined for (ac). d Correlation of A50 clonal percentages post cisplatin treatment, when labeled with either nuclear EGFP or mCherry and mixed to form organoids with B clones that had been labelled with the other fluorescent channel. 238,077 cells were utilized for this analysis. Pearson correlation coefficient and two-sided t-test p value are noted. e Clonal cell proportions for A50-EGFP and A50-mCherry clones co-cultured as mixed organoids, normalized by proportion in the untreated control, as a function of cisplatin treatment concentration. Data was collected from three replicates for all but one condition that had two replicates available. A total of 123,069 cells were assessed. Mean values with standard deviation are plotted. f Distribution of percentage of A50-EGFP cells per organoid when mixed with B-mCherry cells after 0, 2 or 64 µM cisplatin exposure. Horizontal line in the boxplot indicates the median, the box denotes the interquartile range (IQR) and the whiskers beyond the box extend to a maximum of 1.5 times the IQR. g Percentage of A50-EGFP cells per organoid versus total cells. Each dot represents an organoid. White dots represent untreated organoids, and blue and orange dots represent organoids treated with 2 µM and 64 µM cisplatin, respectively. The median percentages of A50-EGFP cells for each condition are marked by the triangles at bottom. A total of 2772 organoids with 57,102 cells across three replicate wells for each condition were analyzed for figures f and g. Source data for ag are provided as source data files.
Fig. 6
Fig. 6. Changes in organoid and nuclear morphological features after cisplatin treatment.
a Organoid volume (µm3). b Solidity and c Cell number after cisplatin treatment for 4 days is shown. Each experimental condition had three replicate wells. A total of 8382 organoids were analyzed. Horizontal line in the boxplot indicates the median, the box denotes the IQR, the whiskers beyond the box extend to a maximum of 1.5 times the IQR and outliers are shown as dots. Red dotted line on a marks the cut-off used to define large organoids (organoid volume > 1.85 × 105 μm3). d Cell density of large organoids (n = 1077) after 4 days of cisplatin exposure. Boxplot features same as that described above. e Logistic regression classifications based on nuclear morphology, for classification of control nuclei vs. cisplatin-treated nuclei. A50-EGFP and B-mCherry cells are analyzed separately. LR-AUC indicates area under the curve of the logistic regression classifier for the specified comparison. A total of 352,939 nuclei were used for training and 88,243 nuclei were used for testing. f Nuclear volume of A50-EGFP and B-mCherry cells after exposure to a range of cisplatin concentrations. A total of 137,765 nuclei were examined and mean values with standard deviation for triplicate wells are plotted. Source data for af are provided as source data files. g Representative images of B-mCherry cell nuclei at day 4 post cisplatin exposure. A total of 51,269 nuclei were examined. h A50-EGFP cell nuclei at day 4 post selected concentrations of cisplatin exposure. A total of 86,496 nuclei were examined. Scale bar represents 25 µm.
Fig. 7
Fig. 7. Investigation of cell-cell spatial relationships within organoids.
a Localization score vs. window size (5, 10, 20, 30, 40 and 50 cells) for B-mCherry cells within heterogeneously mixed organoids. A total of 271 organoids from control or 4 μM cisplatin treated conditions are shown. b Localization score for B-mCherry cells in organoids (5 cell window), stratified by B clone fraction in the organoid. Organoids (n = 232) are binned in increments of 0.2 for the B cell fraction. For boxplots in a and b, the median is shown by the horizontal line in the boxplot, the box denotes the IQR, the whiskers extend to a maximum of 1.5 times the IQR and outliers are shown as dots. ce 3D spatial locations of nuclei in representative individual organoids showing different patterns of colocalization. The 3D scatter plots for each of the three representative organoids consists of 88 (left panel), 74 (center panel) and 57 (right panel) nuclei respectively. f Distribution of localization score of B clones (in 5-cell window) when mixed with A50 (blue line) or with alternately labeled B (orange line). Kernal density estimate is used to visualize distribution of the data consisting of 212 organoids. g Distribution of localization score of A50 clones when mixed with B (blue line) or with alternately labeled A50 (orange line). Kernal density estimate was applied on 152 organoids. Source data for ag are provided as source data files.

Update of

Similar articles

Cited by

References

    1. Yoshii Y, et al. High-throughput screening with nanoimprinting 3D culture for efficient drug development by mimicking the tumor environment. Biomaterials. 2015;51:278–289. doi: 10.1016/j.biomaterials.2015.02.008. - DOI - PubMed
    1. Costa EC, et al. 3D tumor spheroids: an overview on the tools and techniques used for their analysis. Biotechnol. Adv. 2016;34:1427–1441. doi: 10.1016/j.biotechadv.2016.11.002. - DOI - PubMed
    1. Jensen C, Teng Y. Is it time to start transitioning from 2D to 3D cell culture? Front. Mol. Biosci. 2020;7:33. doi: 10.3389/fmolb.2020.00033. - DOI - PMC - PubMed
    1. Langhans SA. Using 3D in vitro cell culture models in anti-cancer drug discovery. Expert Opin. Drug Dis. 2021;16:1–10. doi: 10.1080/17460441.2021.1912731. - DOI - PubMed
    1. Ravi M, Paramesh V, Kaviya SR, Anuradha E, Solomon FDP. 3D cell culture systems: advantages and applications. J. Cell Physiol. 2015;230:16–26. doi: 10.1002/jcp.24683. - DOI - PubMed

Publication types