. 2023 Dec 19;13(1):22634.
doi: 10.1038/s41598-023-49441-2.

Linking tumor immune infiltrate and systemic immune mediators to treatment response and prognosis in advanced cervical cancer

Affiliations

Linking tumor immune infiltrate and systemic immune mediators to treatment response and prognosis in advanced cervical cancer

Patrícia Rocha Martins et al. Sci Rep. .

Abstract

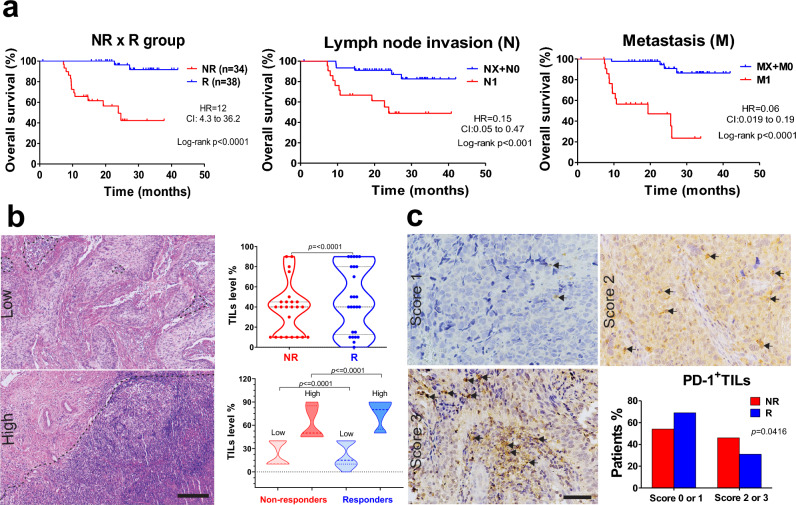
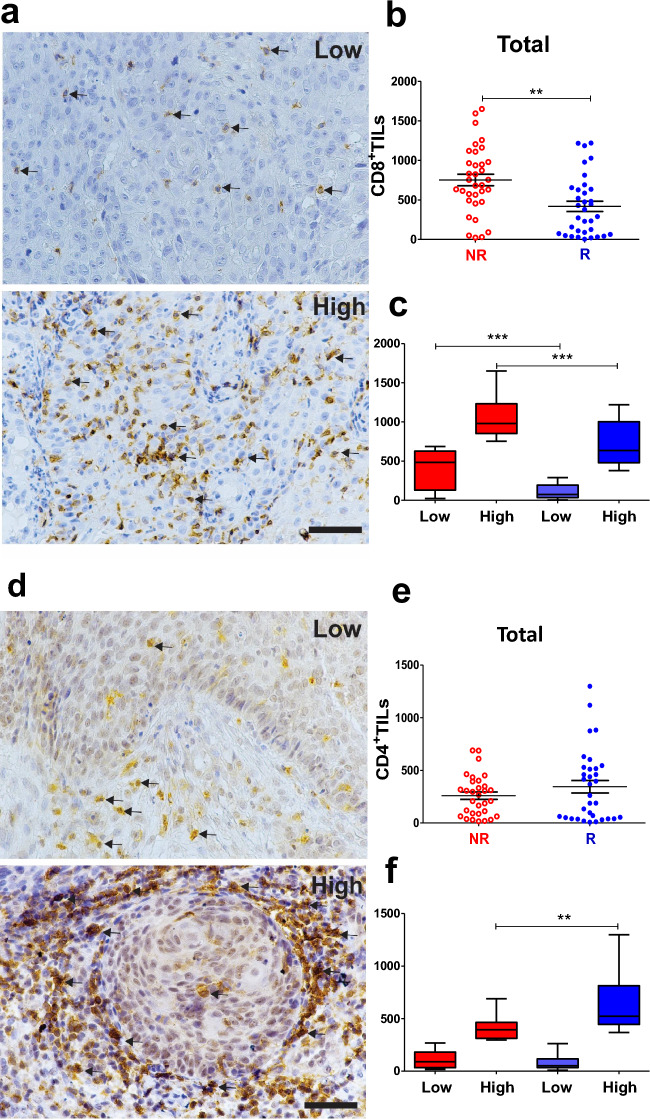
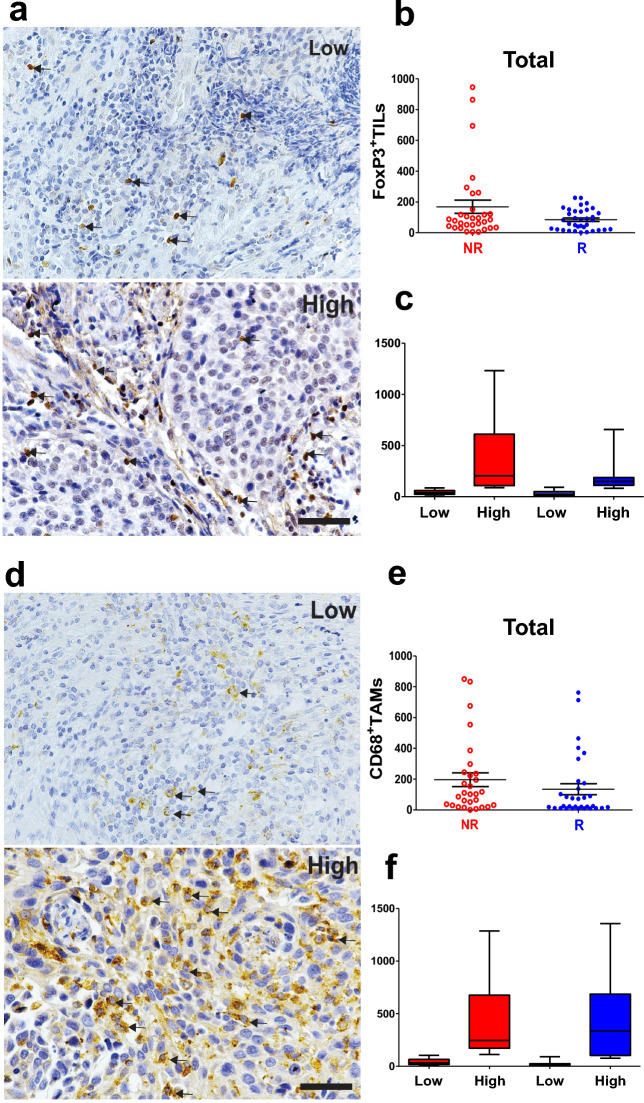
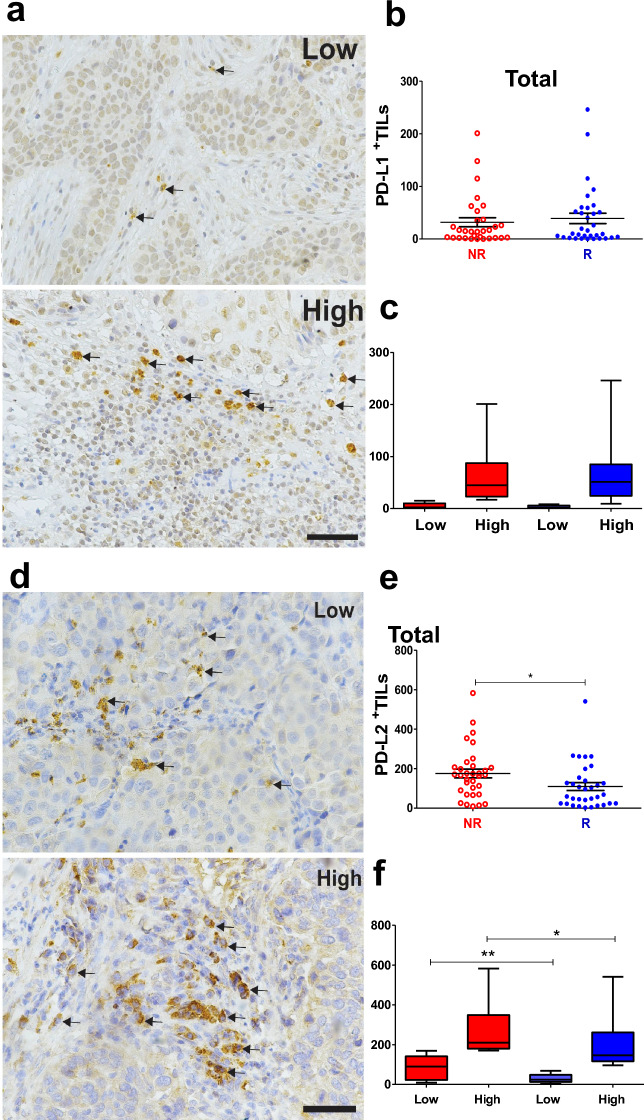
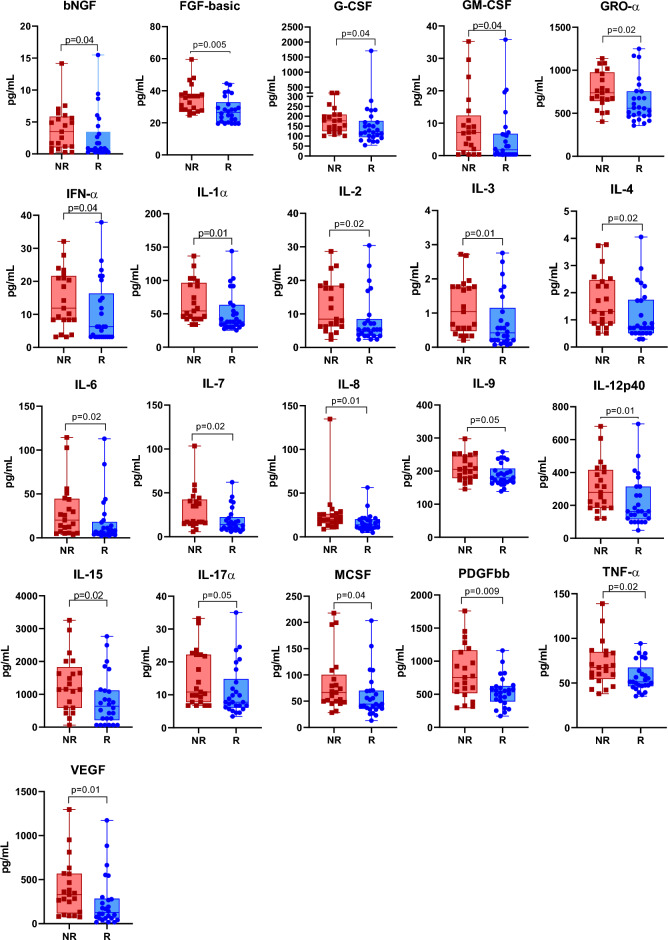
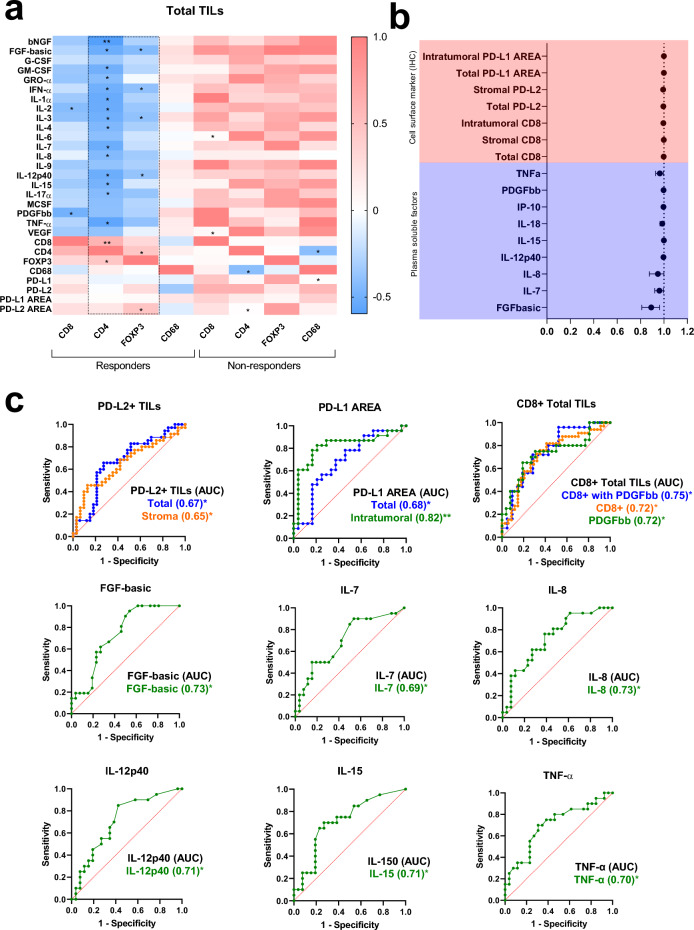
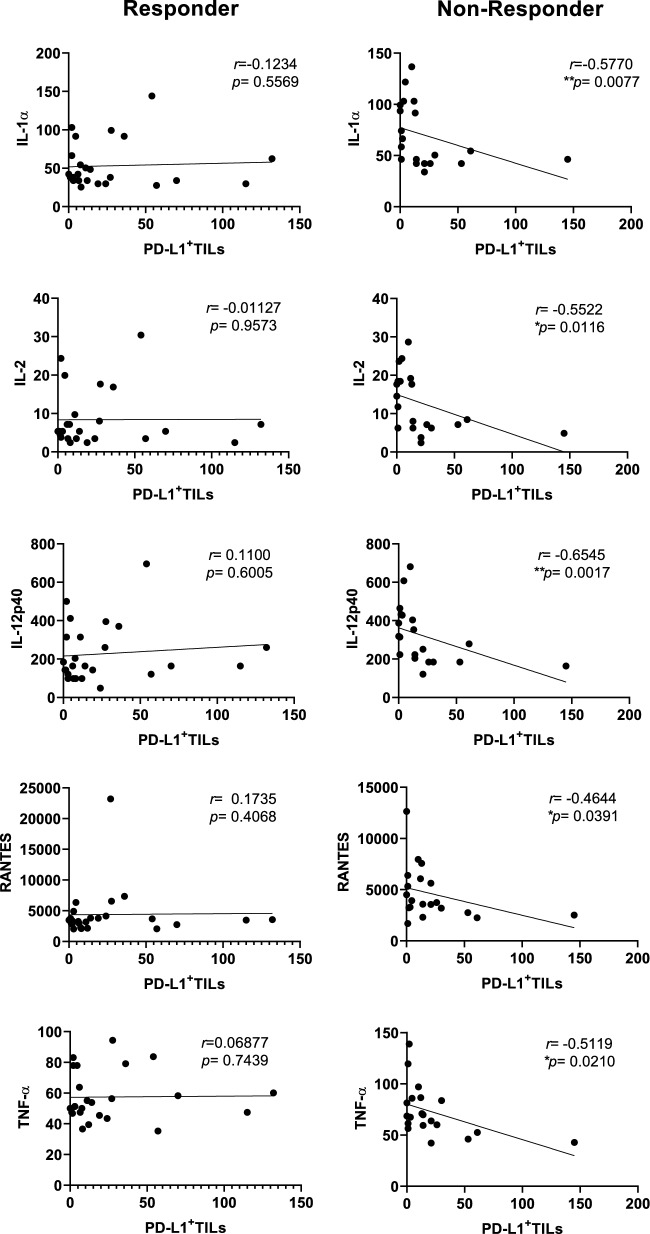
Cervical cancer (CC) poses a significant burden on individuals in developing regions, exhibiting heterogeneous responses to standard chemoradiation therapy, and contributing to substantial mortality rates. Unraveling host immune dynamics holds promise for innovative therapies and discovery of clinically relevant biomarkers. We studied prospectively locally advanced CC patients pre-treatment, stratifying them as responders (R) or non-responders (NR). R patients had increased tumor-infiltrating lymphocytes (TILs), while NR patients showed elevated PD-1 scores, CD8+ and PD-L2+ TILs, and PD-L1 immune reactivity. NR patients exhibited higher systemic soluble mediators correlating with TIL immune markers. R patients demonstrated functional polarization of CD4 T cells (Th1, Th2, Th17, and Treg), while CD8+ T cells and CD68+ macrophages predominated in the NR group. Receiver operating characteristic analysis identified potential CC response predictors, including PD-L1-immunoreactive (IR) area, PD-L2, CD8, FGF-basic, IL-7, IL-8, IL-12p40, IL-15, and TNF-alpha. Dysfunctional TILs and imbalanced immune mediators contribute to therapeutic insufficiency, shedding light on local and systemic immune interplay. Our study informs immunological signatures for treatment prediction and CC prognosis.


Conflict of interest statement

The authors declare no competing interests.

Figures

Figure 1
Figure 1
CC patients that respond to chemoradiotherapy exhibit a high survival percentage, high immune cell infiltration, and lower PD-1 score than non-responder patients. (a) Kaplan–Meier survival curves highlight the higher percentage of overall survival in R than NR patients (NR, n = 34 and R, n = 38). Patients with lymph node invasion (N1; NR, n = 48 and R, n = 24) and metastasis (M1, NR, n = 49 and R, n = 23) displayed lower survival. (b) Representative images of low and high stromal TILs stained by H&E. Black outlining separates the TILs area considered. Scale bar = 200 μm. Morphometric analysis in H&E-stained slides illustrated by violin plot showed a higher TILs percentage in the R than NR group (Wilcoxon Signed Rank Test, p =  ≤ 0.0001; NR, n = 24 and R, n = 25) and when segregated by low and high stromal TILs (Mann–Whitney test, p =  ≤ 0.0001; NR low, n = 15; NR high, n = 9; R low, n = 13 and R high, n = 12). (c) Images of PD-1+ stromal TILs IHC-stained (arrows) in low (1), medium (2), and high (3) scores. Scale bar = 50 μm. The bar graph represents the percentages of NR and R patients when comparing the scores of 0 or 1 and 2 or 3 (Fischer’s exact test, RR = 0.7349; OR = 0.52, 95% CI 0.2958–0.9404, p = 0.0416; NR, n = 24 and R, n = 26). CC, Cervical Cancer; NR, non-responder (Red) patients; R, responder (Blue) patients; TILs, Tumor-infiltrating lymphocytes; H&E, Hematoxylin & Eosin; HR, Hazard Ratio; RR, Relative risk; OD, Odds ratio; CI, Confidence interval; N, Local lymph node invasion at diagnosis (NX, not evaluated; N0, absent; N1, present); M, Distant metastasis at diagnosis (MX, not evaluated; M0, absent; M1, present).
Figure 2
Figure 2
Non-responder CC patients exhibited elevated numbers of CD8+ TILs. Representative IHC images (a and d) of brown stained immune cells (+) indicating the expression of CD8+ (a) and CD4+ (d) TILs in human CC taken before treatment began at the time of diagnosis. The arrows indicate lymphocytes at high magnification (400x). Scale bar = 50 μm. (b and e) Morphometric analysis showed NR with a higher number of CD8+ TILs than in R patients (b, NR, n = 33 and R, n = 34) and no difference in the number of CD4+ TILs (e, NR, n = 32 and R, n = 33). (c) Number of CD8+ TILs plotted in low and high cell densities showed a higher number of TILs in NR than R group (low NR vs. R and high NR vs. R; NR low, n = 16; NR high, n = 17; R low, n = 17 and R high, n = 17). (f) Higher number of CD4+ TILs in the total sum of R (high R vs. NR; NR low, n = 16; NR high, n = 16; R low, n = 17 and R high, n = 16). Statistical differences are indicated by asterisks (*) p ≤ 0.05, (**) p ≤ 0.01, and (***) p ≤ 0.001. The p values were calculated using the Mann–Whitney test. The graphs show the median and standard error. CC, Cervical Cancer; NR, non-responder (Red) patients; R, responder (Blue) patients.
Figure 3
Figure 3
Total FoxP3+ TILs and CD68+ TAMs expression in  CC patients. Representative IHC images of low and high FoxP3+ TILs (a) and CD68+ TAMs (d) are indicated by arrows. Scale bar = 50 μm. Morphometric analysis did not show differences in total FoxP3+ TILs quantification between the groups (b, NR, n = 32 and R, n = 36) and (c, NR low, n = 16; NR high, n = 16; R low, n = 19 and R high, n = 17). (e) No difference was observed in the number of total CD68+ TAMs between the groups (NR, n = 30 and R, n = 34) and (f, NR low, n = 15; NR high, n = 15; R low, n = 19 and R high, n = 15), considering p ≤ 0.05. The p values were calculated using the Mann–Whitney test. The graphs show the median and standard error. CC, cervical cancer; NR, non-responder (Red) patients; R, responder (Blue) patients.
Figure 4
Figure 4
Non-responder CC patients presented a high number of PD-L2+TILs. Representative IHC images of low and high PD-L1+ TILs (a) and PD-L2+ TILs (d) are indicated by arrows. Scale bar = 50 μm. Morphometric analysis did not show differences in PD-L1+ TILs quantification between the groups (b, NR n = 31; R n = 34) and (c, NR low, n = 17; NR high, n = 14; R low, n = 16 and R high, n = 18), the. (e) NR patients presented higher number of PD-L2+ TILs in total sum than R patients (NR n = 33; R n = 34), considering p ≤ 0.05. (f) Quantification analysis showed a higher median of PD-L2+ TILs in NR, when comparing low cell densities in the total sum and stromal region and comparing the high cell densities of PD-L2 in NR vs R patients (low NR vs. R and high NR vs. R; NR low, n = 17; NR high, n = 16; R low, n = 17 and R high, n = 17). Statistical differences are indicated by asterisks (*) p ≤ 0.05 and (**) p ≤ 0.01. The p values were calculated using the Mann–Whitney test. The graphs show the median and standard error. CC, Cervical Cancer; NR, non-responder (Red) patients; R, responder (Blue) patients.
Figure 5
Figure 5
Higher levels of soluble immune mediators in CC non-responder patients. Soluble immune mediators were measured in the plasma of patients by using the Bio-Plex Pro Human Cytokine Screening Panel, 48-Plex according to the manufacturer's instructions test. CC, Cervical Cancer; NR, non-responder (n = 21); R, responder (n = 26). Analytes with p-values ≤ 0.05 after the Mann–Whitney test are shown.
Figure 6
Figure 6
Associations between systemic immune mediators and TME immune indicators reveal distinct immune mechanisms in responder versus non-responder patients. (a) Correlation matrix between systemic soluble immune mediators and TIL subpopulations. All statistical analyses were performed with Spearman’s correlation Test. (b) Forest plots indicating independent predictors of treatment response based on systemic soluble immune mediators and TILs markers or PD-L1-IR area in CC patients. Odds Ratio (OR) and 95% confidence intervals (95% CI) were calculated using a logistic regression model. (c) The capacity of systemic soluble immune mediators and TILs markers or PD-L1-IR area before treatment began to distinguish R vs. NR CC patients was evaluated by receiver operating characteristic (ROC) curves. The Area Under the Curve (AUC) was calculated for all parameters. CC, Cervical Cancer; NR, Non-responder (n = 21); R, Responder (n = 26); TME, tumor microenvironment. In all graphics: *p ≤ 0.05, **p ≤ 0.001.
Figure 7
Figure 7
Stromal PD-L1 expression is associated with a downregulation of systemic anti-tumor response promoting cytokines and chemokines in NR patients. Correlation between stromal PD-L1+TILs and soluble immune mediators in CC patients. CC, Cervical Cancer; NR, non-responder (n = 21); R, responder (n = 26). All statistical analyses were performed with the Spearman’s correlation Test, (*) p ≤ 0.05, (**) p ≤ 0.01. Immune mediators are expressed in pg/ml.

References

    1. Bray F, et al. Global cancer statistics 2018: GLOBOCAN estimates of incidence and mortality worldwide for 36 cancers in 185 countries. CA Cancer J. Clin. 2018;68(6):394–424. doi: 10.3322/caac.21492. - DOI - PubMed
    1. Colpani V, et al. Prevalence of human papillomavirus (HPV) in Brazil: A systematic review and meta-analysis. PLoS ONE. 2020;15(2):e0229154. doi: 10.1371/journal.pone.0229154. - DOI - PMC - PubMed
    1. Bruni L, et al. Cervical human papillomavirus prevalence in 5 continents: Meta-analysis of 1 million women with normal cytological findings. J. Infect. Dis. 2010;202(12):1789–1799. doi: 10.1086/657321. - DOI - PubMed
    1. Gupta S, et al. Neoadjuvant chemotherapy followed by radical surgery versus concomitant chemotherapy and radiotherapy in patients with stage IB2, IIA, or IIB squamous cervical cancer: A randomized controlled trial. J. Clin. Oncol. 2018;16:1548–1555. doi: 10.1200/JCO.2017.75.9985. - DOI - PubMed
    1. Arbyn M, et al. Estimates of incidence and mortality of cervical cancer in 2018: A worldwide analysis. Lancet Glob. Health. 2020;8:e191–e203. doi: 10.1016/S2214-109X(19)30482-6. - DOI - PMC - PubMed