. 2023 Dec 19;13(1):22641.
doi: 10.1038/s41598-023-50012-8.

Machine learning based outcome prediction of microsurgically treated unruptured intracranial aneurysms

Affiliations

Machine learning based outcome prediction of microsurgically treated unruptured intracranial aneurysms

Nico Stroh et al. Sci Rep. .

Abstract

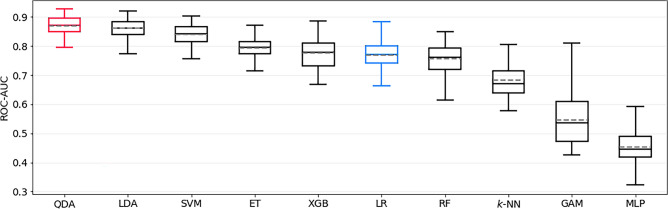
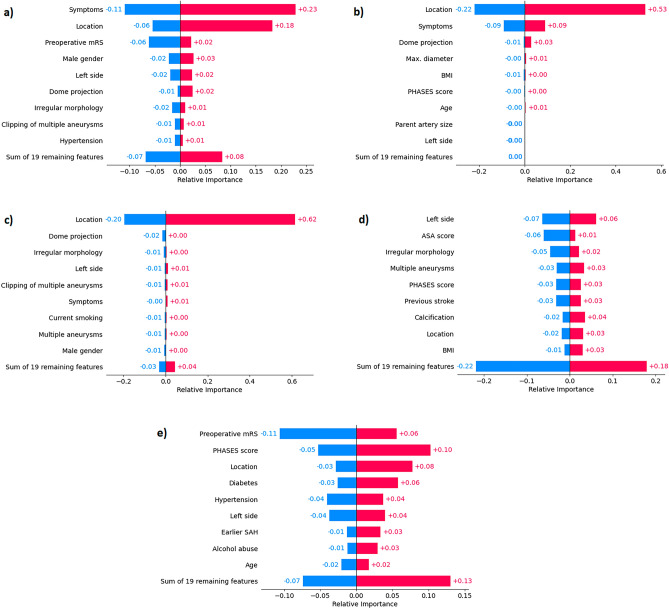
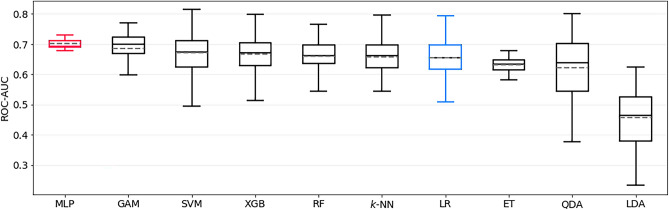
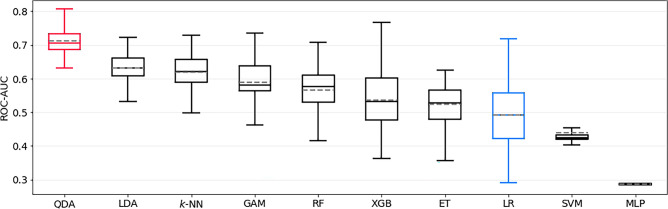
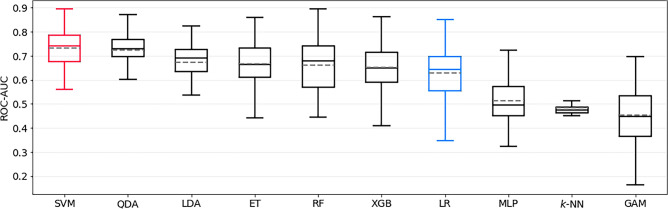
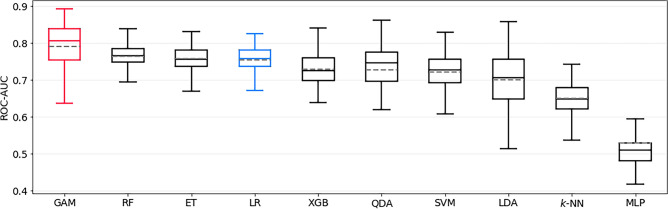
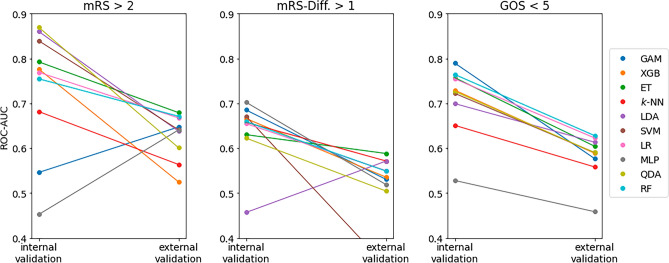
Machine learning (ML) has revolutionized data processing in recent years. This study presents the results of the first prediction models based on a long-term monocentric data registry of patients with microsurgically treated unruptured intracranial aneurysms (UIAs) using a temporal train-test split. Temporal train-test splits allow to simulate prospective validation, and therefore provide more accurate estimations of a model's predictive quality when applied to future patients. ML models for the prediction of the Glasgow outcome scale, modified Rankin Scale (mRS), and new transient or permanent neurological deficits (output variables) were created from all UIA patients that underwent microsurgery at the Kepler University Hospital Linz (Austria) between 2002 and 2020 (n = 466), based on 18 patient- and 10 aneurysm-specific preoperative parameters (input variables). Train-test splitting was performed with a temporal split for outcome prediction in microsurgical therapy of UIA. Moreover, an external validation was conducted on an independent external data set (n = 256) of the Department of Neurosurgery, University Medical Centre Hamburg-Eppendorf. In total, 722 aneurysms were included in this study. A postoperative mRS > 2 was best predicted by a quadratic discriminant analysis (QDA) estimator in the internal test set, with an area under the receiver operating characteristic curve (ROC-AUC) of 0.87 ± 0.03 and a sensitivity and specificity of 0.83 ± 0.08 and 0.71 ± 0.07, respectively. A Multilayer Perceptron predicted the post- to preoperative mRS difference > 1 with a ROC-AUC of 0.70 ± 0.02 and a sensitivity and specificity of 0.74 ± 0.07 and 0.50 ± 0.04, respectively. The QDA was the best model for predicting a permanent new neurological deficit with a ROC-AUC of 0.71 ± 0.04 and a sensitivity and specificity of 0.65 ± 0.24 and 0.60 ± 0.12, respectively. Furthermore, these models performed significantly better than the classic logistic regression models (p < 0.0001). The present results showed good performance in predicting functional and clinical outcomes after microsurgical therapy of UIAs in the internal data set, especially for the main outcome parameters, mRS and permanent neurological deficit. The external validation showed poor discrimination with ROC-AUC values of 0.61, 0.53 and 0.58 respectively for predicting a postoperative mRS > 2, a pre- and postoperative difference in mRS > 1 point and a GOS < 5. Therefore, generalizability of the models could not be demonstrated in the external validation. A SHapley Additive exPlanations (SHAP) analysis revealed that this is due to the most important features being distributed quite differently in the internal and external data sets. The implementation of newly available data and the merging of larger databases to form more broad-based predictive models is imperative in the future.


Conflict of interest statement

The authors declare no competing interests.

Figures

Figure 1
Figure 1
Bootstrapped test-set ROC-AUC of all models trained to predict postoperative mRS > 2, sorted by mean ROC-AUC. QDA is the top-performing model, and LR represents the logistic regression baseline model (both highlighted). mRS = modified Rankin Scale, ROC-AUC = area under Receiver Operating Characteristic curve, QDA = quadratic discriminant analysis, ET = Extremely Randomized Trees, SVM = support vector machine, LDA = linear discriminant analysis, XGB = extreme gradient boosting, RF = Random Forest, KNN = k-nearest neighbors, GAM = generalized additive model, MLP = Multilayer Perceptron.
Figure 2
Figure 2
SHAP feature importance of the best prediction models for each task (ae). For every feature, negative and positive average contributions are depicted separately, in bluish and reddish hues, respectively. (a) mRS > 2, (b) mRS-difference > 1, (c) permanent nND, (d) transient nND, (e) GOS < 5. mRS = modified Rankin Scale, BMI = body mass index, nND = new neurological deficit, ADPKD = autosomal dominant polycystic kidney disease, GOS =  Glasgow outcome scale.
Figure 3
Figure 3
Bootstrapped test-set ROC-AUC of all models trained to predict postoperative mRS-difference > 1, sorted by mean ROC-AUC. MLP is the top-performing model, and LR represents the logistic regression baseline model (both highlighted). mRS = modified Rankin Scale, ROC-AUC = area under Receiver Operating Characteristic curve, MLP = multilayer perceptron, GAM = generalized additive model, SVM = support vector machine, XGB = extreme gradient boosting, RF = Random Forest, KNN = k-nearest neighbors, LR = logistic regression, ET = Extremely Randomized Trees, QDA = quadratic discriminant analysis, LDA = linear discriminant analysis.
Figure 4
Figure 4
Bootstrapped test-set ROC-AUC of all models trained to predict permanent new neurological deficit (pnND), sorted by mean ROC-AUC. QDA is the top-performing model, and LR represents the logistic regression baseline model (both highlighted). ROC-AUC = area under Receiver Operating Characteristic curve, QDA = quadratic discriminant analysis, LDA = linear discriminant analysis, KNN = k-nearest neighbors, GAM = generalized additive model, RF = Random Forest, XGB = extreme gradient boosting, ET = Extremely Randomized Trees, LR = logistic regression, SVM = support vector machine, MLP = multilayer perceptron.
Figure 5
Figure 5
Bootstrapped test-set ROC-AUC of all models trained to predict transient new neurological deficit (tnND), sorted by mean ROC-AUC. SVM is the top-performing model, and LR represents the logistic regression baseline model (both highlighted). ROC-AUC = area under Receiver Operating Characteristic curve, SVM = support vector machine, QDA = quadratic discriminant analysis, LDA = linear discriminant analysis, ET = Extremely Randomized Trees, RF = Random Forest, XGB = extreme gradient boosting, LR = logistic regression, MLP = multilayer perceptron, KNN = k-nearest neighbors, GAM = generalized additive model.
Figure 6
Figure 6
Bootstrapped test-set ROC-AUC of all models trained to predict GOS < 5, sorted by mean ROC-AUC. GAM is the top-performing model, and LR represents the logistic regression baseline model (both highlighted). GOS =  Glasgow outcome scale, ROC-AUC = area under Receiver Operating Characteristic curve, GAM = generalized additive model, RF = Random Forest, ET = Extremely Randomized Trees, LR = logistic regression, XGB = extreme gradient boosting, QDA = quadratic discriminant analysis, SVM = support vector machine, LDA = linear discriminant analysis, KNN = k-nearest neighbors, MLP = multilayer perceptron.
Figure 7
Figure 7
ROC-AUC of all models on both the internal (left column in each subplot) and external (right column in each subplot) test set. One can clearly observe the pronounced performance drop, especially of the model with the highest ROC-AUC on the internal test set. ROC-AUC = area under Receiver Operating Characteristic curve, mRS = modified Rankin Scale, GOS =  Glasgow outcome scale, GAM = Generalized Additive Model, XGB = extreme gradient boosting, ET = Extremely Randomized Trees, k-NN = k-nearest neighbors, LDA = linear discriminant analysis, SVM = support vector machine, LR = logistic regression, MLP = Multilayer Perceptron, QDA = quadratic discriminant analysis, RF = Random Forest.

References

    1. Juvela S. Prevalence of and risk factors for intracranial aneurysms. Lancet Neurol. 2011;10(7):595–597. doi: 10.1016/s1474-4422(11)70125-9. - DOI - PubMed
    1. Nieuwkamp DJ, Setz LE, Algra A, Linn FH, de Rooij NK, Rinkel GJ. Changes in case fatality of aneurysmal subarachnoid haemorrhage over time, according to age, sex, and region: A meta-analysis. Lancet Neurol. 2009;8(7):635–642. doi: 10.1016/s1474-4422(09)70126-7. - DOI - PubMed
    1. Etminan N, Brown RD, Jr, Beseoglu K, et al. The unruptured intracranial aneurysm treatment score: A multidisciplinary consensus. Neurology. 2015;85(10):881–889. doi: 10.1212/wnl.0000000000001891. - DOI - PMC - PubMed
    1. Fatima N, Zheng H, Massaad E, Hadzipasic M, Shankar GM, Shin JH. Development and validation of machine learning algorithms for predicting adverse events after surgery for lumbar degenerative spondylolisthesis. World Neurosurg. 2020;140:627–641. doi: 10.1016/j.wneu.2020.04.135. - DOI - PubMed
    1. Agarwal N, Aabedi AA, Chan AK, et al. Leveraging machine learning to ascertain the implications of preoperative body mass index on surgical outcomes for 282 patients with preoperative obesity and lumbar spondylolisthesis in the Quality Outcomes Database. J. Neurosurg. Spine. 2022 doi: 10.3171/2022.8.Spine22365. - DOI - PubMed