. 2023 Dec;4(12):1090-1110.
doi: 10.1038/s43016-023-00885-9. Epub 2023 Dec 19.

The state of food systems worldwide in the countdown to 2030

Affiliations

The state of food systems worldwide in the countdown to 2030

Kate R Schneider et al. Nat Food. 2023 Dec.

Abstract

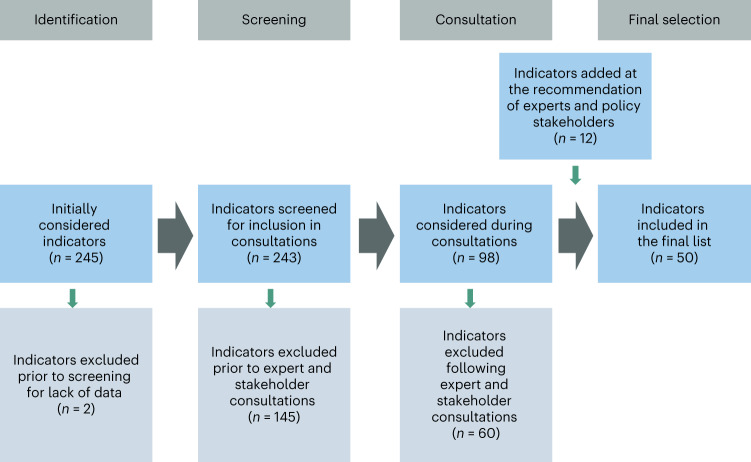
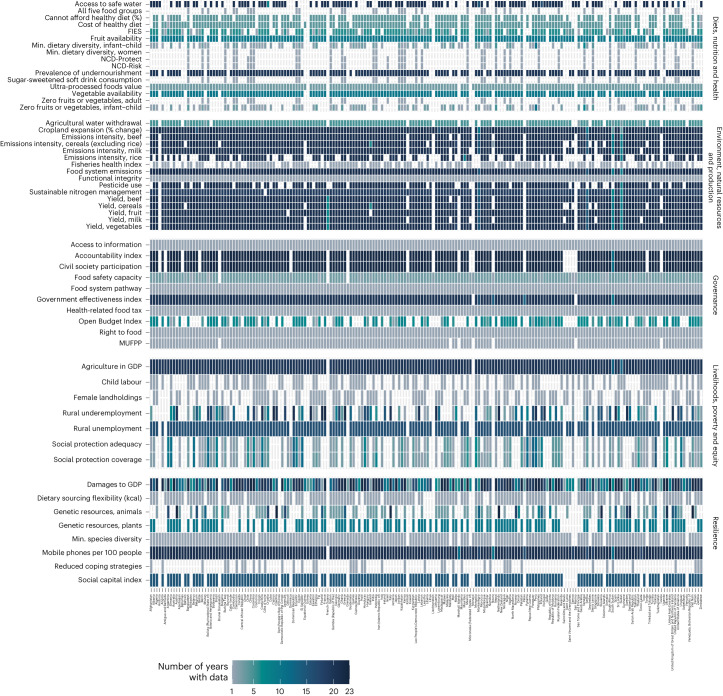
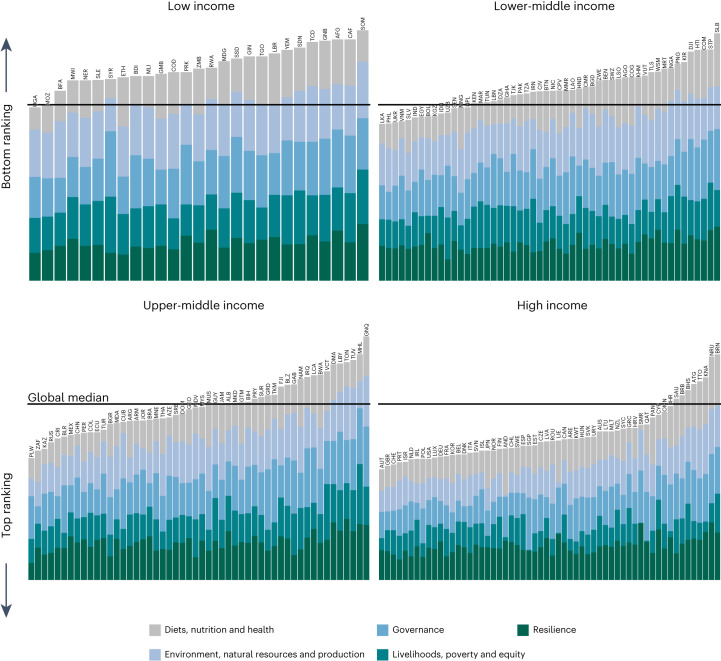
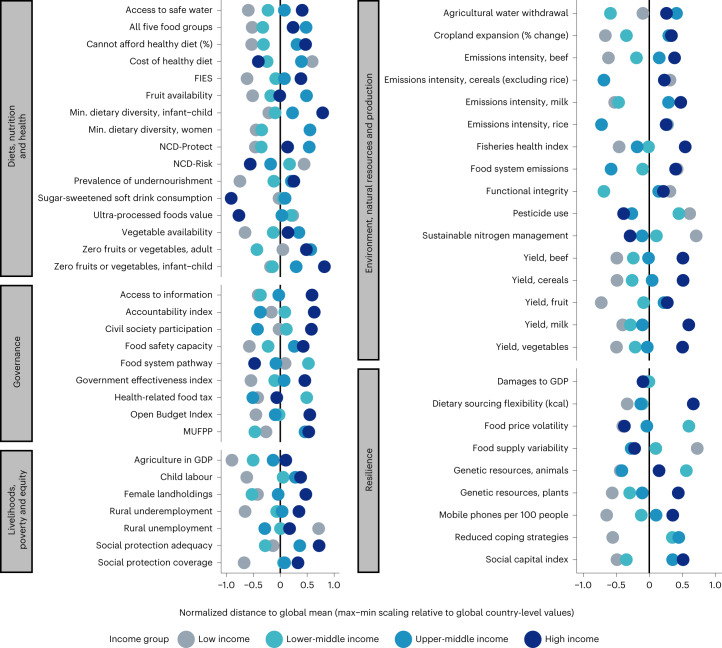
This Analysis presents a recently developed food system indicator framework and holistic monitoring architecture to track food system transformation towards global development, health and sustainability goals. Five themes are considered: (1) diets, nutrition and health; (2) environment, natural resources and production; (3) livelihoods, poverty and equity; (4) governance; and (5) resilience. Each theme is divided into three to five indicator domains, and indicators were selected to reflect each domain through a consultative process. In total, 50 indicators were selected, with at least one indicator available for every domain. Harmonized data of these 50 indicators provide a baseline assessment of the world's food systems. We show that every country can claim positive outcomes in some parts of food systems, but none are among the highest ranked across all domains. Furthermore, some indicators are independent of national income, and each highlights a specific aspiration for healthy, sustainable and just food systems. The Food Systems Countdown Initiative will track food systems annually to 2030, amending the framework as new indicators or better data emerge.


Conflict of interest statement

The authors declare no competing interests.

Figures

Fig. 1
Fig. 1. Multi-stage indicator selection process.
The process of indicator selection and the number of indicators included and excluded at each stage. The excluded indicators are listed in Supplementary Appendix 2.
Fig. 2
Fig. 2. Data coverage, number of years per country–indicator, 2000–2021.
Heat map illustrating the density of data points per country–indicator pairing, with the darkest cells illustrating more years of data between 2000 and 2021. Indicators with no data at all for that country are shown in white. The figure illustrates greater availability of data for food security and agricultural indicators and lesser availability for indicators of diet quality, livelihoods and resilience. Heat maps showing the indicator–country time series by region are available in Supplementary Figs. 1.3–1.11. The maximum country coverage is all UN member states, but coverage differs per indicator depending on data availability. Differences in indicator coverage largely drive the observed differences across countries. Specifically, the indicators with the most heterogeneous coverage are the six indicators of diet quality sourced from the Global Diet Quality Project (currently available for only 41 mostly low- and lower-middle-income countries); the livelihood indicators of employment, social protection, child labour and landholdings; and the resilience indicators of genetic resources and coping strategies (available for countries with a high prevalence of food insecurity). Looking across countries within each indicator, countries with the indicator typically have time series of similar durations. Yield and emissions intensity for additional products are provided in Supplementary Appendix 1 and the baseline dataset. FIES, Food Insecurity Experience Scale.
Fig. 3
Fig. 3. Average country ranking per theme, by country income level.
The mean ranking of indicators within each theme shows that no country is performing in alignment with desirable outcomes for all themes. The bottom ranking indicates scores farthest from the minimum or maximum value observed across all countries, depending on whether lower or higher values are aligned to the desirable outcome. Countries are ranked per indicator relative to all other countries, and the average rank for all indicators within a theme is shown per country. Countries are grouped by income level and presented in order of increasing income from left to right and top to bottom. The horizontal black lines indicate the global median rank pooling all indicators. The results are from our calculations based on the data sources listed in Extended Data Table 1 and from the latest data point per country–indicator pair, of which the majority come from 2017–2021. Supplementary Data 1 contains the specific year for each country–indicator data point. Binary and categorical indicators are not ranked and are therefore excluded from the governance theme average. Country ranking per indicator is averaged at the theme level. Not all countries have data for every indicator. Missing data do not bias the total ranking visualized, but they do result in implicit weighting of the thematic mean rank by the present indicators. Country abbreviations shown as ISO alpha-3 country codes.
Fig. 4
Fig. 4. Average country ranking per theme, by country income level.
Normalized difference between each income group mean value per indicator and the global mean for that indicator (represented by the black vertical lines). Differences are aligned to the desirable direction of change such that points to the left of the global mean indicate that the indicator mean level is less desirable than the global mean and points to the right indicate values more desirable than the global mean. The results are from our calculations based on the data sources listed in Extended Data Table 1 and from the latest data point per country–indicator pair, of which the majority come from 2017–2021. Supplementary Data 1 contains the specific year for each country–indicator data point. The normalized distance to the global mean (weighted means following the weights defined in Table 1) is calculated relative to the global mean and scaled to the minimum and maximum of the income group mean, per indicator (the global mean is centred at 0). The sign of the normalized distance has been reversed for all indicators where a lower value is more desirable, such that −1 can be interpreted as ‘worse than’ and 1 can be interpreted as ‘better than’ the global mean. The number of people who cannot afford a healthy diet and the degree of legal recognition of the right to food are not shown. The product mixes in aggregate categories of emissions intensities (cereals) and yields (cereals, citrus, fruit, pulses, roots and tubers, and vegetables) differ across countries. Yield and emissions intensity for additional products are included in Supplementary Appendix 1 and the baseline dataset.

References

    1. Fanzo J, et al. Viewpoint: rigorous monitoring is necessary to guide food system transformation in the countdown to the 2030 global goals. Food Policy. 2021;104:102163. doi: 10.1016/j.foodpol.2021.102163. - DOI
    1. Visions of food systems at COP27. Nat. Food3, 969 (2022). - PubMed
    1. Casey, M. Historic biodiversity agreement reached at UN conference. Associated Press https://apnews.com/article/china-united-nations-biodiversity-climate-and... (19 December 2022).
    1. The State of Food Security and Nutrition in the World 2021: Transforming Food Systems for Food Security, Improved Nutrition and Affordable Healthy Diets for All (FAO, IFAD, UNICEF, WFP and WHO, 2021); 10.4060/cb4474en
    1. Mbow, C. et al. in Special Report on Climate Change and Land (eds Shukla, P. R. et al.) (IPCC, 2019).