. 2024 Apr;8(4):345-360.
doi: 10.1038/s41551-023-01156-5. Epub 2023 Dec 19.

Analysis of off-tumour toxicities of T-cell-engaging bispecific antibodies via donor-matched intestinal organoids and tumouroids

Affiliations

Analysis of off-tumour toxicities of T-cell-engaging bispecific antibodies via donor-matched intestinal organoids and tumouroids

Marius F Harter et al. Nat Biomed Eng. 2024 Apr.

Abstract

Predicting the toxicity of cancer immunotherapies preclinically is challenging because models of tumours and healthy organs do not typically fully recapitulate the expression of relevant human antigens. Here we show that patient-derived intestinal organoids and tumouroids supplemented with immune cells can be used to study the on-target off-tumour toxicities of T-cell-engaging bispecific antibodies (TCBs), and to capture clinical toxicities not predicted by conventional tissue-based models as well as inter-patient variabilities in TCB responses. We analysed the mechanisms of T-cell-mediated damage of neoplastic and donor-matched healthy epithelia at a single-cell resolution using multiplexed immunofluorescence. We found that TCBs that target the epithelial cell-adhesion molecule led to apoptosis in healthy organoids in accordance with clinical observations, and that apoptosis is associated with T-cell activation, cytokine release and intra-epithelial T-cell infiltration. Conversely, tumour organoids were more resistant to damage, probably owing to a reduced efficiency of T-cell infiltration within the epithelium. Patient-derived intestinal organoids can aid the study of immune-epithelial interactions as well as the preclinical and clinical development of cancer immunotherapies.


Conflict of interest statement

All authors, except for C.E., K.G.-J and S.P., are employees of Hoffmann-LaRoche. The company provided support in the form of salaries for authors, but did not have any additional role in the study design, data collection and analysis, decision to publish, or preparation of the manuscript. C.E., K.G.-J and S.P. declare no competing interests.

Figures
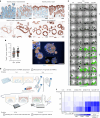
Fig. 1
Fig. 1. Patient-derived intestinal organoids co-cultured with PBMCs recapitulate physiological target-expression patterns, enabling the ‘back-translation’ of TCB-induced on-target off-tumour toxicity.
a, Expression of CEA and EpCAM target antigens in healthy small intestine and colon primary tissue as well as in patient-derived organoids captured by chromogenic DAB (brown) staining at ×20 magnification. Scale bar, 100 µm. b, Quantification of the DAB staining by area quantification of individual colon organoids (n > 50). Scale bar, 100 µm. Red line displays mean. c, F-actin+ outlined organoids (orange) co-cultured with bright DAPI+ (blue) PBMCs displayed as maximum intensity projection of a z-stack of ~100 μm. ×20 magnification; scale bar, 200 μm. c’, A 3D reconstruction of c highlights spatial arrangement of PBMCs around the organoid (x, y, z axes). d, Schematic of low-resolution imaging assay to capture on-target off-tumour toxicity using an organoid–PBMC co-culture. Organoids (5-d expanded and 3-d differentiated) were collected and resuspended with PBMCs before assessing the TCB treatment by brightfield and IF imaging. Schematic created with BioRender.com. e, Representative single tiles of merged brightfield and caspase-3/7 IF (green) images of the co-culture treated with EpCAM, CEA(hi), CEA(lo) and non-targeting TCB (0.1–10 µg ml−1) over a time course of 72 h at ×5 magnification. Scale per tile, 500 µm. f, Heat map of quantified caspase-3/7 arbitrary fluorescence units (a.f.u.) in >20 segmented organoids per well (n = 3) for each treatment condition (0.1–10 µg ml−1) across time. All displayed experiments in this figure were replicated at least five times, yielding similar results. Source data
Fig. 2
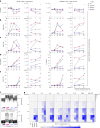
Fig. 2. TCB-triggered immunological activation cascades of CD45RO+ CD4+ and GzmB+ CD8+ immune subsets yield mechanistic insight into the TCB mode of action.
The figure follows the CD45RO+ CD4+ and GzmB+ CD8+ T-cell fractions over the treatment period (hereafter abbreviated as ‘both subsets’). The figure displays data for both subsets, following the immunological cascade and cytokine release at 10 µg ml−1 across the entire treatment duration (left panels) and at three different concentrations (0.1–10 µg ml−1) (right panels) of the indicated TCB at specific timepoints (denoted by asterisks). a, TCR (CD3) MFI highlights TCR internalization upon TCB stimulus in both subsets. bd, Brefeldin A and Monensin were used to trap cytokines secreted in individual cells. Here we detected pro-inflammatory cytokine release by means of TNFɑ (b) and IFNγ (c) in both subsets, followed by GzmB exocytosis (d). e, Proliferative state of CD45RO+ CD4+ and Ki67+ GzmB+ CD8+ by Ki67+ antibody staining reiterates potent activation of immune cells. f, Concatenated contour plot of GzmB+ intracellular expression in both T-cell subsets 48 h post treatment, in which each columnar cloud represents the individual condition indicated. af, n = 2. g, Heat map of multiplex cytokine analysis performed on supernatants from treated wells across all timepoints and TCBs administered. Normalized per cytokine, mean per condition plotted (n = 3). Source data
Fig. 3
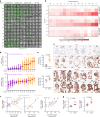
Fig. 3. mIF-based dissection of immune–epithelial interactions during TCB-mediated toxicity in intestinal organoids.
a, Representative single tiles (×20 magnification) of the 7-plex mIF images across all EpCAM TCB and NT TCB treatments (10 µg ml−1) across 0–72 h time course. PanCK+ organoids are surrounded by CD4+ (orange), CD8+ (turquoise), CD14+ (red) and CD20+ (yellow) immune cells. Caspase-3 (green) captures TCB-mediated off-tumour toxicity in the organoids. Nuclei are stained with DAPI (blue). Scale bar, 100 µm. b, An image at 24 h post EpCAM TCB administration highlights concentric partitioning in 25 μm margins around the initial ROI of the colon organoid (zone 2, red solid line): one inward margin (zone 1), two outward margins (zones 3 and 4). Solid line, inclusion; dotted line, exclusion. Scale bar, 100 µm. c, Mean of the absolute counts of CD4+ and CD8+ T lymphocytes in the zones around individual organoids across time highlights infiltration upon EpCAM TCB (10 µg ml−1) application. All displayed experiments in this figure were replicated at least three times, yielding similar results. Source data
Fig. 4
Fig. 4. Joint efficacy–safety analysis of TCB effects reveals differences in immune-cell engagement with healthy and tumour organoids.
a, Left: comparison of cellular architecture and target antigen expression between organoids and tumouroids by H&E and IHC at ×20. Right: quantification of target antigen expression by positive area for each antigen per individual organoid (nOrgCEA = 68, nTumCEA = 76; nOrgEpCAM = 60, nTumEpCAM = 85). ROUT outlier analysis was performed with a Q coefficient of 2%. Statistical analysis was performed using one-way ANOVA. Red line displays mean. Scale for both H&E and IHC, 100 µm. b, Representative single tiles (×20 magnification) of the 7-plex mIF images across all TCB treatments (10 µg ml−1) at 72 h, displaying panCK+ organoids and tumouroids (magenta) surrounded by CD4+ (orange), CD8+ (turquoise), CD14+ (red) and CD20+ (yellow) immune cells. Caspase-3 (green) captures TCB-triggered immune-induced apoptosis, nuclei are stained with DAPI (blue). Scale bar, 100 µm. c, Sum of panCK+ (grey) and caspase-3+ (green) epithelium of the organoids and tumouroids, respectively, detected in zone 2 (on epithelium) across the different TCB treatments and time (n = 3). d, Quantification of the 7-plex mIF images represented in b and e. Heat map of the absolute counts of T-cell subsets within the different zones of individual organoids and tumouroids across time and TCB treatment. e, Single tiles of the 7-plex mIF staining at ×20 magnification (colours explained in b) highlights substantial immune-intercalation dissimilarities between healthy and cancerous epithelium treated with EpCAM TCB (10 µg ml−1). Organoid image: highly CD4+ and CD8+ T-cell infiltrated organoids 24 h post administration. Tumouroid images: progressively killed tumouroid (caspase-3+ apoptotic bodies) over time, but devoid of T lymphocytes within the inner core of the tumouroid. Scale bar, 100 µm. All displayed experiments in this figure were replicated at least three times, yielding similar results. Source data
Fig. 5
Fig. 5. The organoid model detects donor-dependent differences in TCB-triggered toxicity.
a, Representative single tiles of merged brightfield and IF images of the 14-organoid donor lines co-cultured with PBMCs treated with EpCAM, CEA(hi), CEA(lo) and NT TCB (0.5 µg ml−1) at 48 h post TCB administration. ×5 magnification; scale bar per tile, 1 mm. Organoid donor number is random, following no particular order. b, Heat map of quantified caspase-3/7 fluorescence signal in dozens of segmented organoids per well (n = 3) for each TCB treatment across time. Mean fluorescence signal for each TCB condition normalized to the mean a.f.u. detected in the NT TCB control at each timepoint. The 14 different patient-derived organoid lines are displayed on the x axis and ordered by extent of apoptosis experienced. c, Representative IHC of CEA (top) and EpCAM (bottom) expression of the 14 embedded organoid lines at ×40 magnification. Organoid donors ordered by expression levels. Scale bar, 50 µm. d, Quantified target expression levels of cross sections in c for CEA (top) and EpCAM (bottom) indicated as positive area for each individual organoid. Donors are ordered by increasing target expression. e, Data in d as boxplots, with whiskers showing all points (minimum to maximum) of the mean target expression across all donors distinguished between the indicated intestinal regions for each organoid line (n = 7). Unpaired t-test (two-tailed) was performed. f, Correlation plots of the target expression between CEA or EpCAM and normalized caspase-3/7 signal of the respective TCB. R2 is provided per plot. g, Data as boxplots, with whiskers showing all points (min. to max.) of the mean of normalized caspase-3/7 across all donors distinguished between the indicated intestinal regions for each organoid line at 48 h post administration (n = 7). Unpaired t-test (two-tailed) was performed. All displayed experiments in this figure were replicated at least three times, yielding similar results. Source data
Extended Data Fig. 1
Extended Data Fig. 1. TCB-mediated apoptosis and T-cell infiltration across different donor-matched organoid–tumour pairs.
a, Comparison of morphology and target antigen expression between organoids and tumouroids by H&E and IHC at 20x. Scale: 100 μm. b, Representative images at 20x magnification of both donor-matched pairs 48 h post EpCAM TCB treatment (10 µg/mL), displaying E-cadherin+ organoids and tumouroids (magenta) surrounded by CD4+ (yellow) and CD8+ (turquoise) T cells. Caspase-3 (green) captures TCB-triggered immune-induced apoptosis, nuclei were counterstained with DAPI (blue). Scale: 100 μm. c, Quantification of EpCAM expression by positive area per individual organoid, plotted as boxplot, whiskers showing all points (min to max; n ≥ 6). Statistical analysis was performed by unpaired t-tests (two-tailed) and was defined as ****p < 0.0001. d, Sum of E-cadherin+ (grey) and caspase-3+ (green) epithelium of the organoids and tumouroids, respectively, detected in zone 2 (on epithelium) 48 h post EpCAM TCB treatment (n = 3). e and f, Allogeneic (allo) and autologous (auto) CD8+ T cell infiltration (panel e) and CD4+ T cell infiltration (panel f) per organoid and tumouroid (normalized for area of objects) as boxplot, whiskers showing all points (min to max; n ≥ 3). Statistical analysis was conducted by an unpaired t-test (two-tailed) and was defined as *p < 0.05, **p < 0.01. The displayed experiment in this figure was performed once. Source data
Extended Data Fig. 2
Extended Data Fig. 2. TCB-triggered T-cell infiltration is not mediated by CD103-E-cadherin interactions.
a and b, Chromogenic staining (brown) with according quantification of tight junctions (ZO-1; nOrgZO-1 = 59, nTumZO-1 = 58) and adherent junctions (e-Cadherin; nOrgZO-1 = 31, nTumZO-1 = 84) in organoids and tumouroids. 20x magnification, scale: 100 µm. Statistical analysis was conducted by an unpaired t-test (two-tailed) and was defined as ****p < 0.0001. Red line displays mean. c, Representative images at 20x magnification of organoids treated with EpCAM and CEA(hi) TCB (1 µg/mL) at 48 h. Top row displays TCBs only, bottom row is co-treated with an αE(CD103)β7-inhibitor cocktail (Etrolizumab (10 µg/mL) and an anti-Integrin β7 monoclonal antibody (10 µg/mL)). E-cadherin+ organoids (magenta) surrounded by CD4+ (orange), CD8+ (turquoise) and CEA+ (yellow) immune cells. Caspase-3 (green) captures TCB-triggered immune-induced apoptosis, nuclei are stained with DAPI (blue). Scale: 100 µm. d, Quantification of caspase+ area per organoid across different TCB treatments (48 h) with (+) and without (-) an αE(CD103)β7-inhibitor cocktail, plotted as boxplot, whiskers showing all points (min to max; nNT TCB = 5; nEpCAM TCB = 3; nCEA TCB = 3). Statistical analysis was conducted by an unpaired t-test (two-tailed) and was found to be non-significant (ns). e, Quantification of T cell infiltration per organoid area across different TCB treatments (48 h) with (+) and without (-) an αE(CD103)β7-inhibitor cocktail, plotted as boxplot, whiskers showing all points (min to max; nNT TCB = 4; nEpCAM TCB = 3; nCEA TCB = 3). Statistical analysis was performed by unpaired t-tests (two-tailed) and was defined as **p < 0.01 and non-significant (ns) (ns). f, FACS staining of CD103 on organoid and tumouroid co-cultured with PBMCs, treated with EpCAM TCB for 72 h. Data are presented as mean values ∓ SD (n = 3). Statistical analysis was conducted by an unpaired t-test (two-tailed) and was found to be non-significant (ns). g, Chromogenic DAB staining of CD103 (brown) in healthy small intestine tissue and different organoid-immune co-cultures, scanned at 20x. Scale: 100 µm. CD103+ immune cells only found in native SI tissue and expressed by tissue-resident memory T cells (TRMs). The displayed experiment in this figure was performed once. Source data
Extended Data Fig. 3
Extended Data Fig. 3. Target expression, rather than tumouroid morphology, governs TCB-induced damage and T-cell infiltration.
a, F-actin+ (Phalloidin) outlined tumouroids (yellow) stained with Caspase-3/7 (green) and DAPI+ (blue displayed as maximum intensity projection of a z-stack of around 100 μm. 20x magnification, scale: 200 μm. H&E highlights architectural differences between tumouroid donors at 40x magnification. Scale: 50 μm. Expression of target antigen EpCAM+ for each tumouroid donor. Imaged at 20x, scale: 100 μm. b, Representative images tumouroids 72 h post EpCAM and NT TCB treatment (10 µg/mL). Staining for target EpCAM+ (yellow) highlights highly Ki67+ (red) tumouroids surrounded by CD4+ (orange) and CD8+ (turquoise) T cells. Caspase-3 (green) captures TCB-triggered immune-induced apoptosis, nuclei were counterstained with DAPI (blue). Scale: 100 μm. c, Quantification of EpCAM expression by positive area per individual organoid, plotted as mean per replicate (n = 3). Statistical analysis was performed by unpaired t-tests (two-tailed) and was defined as *p < 0.05 and non-significant (ns). d, Representative images at 20x magnification of both donor-matched pairs 48 h post EpCAM TCB treatment (10 µg/mL), displaying E-cadherin+ organoids and tumouroids (magenta) surrounded by CD4+ (yellow) and CD8+ (turquoise) T cells. Caspase-3 (green) captures TCB-triggered immune-induced apoptosis, nuclei were counterstained with DAPI (blue). Scale: 100 μm. d, Quantification of caspase+ area per organoid treated with EpCAM and NT TCB (n = 3). e, CD8+ T cell infiltration and CD4+ T cell infiltration per tumouroid, plotted as mean (n = 3; normalized for area of objects). f and g, Correlation plot between caspase-3+ expression, CD4+ and CD8+ versus EpCAM expression per tumouroid at 48 h post (f) and 72 h post EpCAM TCB treatment (g). The displayed experiment in this figure was replicated once, yielding similar results. Source data

References

    1. Mellman I, Coukos G, Dranoff G. Cancer immunotherapy comes of age. Nature. 2011;480:480–489. doi: 10.1038/nature10673. - DOI - PMC - PubMed
    1. Waldman AD, Fritz JM, Lenardo MJ. A guide to cancer immunotherapy: from T cell basic science to clinical practice. Nat. Rev. Immunol. 2020;20:651–668. doi: 10.1038/s41577-020-0306-5. - DOI - PMC - PubMed
    1. Hodi FS, et al. Improved survival with ipilimumab in patients with metastatic melanoma. N. Engl. J. Med. 2010;363:711–723. doi: 10.1056/NEJMoa1003466. - DOI - PMC - PubMed
    1. Schadendorf D, et al. Pooled analysis of long-term survival data from phase II and phase III trials of ipilimumab in unresectable or metastatic melanoma. J. Clin. Oncol. 2015;33:1889–1894. doi: 10.1200/JCO.2014.56.2736. - DOI - PMC - PubMed
    1. Hegde PS, Chen DS. Top 10 challenges in cancer immunotherapy. Immunity. 2020;52:17–35. doi: 10.1016/j.immuni.2019.12.011. - DOI - PubMed

Publication types

Substances