. 2023 Dec 19;24(1):790.
doi: 10.1186/s12864-023-09875-4.

Evaluation of noninvasive biospecimens for transcriptome studies

Affiliations

Evaluation of noninvasive biospecimens for transcriptome studies

Molly Martorella et al. BMC Genomics. .

Abstract

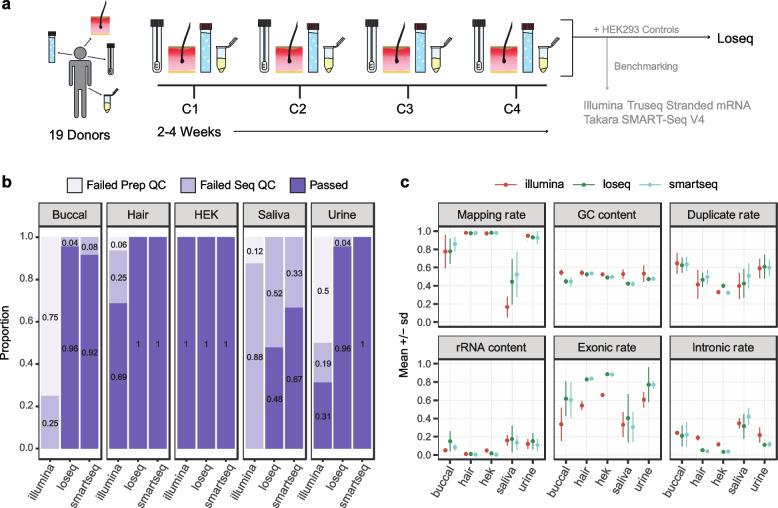
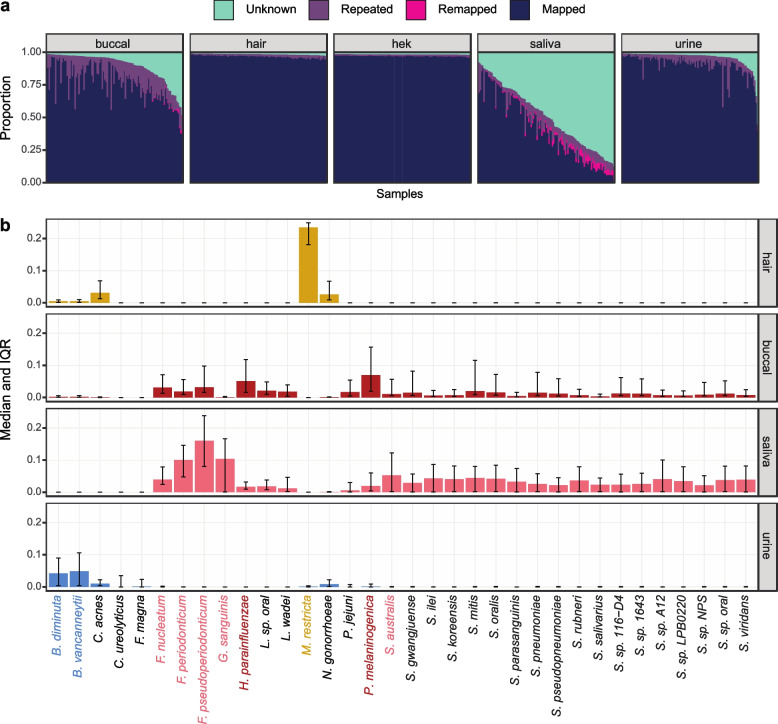
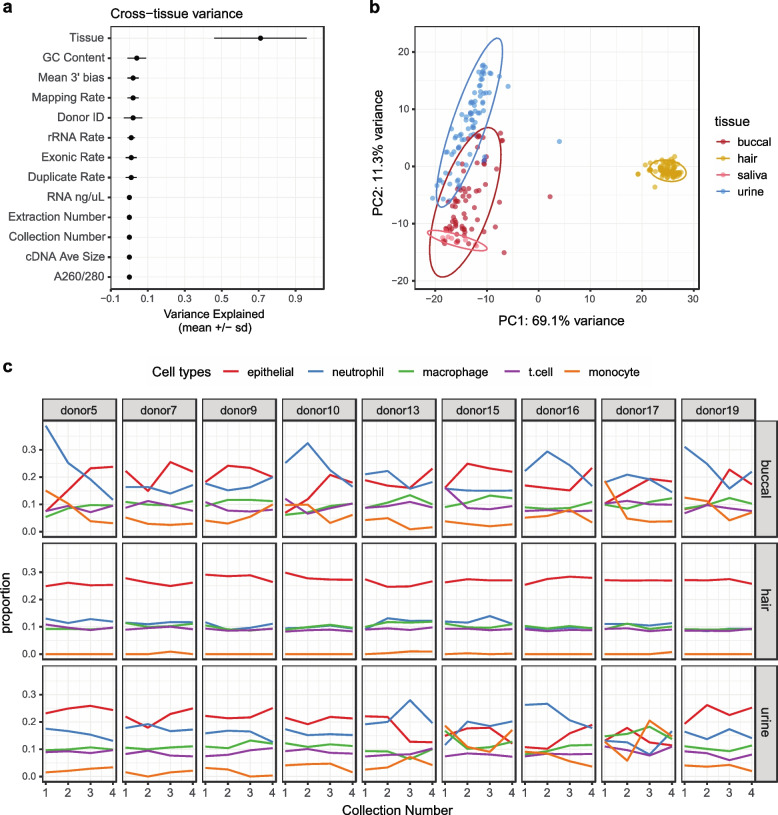
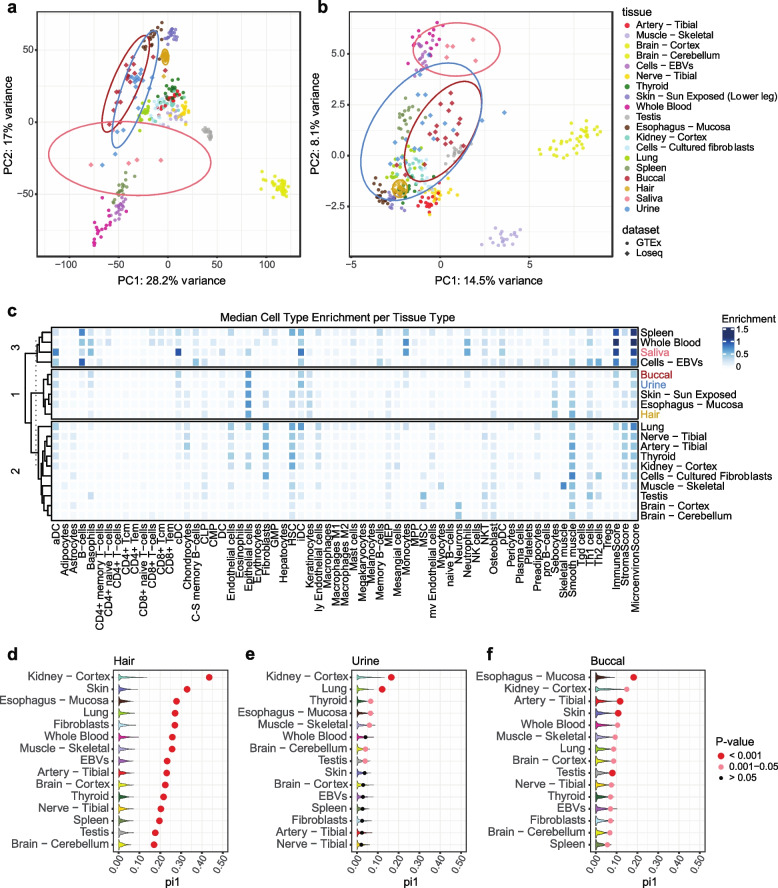
Transcriptome studies disentangle functional mechanisms of gene expression regulation and may elucidate the underlying biology of disease processes. However, the types of tissues currently collected typically assay a single post-mortem timepoint or are limited to investigating cell types found in blood. Noninvasive tissues may improve disease-relevant discovery by enabling more complex longitudinal study designs, by capturing different and potentially more applicable cell types, and by increasing sample sizes due to reduced collection costs and possible higher enrollment from vulnerable populations. Here, we develop methods for sampling noninvasive biospecimens, investigate their performance across commercial and in-house library preparations, characterize their biology, and assess the feasibility of using noninvasive tissues in a multitude of transcriptomic applications. We collected buccal swabs, hair follicles, saliva, and urine cell pellets from 19 individuals over three to four timepoints, for a total of 300 unique biological samples, which we then prepared with replicates across three library preparations, for a final tally of 472 transcriptomes. Of the four tissues we studied, we found hair follicles and urine cell pellets to be most promising due to the consistency of sample quality, the cell types and expression profiles we observed, and their performance in disease-relevant applications. This is the first study to thoroughly delineate biological and technical features of noninvasive samples and demonstrate their use in a wide array of transcriptomic and clinical analyses. We anticipate future use of these biospecimens will facilitate discovery and development of clinical applications.

Keywords: EQTLs; Hair follicles; Methods; Noninvasive RNA-sequencing; Transcriptomics; Urine cell pellets.


Conflict of interest statement

The authors declare no competing interests.

Figures

Fig. 1
Fig. 1
Noninvasive sample study design and processing outcomes. a Four collections (C1-C4) of four noninvasive tissues were collected from 19 donors over the course of 2–4 weeks per donor. All samples were processed using our in-house method, Loseq, while a subset was prepared using commercially available kits. Two biological replicates of HEK293 cell controls were included in triplicate for all library preparations. b Proportion of samples passing per tissue type and preparation. Failed Prep QC = exceeded 600 bp average size or less than 2 nM yield. Failed Seq QC = protein-coding and lncRNA depth less than 1 million. c RNA-seq quality metrics for all sequenced samples for each tissue and library preparation
Fig. 2
Fig. 2
Classification of unmapped reads in noninvasive samples. a Proportion of reads per sample. Mapped = aligned to hg38. Remapped = aligned to microbial species using Decontaminer. Repeated = highly abundant reads identified by FastQC. Unknown = reads not mapped, remapped, or highly abundant. b Normalized proportion of reads remapping per species for each tissue. The top 0.5% most abundant microbes are shown. Highlighted species have a median abundance > 0.05 for that tissue
Fig. 3
Fig. 3
Technical and biological sources of variance in noninvasive samples. a Factors contributing to variance in gene expression across tissues as determined by mixed linear modeling. b Principal component analysis using DESeq2 normalized counts and the top 1000 most variable genes. c GEDIT cell type proportion estimates across collections per donor. Only donors with samples passing QC for all collections are displayed here. Niche cell types were collapsed into larger categories (Supp. Fig. 7b), and the top 25% most abundant cell type categories across tissues are shown
Fig. 4
Fig. 4
Comparison of noninvasive samples to the GTEx dataset. a Noninvasive sample types projected onto the GTEx expression PCA space. Counts were normalized using DESeq2, centered and scaled, and the top 1000 most variable genes were used. Ellipses represent 95% confidence intervals. b Noninvasive sample types projected onto the top 1000 most variable rMATS splicing events in GTEx. c xCell cell type enrichment estimates per tissue. Tissues are clustered using k-means clustering. d, e, f GTEx eQTL replication estimates for hair, urine, and buccal samples. Dots show π1 calculated by selecting significant GTEx gene-variant pairs from the noninvasive data with sizing indicating permutation p-value significance. Violin plots show null π1 distributions generated from allele-frequency matched, randomly selected gene-variant pairs. 1000 permutations were performed
Fig. 5
Fig. 5
Sex-based expression differences in noninvasive samples. a Volcano plot of sex-based differentially expressed genes in hair. Genes highlighted in red are replicated sun-exposed skin findings in GTEx. Dotted line indicates 0.05 significance threshold. b Hair FGSEA of all genes ranked by z-score and using the Hallmark Gene set from MSigDB. c Sex-based differentially expressed genes in urine cell pellets. Genes highlighted in red are replicated kidney cortex findings in GTEx. d Urine FGSEA of all genes ranked by z-score and using the Hallmark Gene set from MSigDB
Fig. 6
Fig. 6
Use of noninvasive samples in disease-relevant analyses. a ASE for annotated stop-gain variants vs synonymous. Only sites with > 16 total counts were included. b Genes with median expression > 0.1 TPM in a tissue were intersected with the OMIM gene set. Shown is the intersection of OMIM genes captured across tissues. c Capture of common disease signals in the OpenTargets database. SES = Σ(evidence scores of disease genes expressed in a tissue)/ Σ(evidence scores of disease genes expressed in any included tissue)

Similar articles

Cited by

References

    1. Zeggini E, Gloyn AL, Barton AC, Wain LV. Translational genomics and precision medicine: Moving from the lab to the clinic. Science. 2019;365:1409–1413. doi: 10.1126/science.aax4588. - DOI - PubMed
    1. Supplitt S, Karpinski P, Sasiadek M, Laczmanska I. Current achievements and applications of transcriptomics in personalized cancer medicine. Int J Mol Sci. 2021;22:1422. doi: 10.3390/ijms22031422. - DOI - PMC - PubMed
    1. Wang M, Herbst RS, Boshoff C. Toward personalized treatment approaches for non-small-cell lung cancer. Nat Med. 2021;27:1345–1356. doi: 10.1038/s41591-021-01450-2. - DOI - PubMed
    1. Docking TR, et al. A clinical transcriptome approach to patient stratification and therapy selection in acute myeloid leukemia. Nat Commun. 2021;12:2474. doi: 10.1038/s41467-021-22625-y. - DOI - PMC - PubMed
    1. Cummings BB, et al. Improving genetic diagnosis in Mendelian disease with transcriptome sequencing. Sci Transl Med. 2017;9:09. doi: 10.1126/scitranslmed.aal5209. - DOI - PMC - PubMed

LinkOut - more resources