. 2023 Dec;13(12):e1515.
doi: 10.1002/ctm2.1515.

Single-cell and spatial transcriptomics reveal POSTN+ cancer-associated fibroblasts correlated with immune suppression and tumour progression in non-small cell lung cancer

Affiliations

Single-cell and spatial transcriptomics reveal POSTN+ cancer-associated fibroblasts correlated with immune suppression and tumour progression in non-small cell lung cancer

Chao Chen et al. Clin Transl Med. 2023 Dec.

Abstract

Background: Cancer-associated fibroblasts (CAFs) are potential targets for cancer therapy. Due to the heterogeneity of CAFs, the influence of CAF subpopulations on the progression of lung cancer is still unclear, which impedes the translational advances in targeting CAFs.

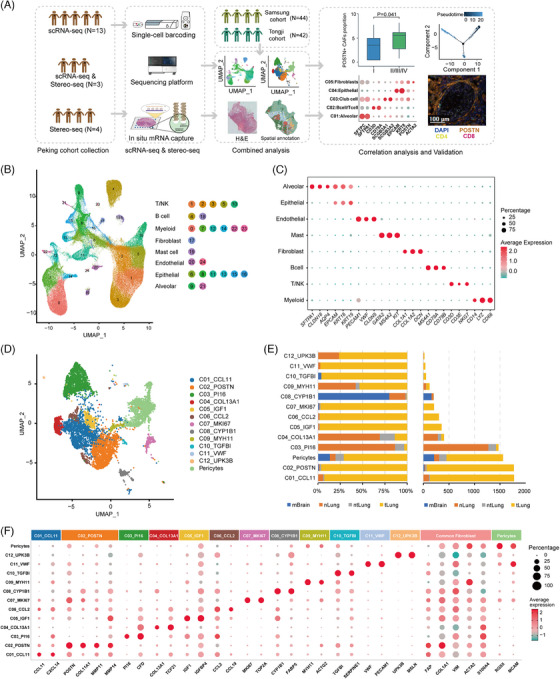
Methods: We performed single-cell RNA sequencing (scRNA-seq) on tumour, paired tumour-adjacent, and normal samples from 16 non-small cell lung cancer (NSCLC) patients. CAF subpopulations were analyzed after integration with published NSCLC scRNA-seq data. SpaTial enhanced resolution omics-sequencing (Stereo-seq) was applied in tumour and tumour-adjacent samples from seven NSCLC patients to map the architecture of major cell populations in tumour microenvironment (TME). Immunohistochemistry (IHC) and multiplexed IHC (mIHC) were used to validate marker gene expression and the association of CAFs with immune infiltration in TME.

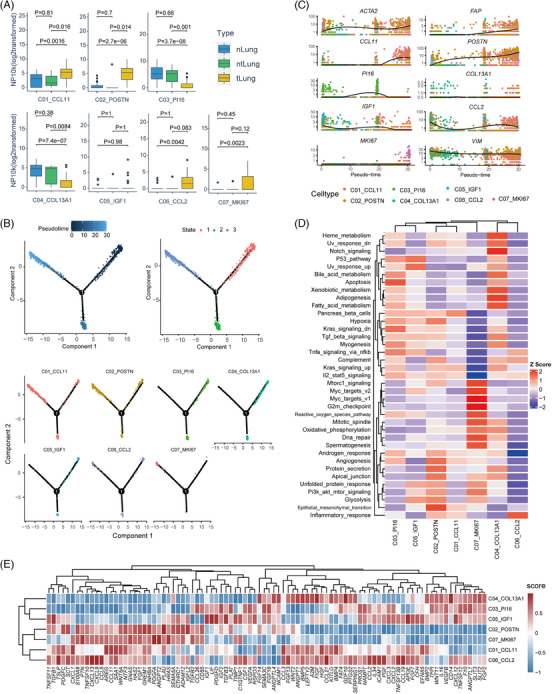
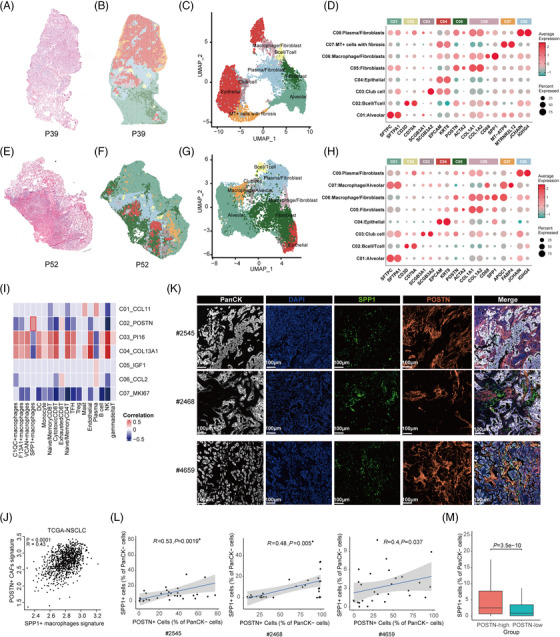
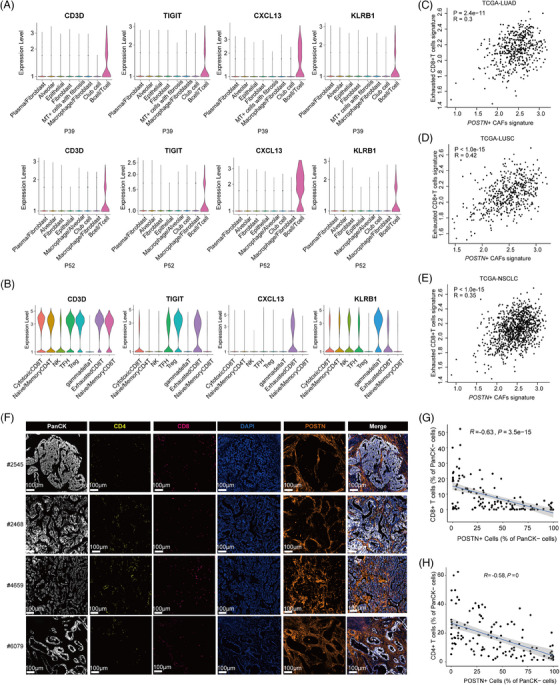
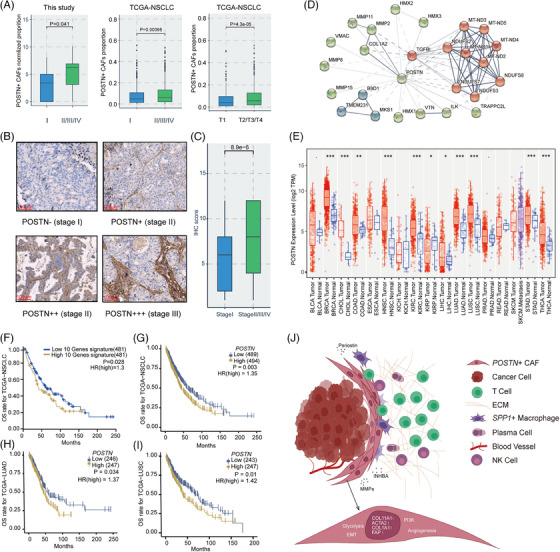
Results: A subcluster of myofibroblastic CAFs, POSTN+ CAFs, were significantly enriched in advanced tumours and presented gene expression signatures related to extracellular matrix remodeling, tumour invasion pathways and immune suppression. Stereo-seq and mIHC demonstrated that POSTN+ CAFs were in close localization with SPP1+ macrophages and were associated with the exhausted phenotype and lower infiltration of T cells. POSTN expression or the abundance of POSTN+ CAFs were associated with poor prognosis of NSCLC.

Conclusions: Our study identified a myofibroblastic CAF subpopulation, POSTN+ CAFs, which might associate with SPP1+ macrophages to promote the formation of desmoplastic architecture and participate in immune suppression. Furthermore, we showed that POSTN+ CAFs associated with cancer progression and poor clinical outcomes and may provide new insights on the treatment of NSCLC.

Keywords: POSTN; non-small cell lung cancer; single-cell RNA sequencing; spatial transcriptomics.


Conflict of interest statement

The authors declare that they have no competing interests.

Figures

FIGURE 1
FIGURE 1
Single‐cell transcriptomic profiling of fibroblasts in non‐small cell lung cancer (NSCLC) samples from three cohorts. (A) Schematic workflow outlining the samples, experimental strategies and bioinformatic analysis for this study. Peking cohort includes samples collected in this study, which were subjected to scRNA‐seq or Stereo‐seq. The scRNA‐seq data from Peking cohort were integrated with the published data of Samsung cohort (N = 44) and Tongji cohort (N = 42). Bioinformatic analysis of scRNA‐seq and Stereo‐seq data was performed and validated using The Cancer Genome Atlas (TCGA) bulk RNA‐seq data and multiplexed immunohistochemistry (mIHC). N denotes the number of patients. (B) UMAP plot of 162 036 cells from sixteen NSCLC patients in the Peking cohort. Each dot corresponds to one single cell. (C) Dot plot of the average expression of marker genes for eight main cell types. The dot size represents the percentage of cells expressing the genes in each cell type. (D) UMAP plot of fibroblasts from three cohorts coloured by subclusters. (E) Tissue origins of thirteen fibroblast subpopulations represented by the proportion of cells (left) and number of cells (right). (F) The dot plot showing the average expression of signature genes of thirteen fibroblast subpopulations. The dot size indicates the percentage of cells expressing the genes in each cluster. UMAP, Uniform Manifold Approximation and Projection.
FIGURE 2
FIGURE 2
Phenotypic and functional features of fibroblast subpopulations at single‐cell transcriptomic level. (A) Boxplot showing the enrichment of seven fibroblast subpopulations among different tissue types. Each point represents one sample. The p value was calculated with the Wilcoxon test. (B) Differentiation trajectories of seven fibroblast subpopulations in a two‐dimensional state‐space defined by Monocle2. Each point corresponds to a single cell. According to the pseudotime, the differentiation paths start from State1. CAF subtypes are enriched at the later stage (state 3). (C) Expression of signature genes of seven fibroblast subpopulations along the pseudo‐time axis using the states in (B) and including all the cells in C01 to C07 clusters. An individual point represents a single cell, and each colour corresponds to a fibroblast subpopulation. The solid black line indicates the pseudo‐time kinetics curves of marker genes, respectively. (D) Heatmap plot showing the activities of seven fibroblast subpopulations in cancer hallmark pathways. (E) Heatmap plot showing ligand expression in seven fibroblast subpopulations.
FIGURE 3
FIGURE 3
Stereo‐seq reveals spatial proximity of POSTN + cancer‐associated fibroblasts (CAFs) and SPP1 + macrophages in non‐small cell lung cancer (NSCLC). (A–H) Hematoxylin and eosin (H&E) staining of the consecutive slides for Stereo‐seq in P39 (A) and P52 (E). Unbiased clustering of Stereo‐seq bins and UMAP plot for the bin clusters for P39 (B and C) and P52 (F and G). Each colour corresponds to an annotated bin cluster. The expression of signature genes across annotated bin clusters for P39 (D) and P52 (H). The dot size represents the percentage of bins expressing the genes in each bin cluster. (I) Heat map depicting the spearman correlation between CAF sub‐populations and other major cell types using scRNA‐seq data of three cohorts. The correlations with p values greater than .1 were marked as gray. (J) Spearman correlations of the gene signature scores of the POSTN + CAFs (y‐axis) with those of SPP1 + macrophages (x‐axis) using The Cancer Genome Atlas (TCGA)‐NSCLC data. (K) Representative multiplexed immunohistochemistry (mIHC) staining images of tumour cells, POSTN+ CAFs, and SPP1+ macrophages in formalin‐fixed paraffin‐embedded (FFPE) tumour tissues of three NSCLC patients. PanCK (white), DAPI (blue), SPP1 (green), POSTN (orange), in individual and merged channels are shown. Scale bar, 100 μm. (L) Correlation analysis of SPP1+ cells and POSTN+ cells based on mIHC staining in FFPE tumour tissues of three NSCLC patients. (M) Proportions of SPP1+ cells in POSTN‐high and POSTN‐low regions in FFPE tumour tissues of fifteen NSCLC patients. About 30 regions (including POSTN‐high and POSTN‐low regions, 931 × 698 μm per region) were randomly selected from each tumour sample for Spearman correlation analysis and cell proportion calculation. Wilcoxon test was used to assess statistical significance in M. UMAP, Uniform Manifold Approximation and Projection.
FIGURE 4
FIGURE 4
POSTN + cancer‐associated fibroblasts (CAFs) were associated with the exhausted phenotype and lower infiltration of T cells. (A) Violin plots showing expression levels of T cell marker genes across spatial bin clusters in P39 and P52. (B) Violin plots showing marker gene expression in T/NK subclusters based on the scRNA‐seq data of Peking cohort. (C–E) Spearman correlations of gene signatures of exhausted CD8+ T cells and POSTN + CAFs in The Cancer Genome Atlas (TCGA)‐LUAD (C), TCGA‐LUSC (D) and TCGA‐non‐small cell lung cancer (NSCLC) (E) samples. (F) Multiplexed immunohistochemistry (mIHC) staining of NSCLC formalin‐fixed paraffin‐embedded (FFPE) samples showing the localization of POSTN + CAFs, T cells and tumour cells. PanCK (white), CD4 (yellow), CD8 (red), DAPI (blue), POSTN (orange), in individual and merged channels are shown. Scale bar, 100 μm. Experiments were performed in tumour samples from four NSCLC patients. (G and H) Spearman correlation analysis of POSTN+ cells and CD8+ T (G) or CD4+ T cells (H) based on tumour regions selected from each sample. LUAD, lung adenocarcinoma; LUSC, lung squamous cell carcinoma.
FIGURE 5
FIGURE 5
POSTN + cancer‐associated fibroblasts (CAFs) were correlated with cancer progression and poor prognosis. (A) Box plots showing the enrichment of POSTN + CAFs at different clinical stages in three cohorts of this study and the The Cancer Genome Atlas (TCGA)‐non‐small cell lung cancer (NSCLC) cohort, respectively. (B) Immunohistochemistry (IHC) staining of periostin (POSTN) in NSCLC formalin‐fixed paraffin‐embedded (FFPE) samples across different clinical stages. (C) Box plot comparing IHC scores of POSTN between early‐stage NSCLC samples (stage I) and advanced NSCLC samples (stage II–IV). (D) Interaction networks of POSTN with other genes based on STRING database analysis. (E) Expression of POSTN among pan‐cancer tumour tissues and normal tissues, respectively. Wilcoxon test, ·p < .1, *p < .05, **p < .01, ***p < .001. (F‐I) Kaplan–Meier analysis of overall survival rates in TCGA‐NSCLC/LUAD/LUSC cohorts according to expression levels of POSTN + CAFs gene signature or POSTN. (J) Schematic illustration of pro‐tumour and immunosuppressive roles of POSTN + CAFs in the tumour microenvironment (TME) of NSCLC. LUAD, lung adenocarcinoma; LUSC, lung squamous cell carcinoma.

References

    1. Sung H, Ferlay J, Siegel RL, et al. Global cancer statistics 2020: GLOBOCAN estimates of incidence and mortality worldwide for 36 cancers in 185 countries. CA Cancer J Clin. 2021;71(3):209‐249. - PubMed
    1. Horvath L, Thienpont B, Zhao L, Wolf D, Pircher A. Overcoming immunotherapy resistance in non‐small cell lung cancer (NSCLC)—novel approaches and future outlook. Mol Cancer. 2020;19(1):141. - PMC - PubMed
    1. Baghban R, Roshangar L, Jahanban‐Esfahlan R, et al. Tumor microenvironment complexity and therapeutic implications at a glance. Cell Commun Signal. 2020;18(1):59. - PMC - PubMed
    1. Gibney GT, Weiner LM, Atkins MB. Predictive biomarkers for checkpoint inhibitor‐based immunotherapy. Lancet Oncol. 2016;17(12):e542‐e551. - PMC - PubMed
    1. Hellmann MD, Ciuleanu TE, Pluzanski A, et al. Nivolumab plus ipilimumab in lung cancer with a high tumor mutational burden. N Engl J Med. 2018;378(22):2093‐2104. - PMC - PubMed

Publication types

MeSH terms

Substances