. 2024 Mar;11(9):e2304454.
doi: 10.1002/advs.202304454. Epub 2023 Dec 19.

Acidic Osteoid Templates the Plywood Structure of Bone Tissue

Affiliations

Acidic Osteoid Templates the Plywood Structure of Bone Tissue

Marc Robin et al. Adv Sci (Weinh). 2024 Mar.

Abstract

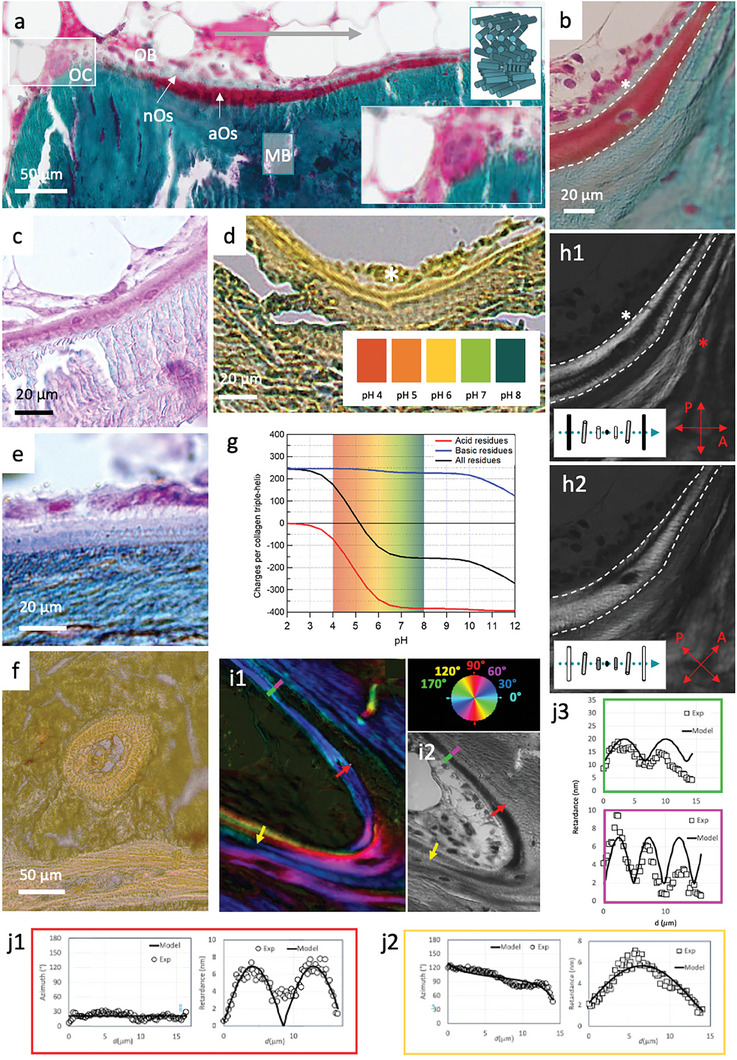
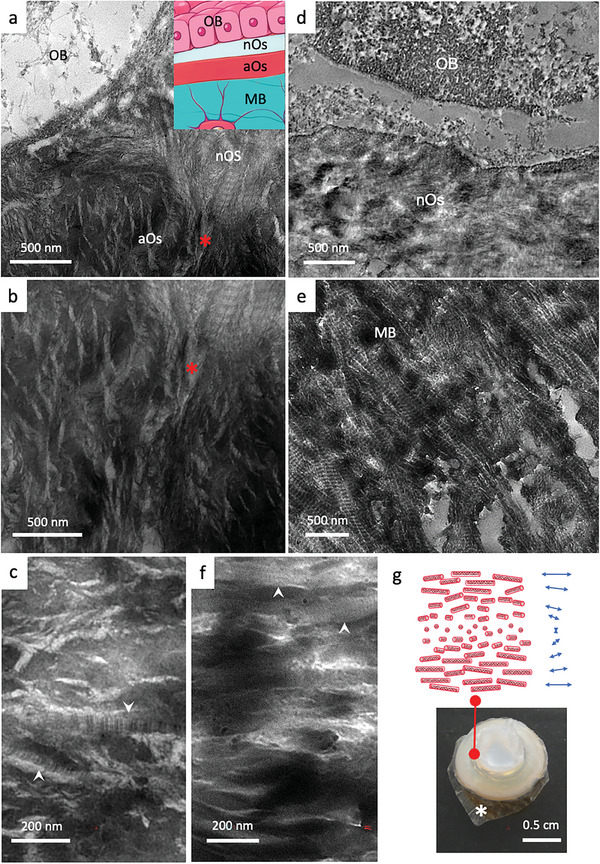
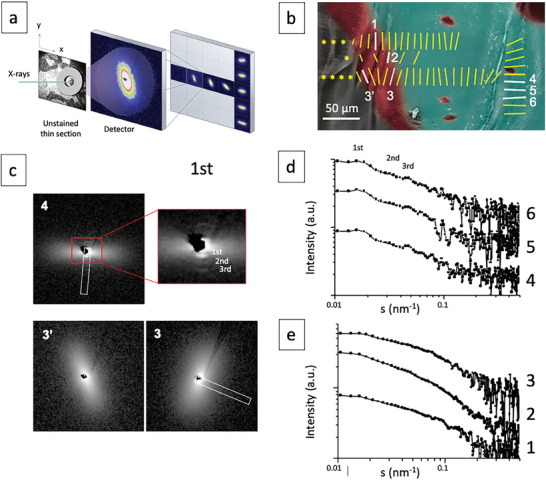
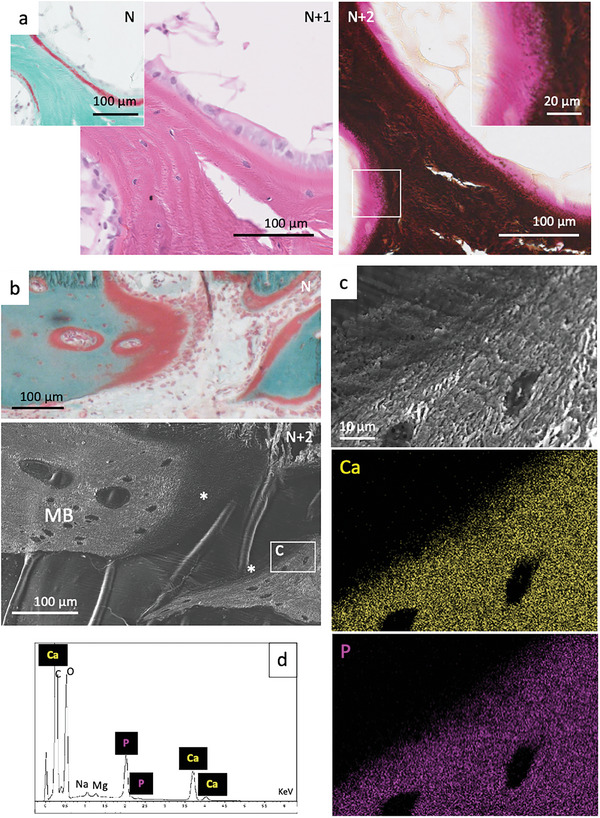
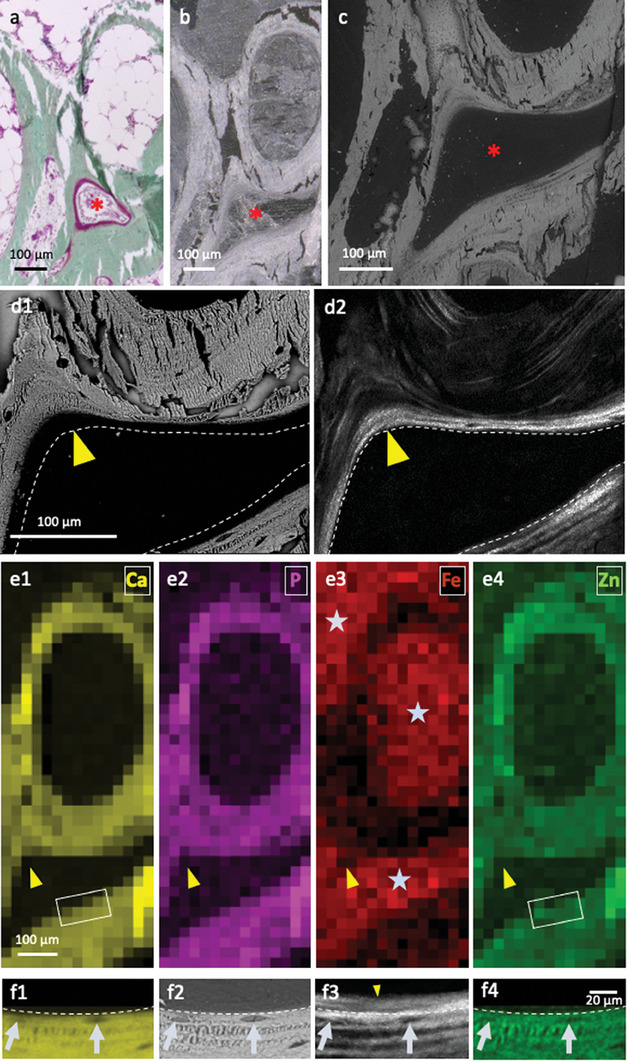
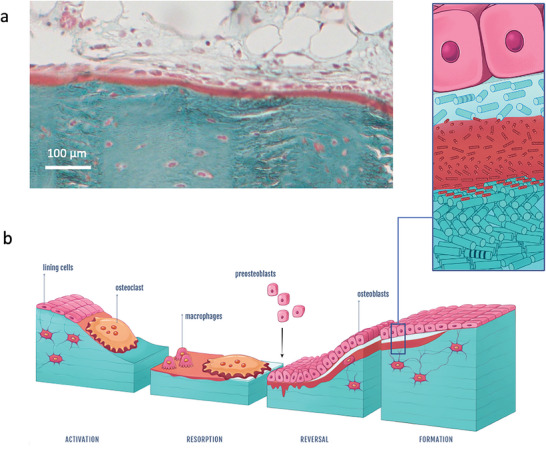
Bone is created by osteoblasts that secrete osteoid after which an ordered texture emerges, followed by mineralization. Plywood geometries are a hallmark of many trabecular and cortical bones, yet the origin of this texturing in vivo has never been shown. Nevertheless, extensive in vitro work revealed how plywood textures of fibrils can emerge from acidic molecular cholesteric collagen mesophases. This study demonstrates in sheep, which is the preferred model for skeletal orthopaedic research, that the deeper non-fibrillar osteoid is organized in a liquid-crystal cholesteric geometry. This basophilic domain, rich in acidic glycosaminoglycans, exhibits low pH which presumably fosters mesoscale collagen molecule ordering in vivo. The results suggest that the collagen fibril motif of twisted plywood matures slowly through self-assembly thermodynamically driven processes as proposed by the Bouligand theory of biological analogues of liquid crystals. Understanding the steps of collagen patterning in osteoid-maturation processes may shed new light on bone pathologies that emerge from collagen physico-chemical maturation imbalances.

Keywords: acidity; biomineralization; bone; collagen; liquid-crystal; osteoid; plywood.


Conflict of interest statement

The authors declare no conflict of interest.

Figures

Figure 1
Figure 1
Acidic osteoid texture and composition by optical microscopies. Light microscopy overview a) of bone histological sections stained with Goldner trichrome. Acidic osteoid tissue (aOs), osteoclasts (OC), and osteoblasts (OB) nuclei are stained in deep red. Collagen fibrils in mature bone (MB) and in neutral osteoid (nOs) are stained in blue/green. A schematic representation of the mineralized collagen fibrils arrangement (in a twisted plywood model) is shown in the upper inset. The white marked rectangle is enlarged in the lower inset. b) Similar staining of a magnified bone region showing aOs (between the white dashed lines) and nOs (white *). Additional bone components are visible in bone histological sections colored with c), basic fuchsin staining, d), a universal pH indicator essay observed by DIC which reveals the presence of glycosaminoglycans and a lower pH in aOs compared to the surrounding nOs and MB tissues, and e), Alcian blue/Ziehl fuchsin double‐stain reveals acidic glycosaminoglycans (violet) in the aOs. f), Histological thin section of compact bone colored with a universal pH indicator essay (color chart in d), observed by DIC. g), calculated charge per collagen triple‐helix plotted as a function of pH. Collagen molecules are slightly negative in the range of pH 5–6. h) polarization images of (b). Comparison between light (b) and polarized light h1,h2) observations demonstrates the absence of birefringence in the nOs and reveals the presence of thin alternating bright and dark bands in the aOs and in the immediately adjacent MB (red *). The schematic represents the resulting intensity of transmitted light when the optical axis lies between the crossed polarizers at 0° (h1) and 45° (h2). The blue dotted line denotes the helical axis. i) Histological section showing twisted plywood motifs in MB and aOs by quantitative LC‐polscope, and observed i2), by light microscope. j1,j2) Retardance and Azimuth of the birefringence quantified on the red and yellow arrows, respectively thanks to the axis orientation (color wheel). A cholesteric model (see text and Experimental Section) well fits the experimental measurements. j3) Retardance of the birefringence quantified on the green (aOs) and violet (MB) lines which are continuous.
Figure 2
Figure 2
Investigations by TEM of collagen ultrastructure in bone tissues (osteoid, mature bone) and in synthetic acidic collagen mesophases which form physical gels. a,b) TEM micrographs of osteoid domains (nOs and aOs) in close proximity with an osteoblast (OB) (the red * identified the same feature in adjacent regions) show that collagen fibrils are typical for the nOs but hardly found in the aOs. The inset in a is a schematic representation of a histological bone section colored with Goldner's trichrome stain. From top to down, the monolayer that forms osteoblasts (OB), the neutral osteoid (nOs), the acidic osteoid tissue (aOs), and mature bone (MB). c) aOs appears denser to electrons with parallel packing of non‐fibrillar structures. Some fibrils are rarely observed (white arrows). Micrograph in d) shows the newly secreted nOs with randomly oriented cross‐striated fibrils in contact with an OB. In e) the classical anisotropic packing of mineralized cross‐striated fibrils in MB is observed, i.e., arced pattern revealed by an oblique section performed on the twisted plywood organization. f) in vitro lyotropic acidic solution of collagen molecules concentrated in the presence of apatite ion precursors exhibit textural similarities with aOs domains (c) are observed with locally aligned domains of collagen molecules and occasional fibrils (white arrows in c and f). g) A schematic representation of the spatial organization of collagen molecules shows a long‐range helical organization of collagen triple helices (cholesteric phase). Image of a highly concentrated acidic solution of collagen molecules (≈250 mg mL−1) containing apatite ion precursors (calcium, phosphate, and carbonate ions). Collagen solutions are no longer fluid at such concentration owing to their high viscosity. The sample is supported by a dialysis membrane (*).
Figure 3
Figure 3
Collagen orientation by SAXS. a) The aOs and surrounding tissues is identified optically with a metal ring on the unstained serial histological thin section. The sample is scanned with a microfocus beam along a vertical and horizontal axis (x,y arrows) and a diffraction pattern is recorded at each point. b) Scattering patterns are schematically represented on the corresponding colored SEM image (blue and red colors represent MB and aOs, respectively). The signal orientation (direction of the bars) and degree of alignment (length of the bars) are shown as well as the locations of the SAXS line scans (a 90° rotation of the yellow bars corresponds to the direction of the fibrils, see Figure S8); a continuity in signal orientation is observed between mature bone (MB) and acidic osteoid (aOs). In contrast, there is no SAXS signal (yellow stars) beyond the acidic osteoid. c) 2D SAXS pattern 4 and 3‐3′ corresponds to a signal recorded for MB and aOs in (b) (white bars), respectively. The axial orientation is highlighted by a white rectangle and the red rectangle in 4 corresponds to the enlarged section of the central scattering contrast. d,e) Series of SAXS patterns extracted from the MB (d) and aOs (e) domains from (b). The profiles 4–6 are typical for fully mineralized bone domains where only the 1st‐3rd orders of collagen are observed, in contrast to profiles 1–3, extracted from the aOs domain.
Figure 4
Figure 4
Mineralization and elemental mapping near osteoid domains. a) Observations by optical light microscopy of successive bone histological thin sections from the same region colored with Goldner trichrome (N), haematoxylin and eosin (N+1) and von Kossa (N+2) stains. The inset in (N+2) corresponds to the enlarged section of the white rectangle where a gradient in mineralization (dark deposits) is clearly identified from the non‐mineralized tissue (pink). b) Observations by optical light microscopy of a bone histological thin sections colored with Goldner's trichrome stain (N) and a subsequent section (N+2) by SEM. SEM micrograph shows a smooth texture for the acidic osteoid domain (*) which is distinguishable from the fibrous collagen of the surrounding bone (MB). The white rectangle indicates the enlarged section that is shown in c) and analyses by EDX d). The elemental mapping of the area shows the presence of calcium (Ca in yellow) and phosphorus (P in purple) gradients.
Figure 5
Figure 5
Identification of domains in interest on subsequent sections and different techniques, mineralized collagen and elemental mapping at moderate and high resolution. Observations by light microscopy of a histological thin section stained with Goldner trichrome a); the unstained subsequent thin section observed by PLM b) and backscatter SEM c). The red star (*) shows the same area. d1) Backscatter SEM and d2) SHG maps of the same region in a histological thin section of bone reveals the spatial relationship between lamellae and aOs leading to new bone formation (yellow arrowheads). Dashed line in panels b and a placed as a guide to the eye for direct comparison and interpretation of the different imaging contrasts. e) XRF spectra, matching panels including areas (d1) and (d2) (yellow arrowheads), provide complementary contrasts of the distributions of calcium (Ca), phosphorus (P), iron (Fe), and zinc (Zn). Note that Fe is found exclusively in bone marrow (grey stars) whereas Zn, despite its low density, closely matches the distributions of apatite mineral (Ca, P). f) Comparative imaging of the inset marked in e1,e4) by EDX f1, f4), backscattered SEM f2) and SHG f3). The chemical mapping of Ca (f1) matches the backscattered signal (f2) and the signal from Zn (f4) with osteocytes visibly embedded in the mineralized lamellae. The same cells are visible in SHG (f3) highlighting the existence of a ≈8 µm thick non‐mineralized and non‐fibrillar collagen layer of aOs juxtaposed on the bone.
Figure 6
Figure 6
Alternative aOs/osteoblasts interface and schematic illustration of typical bone remodeling with the proposed mechanism for twisted plywood formation through acidic collagen mesophase. a) Light microscopy overview of a bone histological section stained with Goldner trichrome showing that nOs is not always seen; osteoblasts can be in contact with aOs. b) The schematic representation of the proposed mechanism for bone remodelling process includes the different steps observed here and matching observations described in the literature. (right) After the activation phase, bone resorption occurs via osteoclasts (multinucleate cell) through proteolytic enzymes and protons release (resorption phase). After further debris removal via macrophages, osteoblasts (mononuclear cuboid cells in pink) produce collagen fibrils (forming the newly osteoid tissue in light blue) (reverse phase) that progressively dissolve into or interact with the acidic ECM domains (in red) in which a collagen‐based mesophase is formed via molecule accretion. Thereafter, stabilization of the cholesteric geometry occurs through the co‐precipitation of collagen fibrils; MB is formed exhibiting a mineralized twisted plywood pattern (formation phase). (left) Schematic representation of the collagen molecules‐based domain (aOs) that co‐exists between two fibrillar tissues (nOs and MB).

Similar articles

References

    1. Neville A. C., Biology of Fibrous Composites: Development Beyond the Cell Membrane, Cambridge University Press, 1993.
    1. Parfitt A. M., J. Cell. Biochem. 1994, 55, 273. - PubMed
    1. Mckee M. D., Nanci A., Microsc. Res. Tech. 1996, 33, 141. - PubMed
    1. Ingram R. T., Clarke B. L., Fisher L. W., Fitzpatrick L. A., J. Bone Miner. Res. 1993, 8, 1019. - PubMed
    1. Alford A. I., Kozloff K. M., Hankenson K. D., Int. J. Biochem. Cell Biol. 2015, 65, 20. - PubMed

Publication types

LinkOut - more resources