. 2023 Dec 4:14:1297484.
doi: 10.3389/fimmu.2023.1297484. eCollection 2023.

Immune and oxidative stress disorder in ovulation-dysfunction women revealed by single-cell transcriptome

Affiliations

Immune and oxidative stress disorder in ovulation-dysfunction women revealed by single-cell transcriptome

Lingbin Qi et al. Front Immunol. .

Abstract

Introduction: Ovulation dysfunction is now a widespread cause of infertility around the world. Although the impact of immune cells in human reproduction has been widely investigated, systematic understanding of the changes of the immune atlas under female ovulation remain less understood.

Methods: Here, we generated single cell transcriptomic profiles of 80,689 PBMCs in three representative statuses of ovulation dysfunction, i.e., polycystic ovary syndrome (PCOS), primary ovarian insufficiency (POI) and menopause (MENO), and identified totally 7 major cell types and 25 subsets of cells.

Results: Our study revealed distinct cluster distributions of immune cells among individuals of ovulation disorders and health. In patients with ovulation dysfunction, we observed a significant reduction in populations of naïve CD8 T cells and effector memory CD4 T cells, whereas circulating NK cells and regulatory NK cells increased.

Discussion: Our results highlight the significant contribution of cDC-mediated signaling pathways to the overall inflammatory response within ovulation disorders. Furthermore, our data demonstrated a significant upregulation of oxidative stress in patients with ovulation disorder. Overall, our study gave a deeper insight into the mechanism of PCOS, POI, and menopause, which may contribute to the better diagnosis and treatments of these ovulatory disorder.

Keywords: conventional dendritic cell; immune cell disorder; ovulation dysfunction; oxidative stress; single-cell RNA sequencing.


Conflict of interest statement

The authors declare that the research was conducted in the absence of any commercial or financial relationships that could be construed as a potential conflict of interest.

Figures

Figure 1
Figure 1
Single-cell transcriptomic profiles of PBMCs in ovulation-dysfunctional and healthy females. (A) Overview of sample collection, sequencing, and downstream analyses. (B) UMAP plot of the scRNA-seq profiled dataset for seven major cell types. (C) UMAP plot of the distribution of single cells among the different groups. (D). Violin plots showing marker genes for diverse immune cell subsets. (E) Bar plot showing the percentage of major cell types in PBMCs of each individual. The cell counts for each sample are listed on the right-hand side.
Figure 2
Figure 2
Immunological alterations in patients with ovulation disorders. (A) UMAP plot showing all the identified cells from ovulated and healthy females. (B) Violin plots showing special markers for all sub-cell types. (C) Table showing the percentages of each cell type among different groups (health/menopause/PCOS/POI). Ovulation-dysfunctional and healthy groups were expressed as percentages of the total immune cell types. (D) Boxplot showing the proportions of cells with significant differences in each sample colored by individual. The x-axis corresponds to each patient group. Significant differences compared to control samples were calculated by ordinary one-way ANOVA.
Figure 3
Figure 3
Detailed characterization of DCs in each ovulation-dysfunction group. (A) Heatmaps showing the distribution of DEGs between PCOS, POI, Meno, and Health groups in major cell subtypes. The red box shows the differential genes of DC cells by comparing PCOS, POI, and Meno to Health. (B) Upset plot showing upregulated (left) and downregulated (right) DEGs in DC. (C) The representative GO terms of upregulated and downregulated DEGs overlapped among PCOS, POI, and Meno in DCs. (D) A scatter plot of the outgoing and incoming interaction strengths identified significant changes in sending or receiving signals among diverse cell types in each group. (E) Overview of communication probabilities mediated by ligand–receptor pairs from cDCs to rested cell types significantly increased in the anovulatory groups.
Figure 4
Figure 4
Abnormally activated cell cytotoxins and inflammatory response in ovulation dysfunction. (A, B) Box plot showing the lineage score of (A) pro-inflammatory factors in CD8 T cells and (B) cytotoxic mediators in both CD14 and CD16 monocytes and the different groups. (C, D) Dotplot depicting the expression of detailed genes for calculating the (C) pro-inflammatory factor score in CD8 T cells and (D) cytotoxic mediator score in CD14/CD16 monocytes among different groups. (D) Dotplot showing the expression of genes involved in immunoglobulin in the B cells of each group.
Figure 5
Figure 5
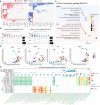
Identification of key regulons of DCs in ovulation disorders. (A) Rank of regulons in cDCs between healthy subjects and others (PCOS, POI, and MENO) based on the Regulon Specificity Score (RSS). The top-ranked regulon activities are shown in the picture. (B) Dotplot showing the AUC score for each regulon in each group. (C) Network of selected regulons and their target genes in group of ovulation-dysfunction and healthy group. (D) Venn diagram showing the overlapping genes that were upregulated in DCs and regulated by ovulation-specific regulons in (C). (E) Bar plots of the representative GO terms of the overlapping genes.
Figure 6
Figure 6
Integrated data analysis revealed that aberrant oxidative stress occurs in both granulosa cells and PBMCs during ovulation disorders. (A) UMAP plot of all identified cells from the HFD and RD mice. (B) UMAP plot of all the identified cells from young and aged monkeys. (C) Venn diagram showing the upregulation in HFD and aging granulosa cells. (D) Venn diagram showing the upregulation in HFD and aging oocytes. (E) Dotplot depicting representative GO terms of genes upregulated in both mouse and monkey granulosa cells. (F,G) Dotplot showing the expression of genes involved in representative GO terms in (F) granulosa cells of mice and monkeys separately and (G) PBMCs of humans in each group.

References

    1. Brazdova A, Senechal H, Peltre G, Poncet P. Immune aspects of female infertility. Int J Fertil Steril (2016) 10(1):1–10. doi: 10.22074/ijfs.2016.4762 - DOI - PMC - PubMed
    1. Sen A, Kushnir VA, Barad DH, Gleicher N. Endocrine autoimmune diseases and female infertility. Nat Rev Endocrinol (2014) 10(1):37–50. doi: 10.1038/nrendo.2013.212 - DOI - PubMed
    1. Carp HJ, Selmi C, Shoenfeld Y. The autoimmune bases of infertility and pregnancy loss. J Autoimmun (2012) 38(2-3):J266–74. doi: 10.1016/j.jaut.2011.11.016 - DOI - PubMed
    1. Piccinni MP, Lombardelli L, Logiodice F, Kullolli O, Parronchi P, Romagnani S. How pregnancy can affect autoimmune diseases progression? Clin Mol Allergy (2016) 14:11. doi: 10.1186/s12948-016-0048-x - DOI - PMC - PubMed
    1. Jose-Miller AB, Boyden JW, Frey KA. Infertility. Am Fam Physician (2007) 75(6):849–56. - PubMed

Publication types