. 2023 Oct 27;3(12):100426.
doi: 10.1016/j.xgen.2023.100426. eCollection 2023 Dec 13.

Preleukemic single-cell landscapes reveal mutation-specific mechanisms and gene programs predictive of AML patient outcomes

Affiliations

Preleukemic single-cell landscapes reveal mutation-specific mechanisms and gene programs predictive of AML patient outcomes

Tomoya Isobe et al. Cell Genom. .

Abstract

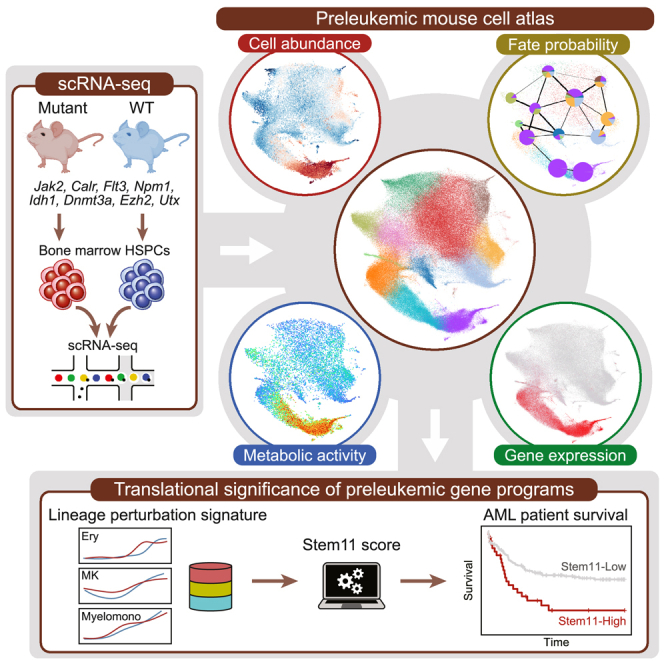
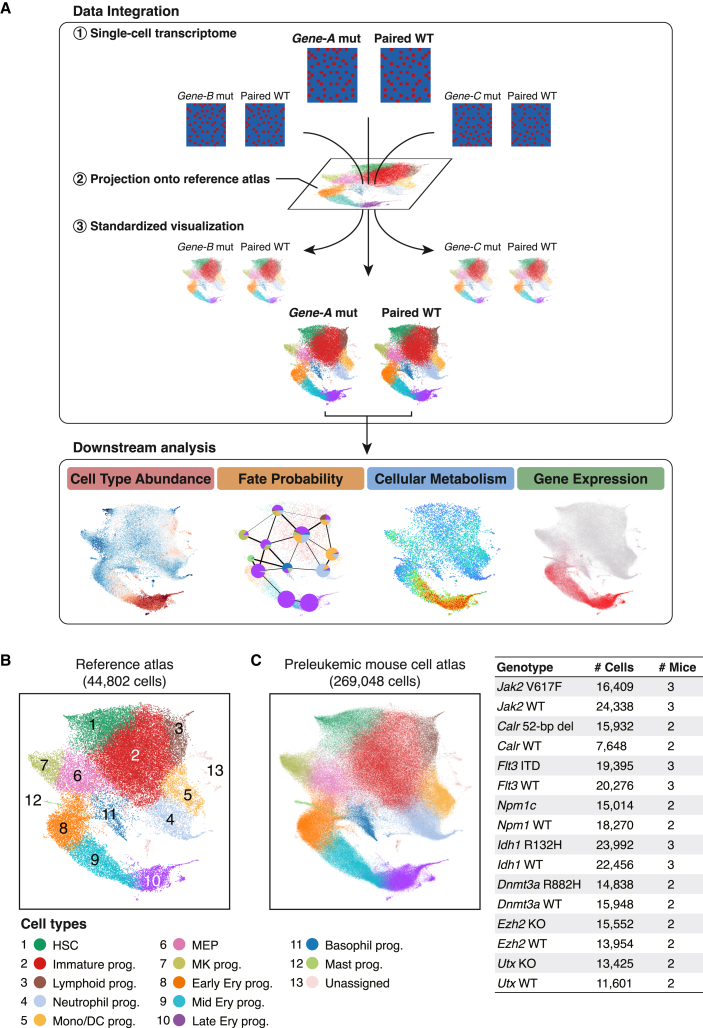
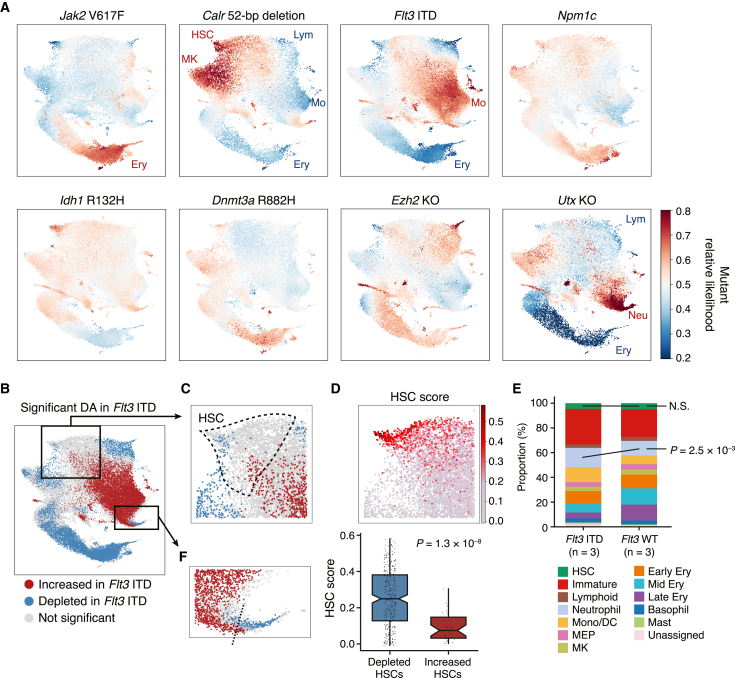
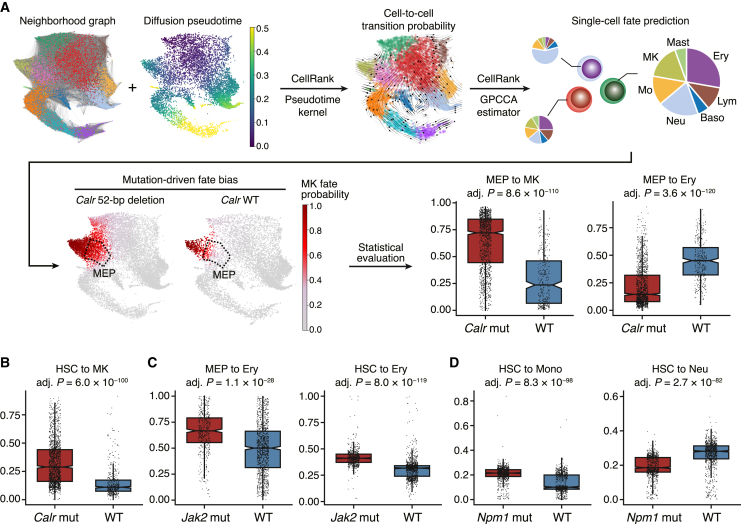
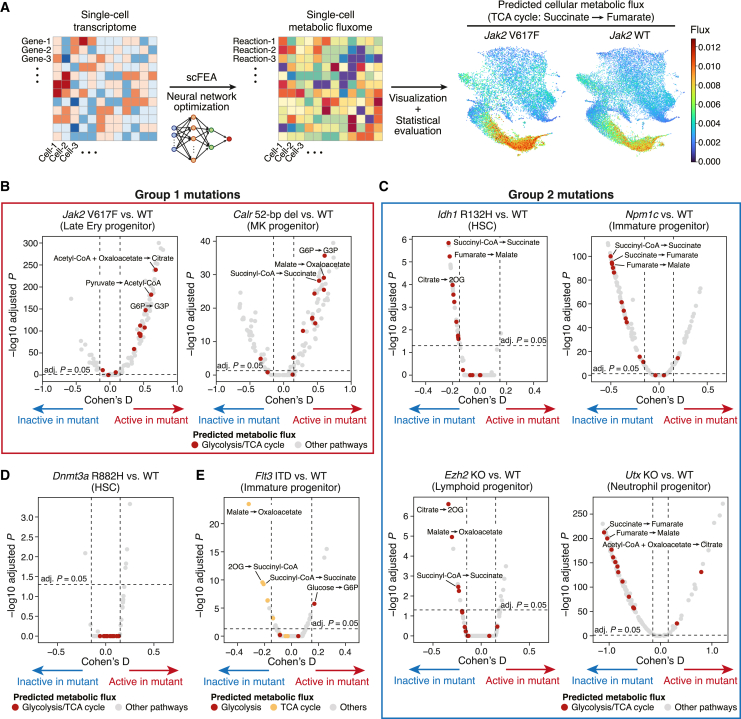
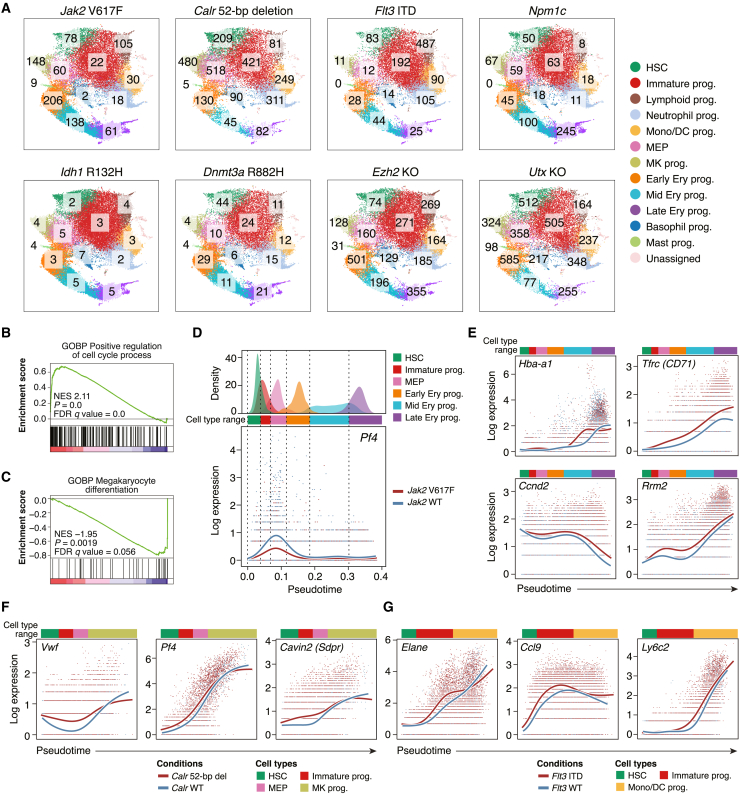
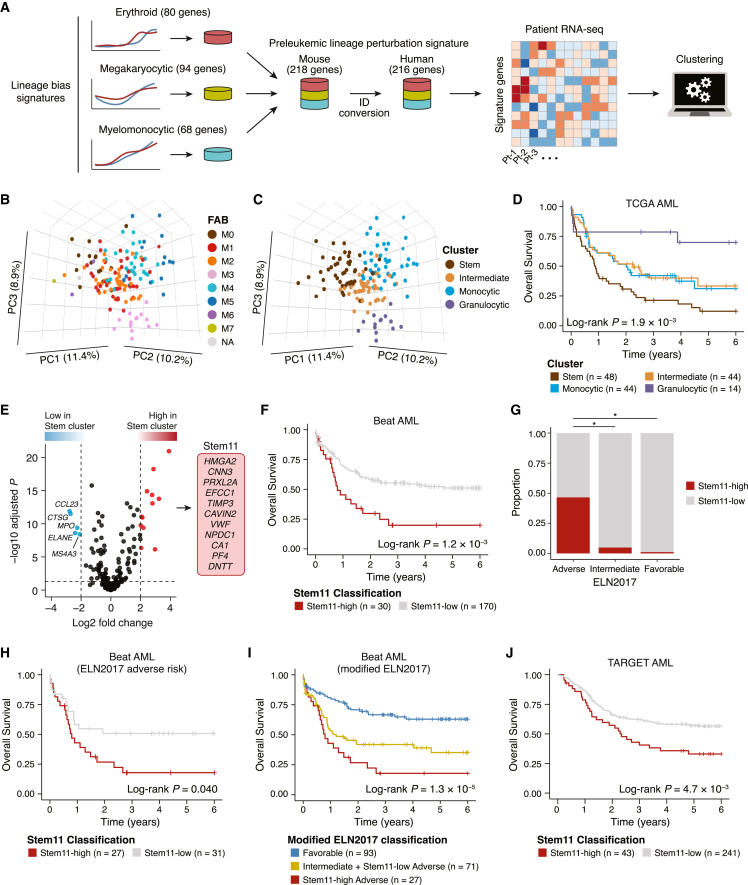
Acute myeloid leukemia (AML) and myeloid neoplasms develop through acquisition of somatic mutations that confer mutation-specific fitness advantages to hematopoietic stem and progenitor cells. However, our understanding of mutational effects remains limited to the resolution attainable within immunophenotypically and clinically accessible bulk cell populations. To decipher heterogeneous cellular fitness to preleukemic mutational perturbations, we performed single-cell RNA sequencing of eight different mouse models with driver mutations of myeloid malignancies, generating 269,048 single-cell profiles. Our analysis infers mutation-driven perturbations in cell abundance, cellular lineage fate, cellular metabolism, and gene expression at the continuous resolution, pinpointing cell populations with transcriptional alterations associated with differentiation bias. We further develop an 11-gene scoring system (Stem11) on the basis of preleukemic transcriptional signatures that predicts AML patient outcomes. Our results demonstrate that a single-cell-resolution deep characterization of preleukemic biology has the potential to enhance our understanding of AML heterogeneity and inform more effective risk stratification strategies.

Keywords: acute myeloid leukemia; hematopoiesis; myeloid malignancies; preleukemia; single-cell RNA-seq.


Conflict of interest statement

Aspects of this work are included in United Kingdom patent application 2312684.0.

Figures

None
Graphical abstract
Figure 1
Figure 1
Standardized visualization across multiple mutant landscapes using reference-based data integration (A) Schematic overview of the analysis workflow in this study. Data integration: scRNA-seq data of individual animals are first projected onto the reference mouse hematopoietic atlas and all visual representations of the results are shown in the common UMAP space. Downstream analysis: the downstream analysis modules then infer differential abundance, cellular fate probability, cellular metabolic activity and gene expression changes. All results are shown in the common UMAP space to permit comparison among genotypes. (B) UMAP plot of the reference mouse hematopoietic atlas (44,802 cells). HSC, hematopoietic stem cell; prog, progenitors; Mono, monocyte; DC, dendritic cell; MEP, megakaryocyte-erythroid progenitors; MK, megakaryocyte; Ery, erythroid. (C) Integrated preleukemic mouse hematopoietic atlas (38 animals, 269,048 cells). Cells are color coded according to cell types as in (B). WT, wild type; KO, knockout.
Figure 2
Figure 2
Depicting tissue-scale subpopulation abundance at single-cell resolution (A) Differential abundance landscapes of eight preleukemic mutant models. Higher likelihood (red) corresponds to higher abundance and lower likelihood (blue) to lower abundance in each mutant model compared with paired wild-type samples. All results are presented in the same color scale ranging from 0.2 to 0.8 for comparability. Cell types with a median mutant relative likelihood of >0.6 or <0.4 are indicated. (B) Statistically significant differential abundance (DA) in the Flt3 ITD model. p values were derived using a two-sided t test. Cells with raw p values < 0.05 and BH-adjusted p values < 0.25 are colored red (abundant) or blue (depleted in the Flt3 ITD model). (C) A magnified section of the HSC cluster region. The boundary of the HSC cluster is outlined with dashed lines. (D) Top: the HSC score in the Flt3 ITD and wild-type HSCs. Bottom: significant difference in the HSC score between Flt3 ITD-depleted (mutant relative likelihood < 0.4) and increased (mutant relative likelihood > 0.6) HSCs. Boxplots show median and first/third quartiles. The whisker extends from the smallest to the largest values within 1.5 × IQR from the box hinges. The p value is from a two-sided Wilcoxon rank-sum test. (E) Stacked bar plots showing the cell type proportions in the Flt3 ITD and wild-type animals. Cell types are color coded as in Figure 1B. Statistical significance was determined with two-sided t test. (F) A magnified section of the neutrophil progenitor cluster region. The boundary between significantly expanded neutrophil progenitors (red) and depleted later neutrophil progenitors (blue) is indicated by a dashed line.
Figure 3
Figure 3
Mutation-driven fate bias in early HSPCs (A) Workflow of CellRank-based differential fate probability analysis. A neighborhood graph and diffusion pseudotime were computed (top left) and used to infer cell-to-cell transition probabilities (top middle). On the basis of the transition matrix, the fate probabilities toward seven hematopoietic lineages (megakaryocyte, erythroid, lymphoid, neutrophil, monocyte, basophil, and mast cell) were estimated for the individual cells (top right). The single-cell estimates of fate probabilities were then compared between the paired mutant and wild-type samples (bottom). Ery, erythroid; Lym, lymphoid; Baso, basophil; Neu, neutrophil; Mo, monocyte; MK, megakaryocyte. (B) Significant difference in the megakaryocyte probability between Calr mutant and wild-type HSCs. (C) Significant differences in the erythroid probability between Jak2 mutant and wild-type MEPs (left) and HSCs (right). (D) Significant differences in the monocyte (left) and neutrophil (right) probability between Npm1 mutant and wild-type HSCs. Boxplots show median and first/third quartiles. The whisker extends from the smallest to the largest values within 1.5 × IQR from the box hinges. p values are from logistic regression and likelihood ratio test and are BH adjusted.
Figure 4
Figure 4
Transcriptome-based metabolic profiling reveals distinct metabolic consequences of different mutations (A) Workflow of neural-network-based metabolic profiling. Using the expression levels of enzyme genes as input, a deep neural network model was optimized to estimate the activities of 168 metabolic reactions in the individual cells. The cellular metabolic estimates were then used for statistical comparisons. (B–E) Volcano plots comparing glycolysis and TCA cycle activities in the mouse models of group 1 mutations (Jak2 and Calr) (B), group 2 mutations (Idh1, Npm1, Ezh2, and Utx) (C), Dnmt3a mutation (D), and Flt3 ITD (E). The x and y axes represent Cohen’s D standardized difference of means and −log10 adjusted p values, respectively. Each dot represents each metabolic reaction module and is colored according to the functional pathways. The horizontal dotted line indicates the adjusted p value of 0.05; the vertical dotted lines indicate the Cohen’s D values of −0.15 and 0.15.
Figure 5
Figure 5
Perturbed regulation of gene expression in preleukemic mutant models (A) The number of genes differentially expressed in each cell type from each mutant model compared with the wild-type counterpart. The numbers are shown over the corresponding cell types in the individual UMAP plots. HSC, hematopoietic stem cell; prog, progenitors; Mono, monocyte; DC, dendritic cell; MEP, megakaryocyte-erythroid progenitors; MK, megakaryocyte; Ery, erythroid. (B) Significant upregulation of cell cycle regulators in Jak2 mutant early erythroid progenitors. Gene Ontology (GO) terms for biological processes (BPs) were evaluated. NES, normalized enrichment score; FDR, false discovery rate. (C) Significant downregulation of genes regulating megakaryocytic differentiation in Jak2 mutant MEPs. (D) Differential expression dynamics of Pf4 between the erythroid trajectory of the Jak2 mutant and the paired wild-type samples. The upper panel shows the pseudotime distribution of each cell type, defining the pseudotime ranges of dominant cell types. The lower panel shows the pseudotemporal expression patterns of Pf4. The red (Jak2 V617F) and blue (wild-type) lines show the expression smoothers estimated by a negative binomial generalized additive model. Each dot shows the log-normalized expression and the pseudotime of each cell. (E–G) Significantly altered gene expression patterns in the Jak2 mutant and wild-type erythroid trajectory (E), the Calr mutant and wild-type megakaryocyte trajectory (F), and the Flt3 mutant and wild-type myelomonocytic trajectory (G). The pseudotime ranges of dominant cell types are indicated with colored bars.
Figure 6
Figure 6
Prognostic relevance of preleukemic lineage perturbation signature genes (A) Overview of the analysis of patient RNA-seq data. The erythroid, megakaryocytic, and myelomonocytic bias signatures derived from the pseudotemporal differential expression analysis were combined to develop the PLPS (preleukemic lineage perturbation signature) genes, which were then used to cluster the patient data. (B and C) Principal-component analysis of the TCGA cohort. Samples are colored according to the FAB classification (B) and the patient clusters (C). PC1, PC2, and PC3 represent the first three principal components, with the percentage of variance explained indicated on the axes. (D) Survival analysis comparing the overall survival of the different clusters of TCGA AML cohort. (E) Volcano plot showing the differential expression of PLPS genes. Genes with significant upregulation (BH-adjusted p < 0.05 and log2 fold change > 2; red) and downregulation (BH-adjusted p < 0.05 and log2 fold change < −2; blue) are color coded. (F) Survival analysis comparing the Stem11-high and Stem11-low groups in the Beat AML cohort. (G) Proportions of Stem11-high patients in each of the ELN2017 risk groups. p values are from Fisher’s exact test. ∗p < 1.0 × 10−5. (H) Survival analysis comparing the Stem11-high and Stem11-low patients among the ELN2017 adverse risk group in the Beat AML cohort. (I) Survival analysis comparing our modified ELN2017 risk groups, where the Stem11-low, ELN2017 adverse-risk patients were re-stratified to the intermediate risk group. (J) Survival analysis comparing the Stem11-high and Stem11-low groups in the TARGET AML cohort.

References

    1. Cancer Genome Atlas Research Network Genomic and Epigenomic Landscapes of Adult De Novo Acute Myeloid Leukemia. N. Engl. J. Med. 2013;368:2059–2074. doi: 10.1056/nejmoa1301689. - DOI - PMC - PubMed
    1. Tyner J.W., Tognon C.E., Bottomly D., Wilmot B., Kurtz S.E., Savage S.L., Long N., Schultz A.R., Traer E., Abel M., et al. Functional Genomic Landscape of Acute Myeloid Leukemia. Nature. 2018;562:526–531. doi: 10.1038/s41586-018-0623-z. - DOI - PMC - PubMed
    1. Granfeldt Østgård L.S., Medeiros B.C., Sengeløv H., Nørgaard M., Andersen M.K., Dufva I.H., Friis L.S., Kjeldsen E., Marcher C.W., Preiss B., et al. Epidemiology and Clinical Significance of Secondary and Therapy-Related Acute Myeloid Leukemia: A National Population-Based Cohort Study. J. Clin. Oncol. 2015;33:3641–3649. doi: 10.1200/jco.2014.60.0890. - DOI - PubMed
    1. Dunbar A.J., Rampal R.K., Levine R. Leukemia secondary to myeloproliferative neoplasms. Blood. 2020;136:61–70. doi: 10.1182/blood.2019000943. - DOI - PMC - PubMed
    1. Chen J., Kao Y.-R., Sun D., Todorova T.I., Reynolds D., Narayanagari S.-R., Montagna C., Will B., Verma A., Steidl U. Myelodysplastic Syndrome Progression to Acute Myeloid Leukemia at the Stem Cell Level. Nat. Med. 2019;25:103–110. doi: 10.1038/s41591-018-0267-4. - DOI - PMC - PubMed

Publication types