

Cell-Free DNA Maps Tissue Injury and Correlates with Disease Severity in Lung Transplant Candidates
- PMID: 38117233
- PMCID: PMC10945061
- DOI: 10.1164/rccm.202306-1064OC
Cell-Free DNA Maps Tissue Injury and Correlates with Disease Severity in Lung Transplant Candidates
Abstract
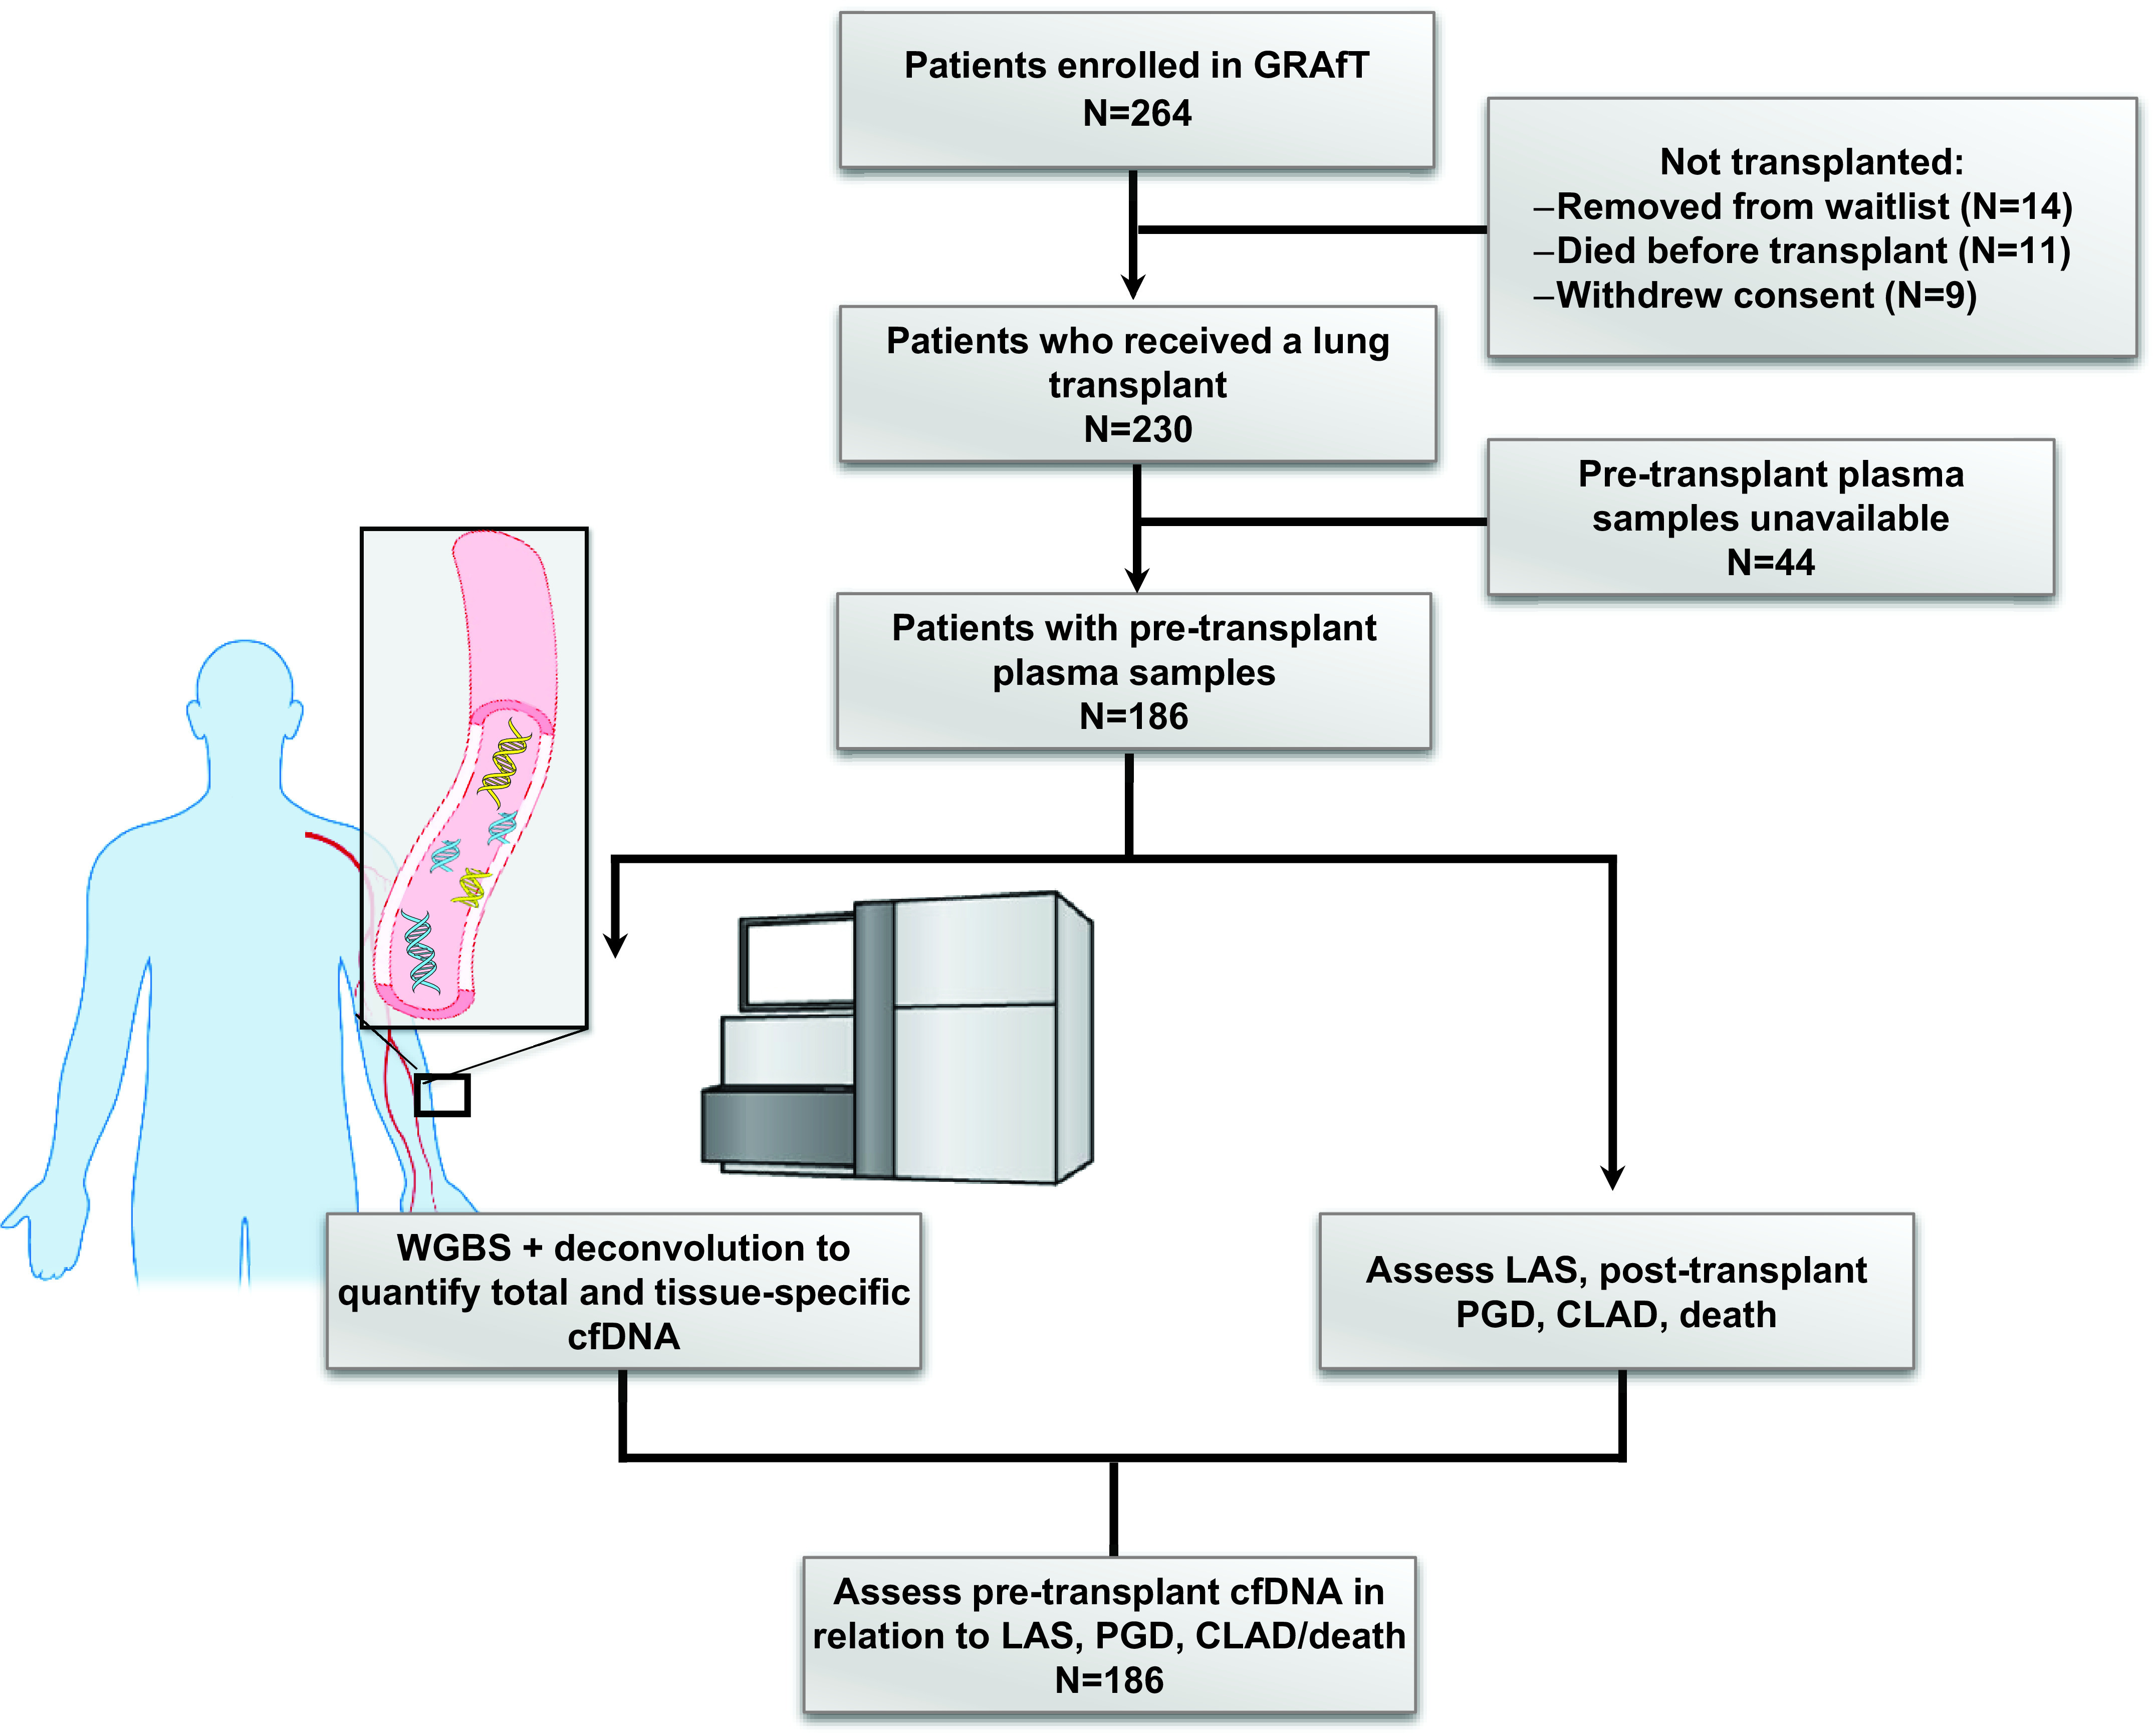
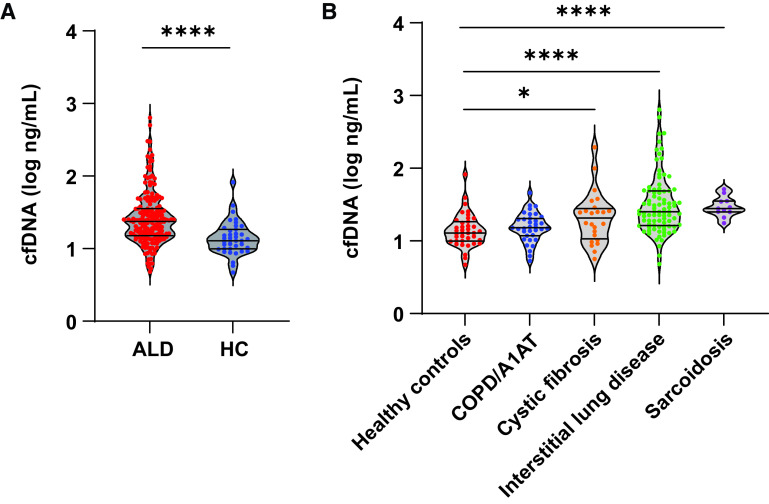
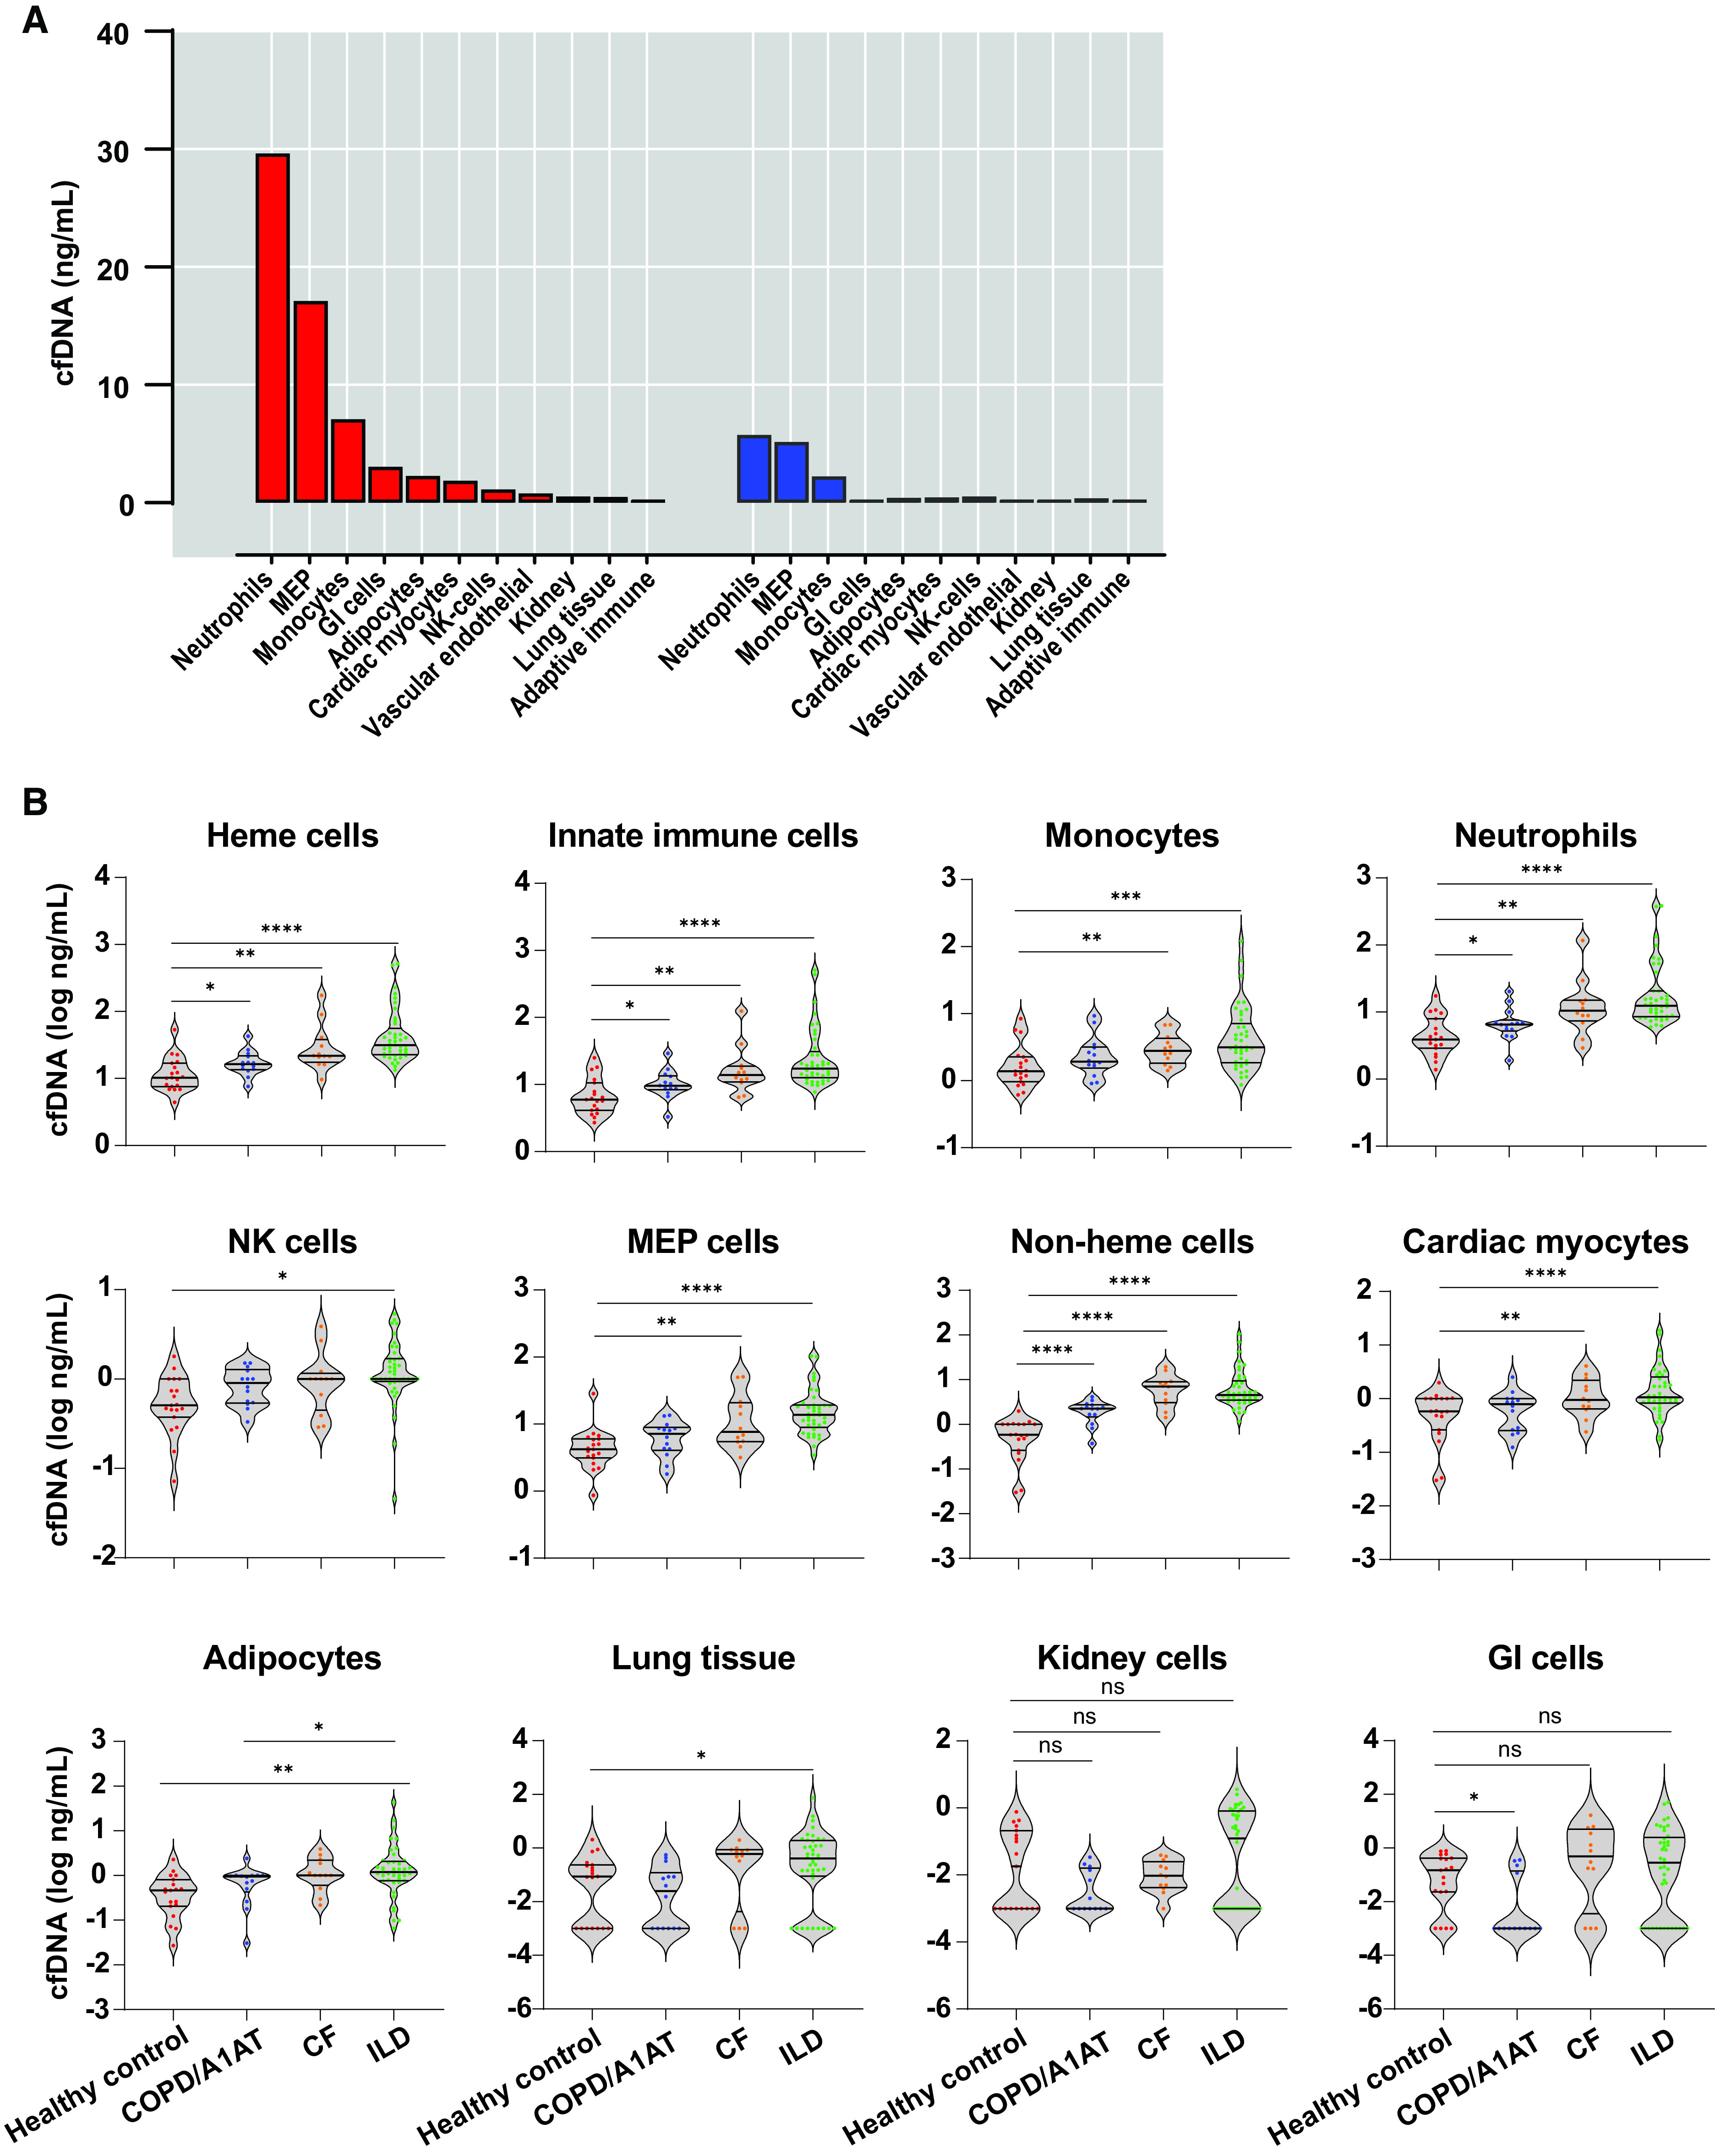
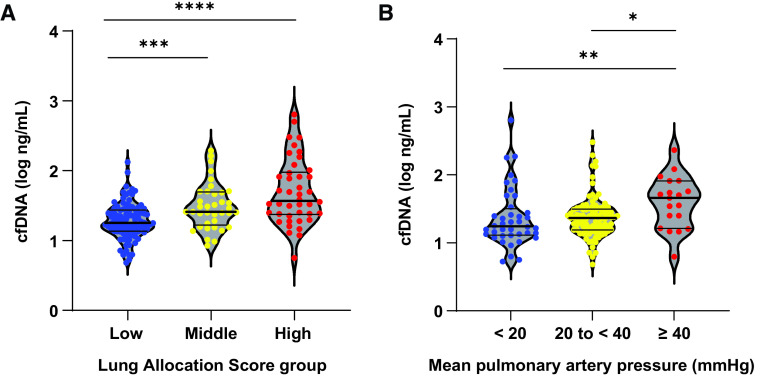
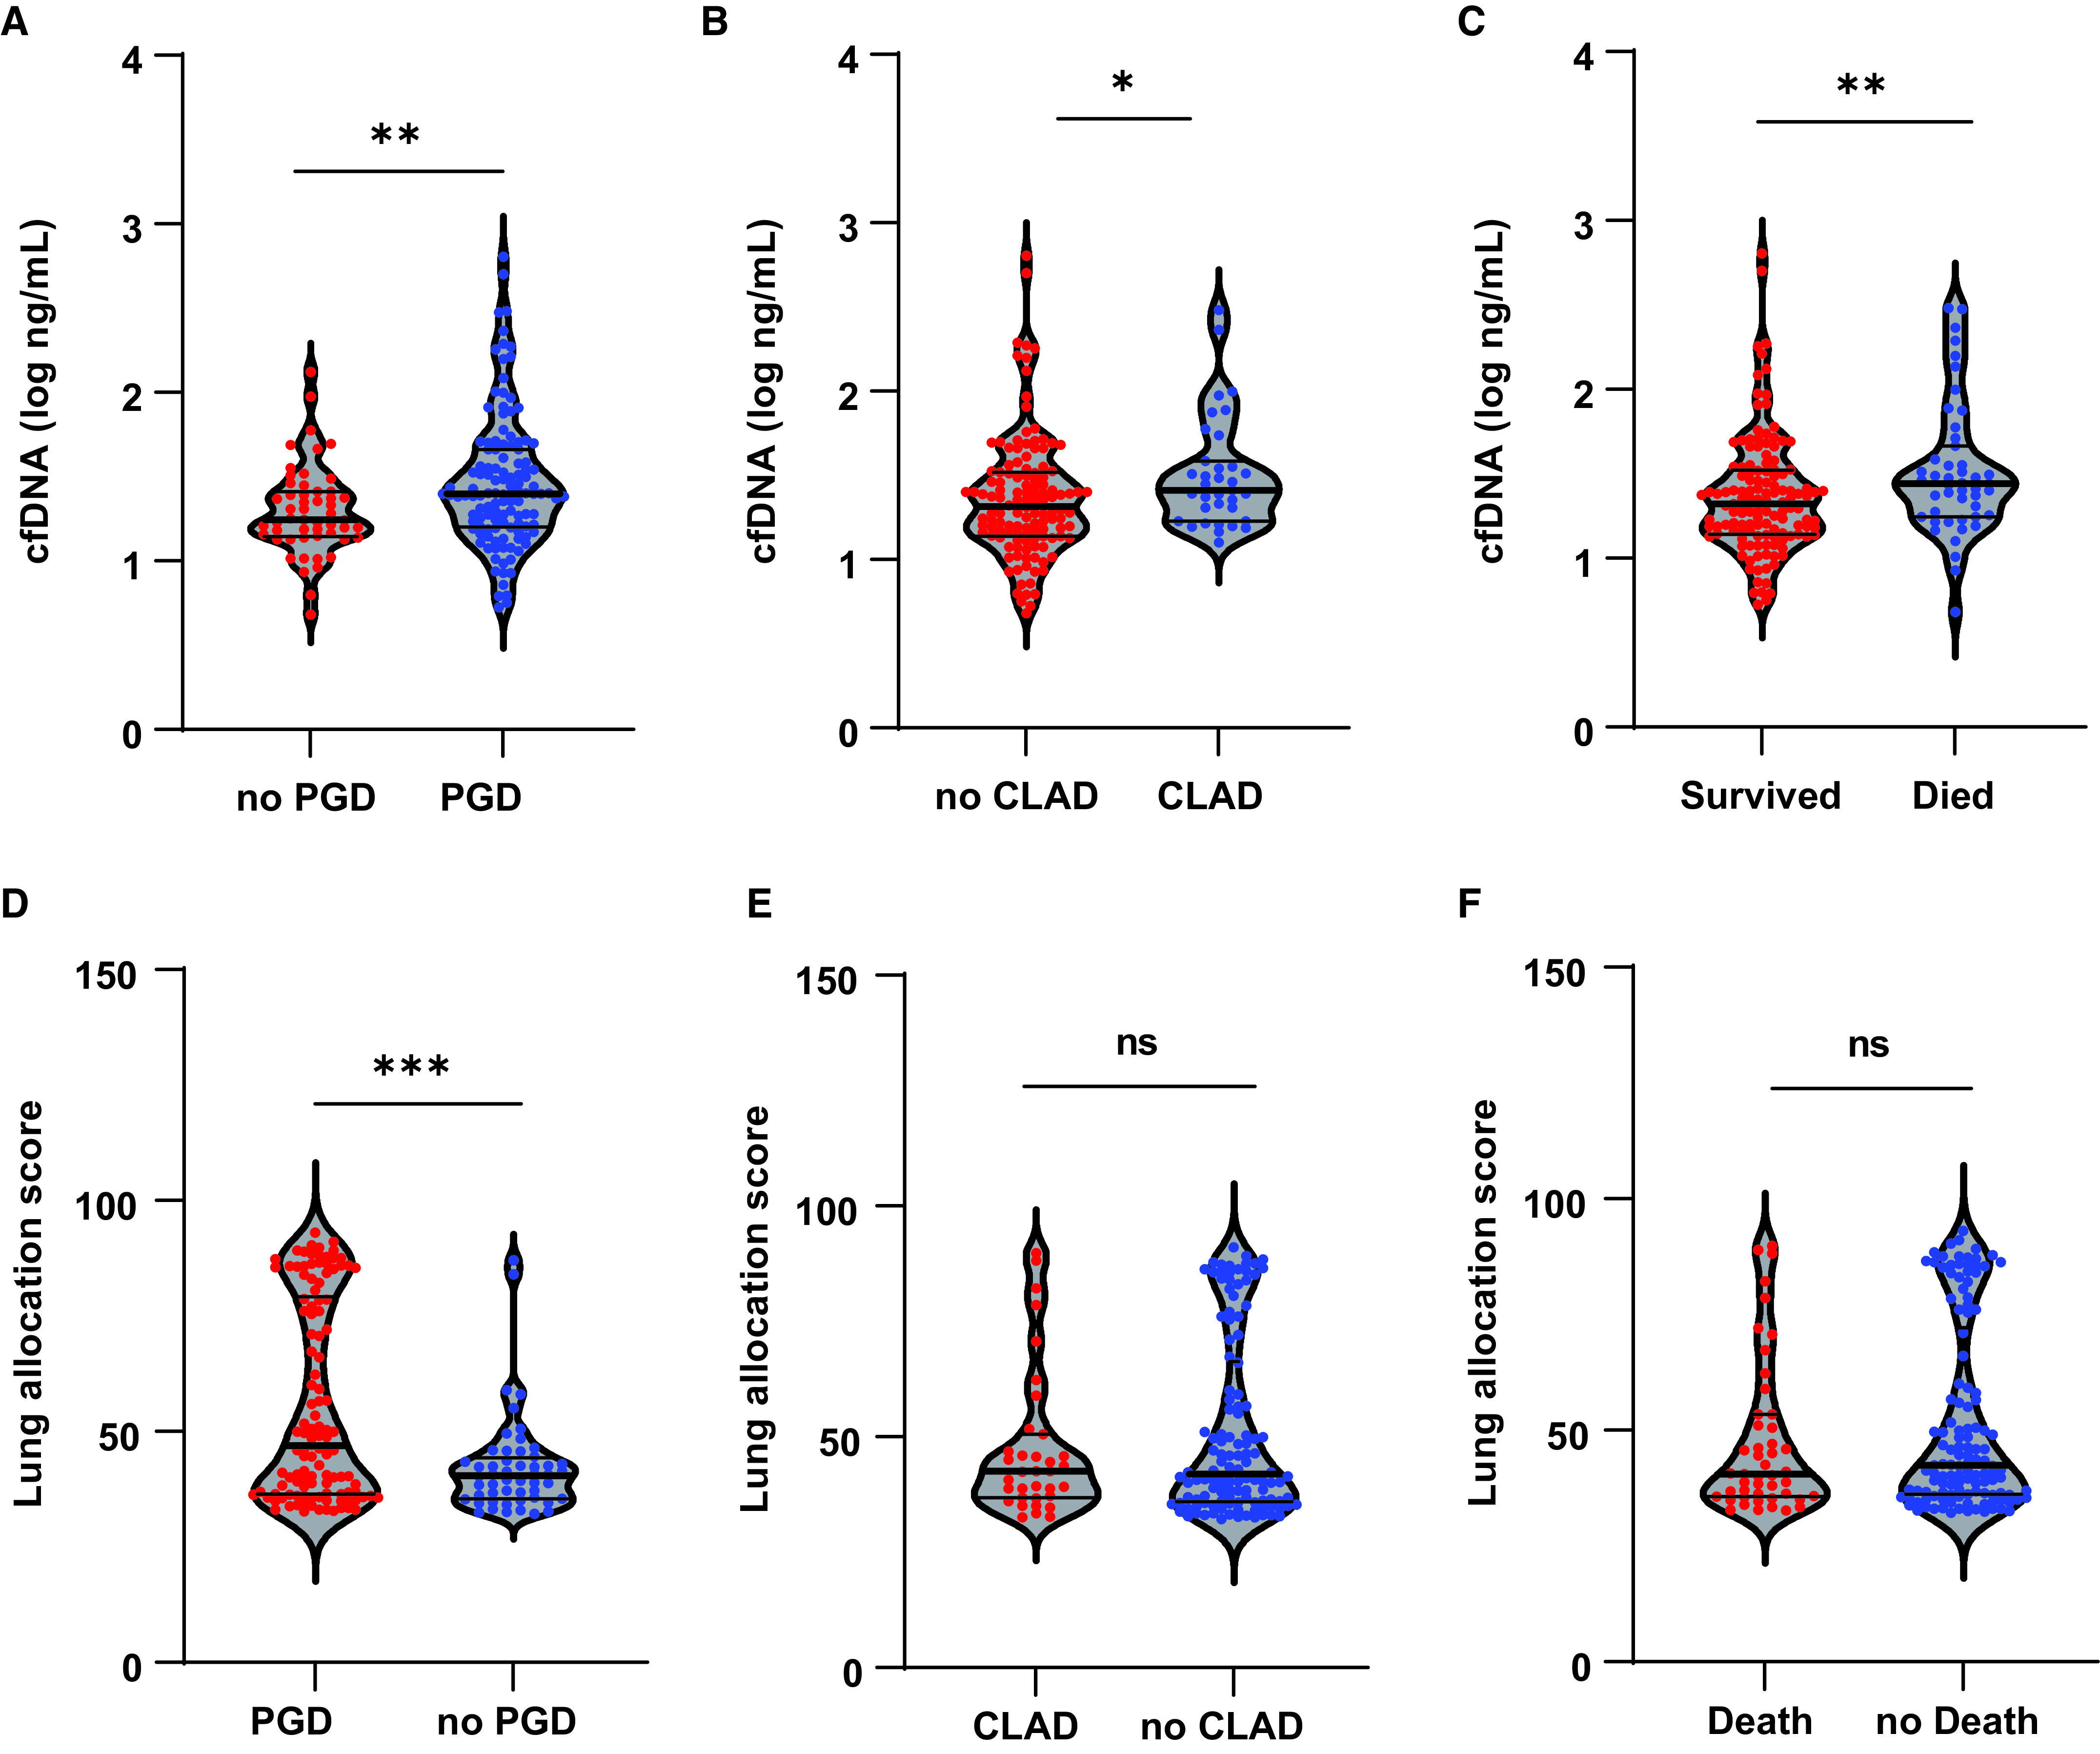
Rationale: Plasma cell-free DNA levels correlate with disease severity in many conditions. Pretransplant cell-free DNA may risk stratify lung transplant candidates for post-transplant complications. Objectives: To evaluate if pretransplant cell-free DNA levels and tissue sources identify patients at high risk of primary graft dysfunction and other pre- and post-transplant outcomes. Methods: This multicenter, prospective cohort study recruited 186 lung transplant candidates. Pretransplant plasma samples were collected to measure cell-free DNA. Bisulfite sequencing was performed to identify the tissue sources of cell-free DNA. Multivariable regression models determined the association between cell-free DNA levels and the primary outcome of primary graft dysfunction and other transplant outcomes, including Lung Allocation Score, chronic lung allograft dysfunction, and death. Measurements and Main Results: Transplant candidates had twofold greater cell-free DNA levels than healthy control patients (median [interquartile range], 23.7 ng/ml [15.1-35.6] vs. 12.9 ng/ml [9.9-18.4]; P < 0.0001), primarily originating from inflammatory innate immune cells. Cell-free DNA levels and tissue sources differed by native lung disease category and correlated with the Lung Allocation Score (P < 0.001). High pretransplant cell-free DNA increased the risk of primary graft dysfunction (odds ratio, 1.60; 95% confidence interval [CI], 1.09-2.46; P = 0.0220), and death (hazard ratio, 1.43; 95% CI, 1.07-1.92; P = 0.0171) but not chronic lung allograft dysfunction (hazard ratio, 1.37; 95% CI, 0.97-1.94; P = 0.0767). Conclusions: Lung transplant candidates demonstrate a heightened degree of tissue injury with elevated cell-free DNA, primarily originating from innate immune cells. Pretransplant plasma cell-free DNA levels predict post-transplant complications.
Keywords: cell-free DNA; chronic lung allograft dysfunction; lung transplantation; primary graft dysfunction; transplantation.
Figures
Comment in
-
A Hospitable Home? Cell-Free DNA and the Inflammatory Milieu in Lung Transplant Candidates.Am J Respir Crit Care Med. 2024 Mar 15;209(6):627-628. doi: 10.1164/rccm.202312-2242ED. Am J Respir Crit Care Med. 2024. PMID: 38226872 Free PMC article. No abstract available.
Similar articles
-
Clinical Outcomes of Lung Transplantation in the Presence of Donor-Specific Antibodies.Ann Am Thorac Soc. 2019 Sep;16(9):1131-1137. doi: 10.1513/AnnalsATS.201812-869OC. Ann Am Thorac Soc. 2019. PMID: 31026404 Free PMC article.
-
Obesity and primary graft dysfunction after lung transplantation: the Lung Transplant Outcomes Group Obesity Study.Am J Respir Crit Care Med. 2011 Nov 1;184(9):1055-61. doi: 10.1164/rccm.201104-0728OC. Am J Respir Crit Care Med. 2011. PMID: 21799077 Free PMC article.
-
Diastolic Dysfunction Increases the Risk of Primary Graft Dysfunction after Lung Transplant.Am J Respir Crit Care Med. 2016 Jun 15;193(12):1392-400. doi: 10.1164/rccm.201508-1522OC. Am J Respir Crit Care Med. 2016. PMID: 26745666 Free PMC article.
-
Donor-derived cell-free DNA predicts allograft failure and mortality after lung transplantation.EBioMedicine. 2019 Feb;40:541-553. doi: 10.1016/j.ebiom.2018.12.029. Epub 2019 Jan 26. EBioMedicine. 2019. PMID: 30692045 Free PMC article.
-
Bronchial Culture Growth From the Donor and Recipient as Predictive Factors in the Detection of Primary Graft Dysfunction and Pneumonia After Lung Transplant.Exp Clin Transplant. 2022 Oct;20(10):930-936. doi: 10.6002/ect.2021.0496. Epub 2022 May 23. Exp Clin Transplant. 2022. PMID: 35607803
Cited by
-
Circulating, cell-free methylated DNA indicates cellular sources of allograft injury after liver transplant.bioRxiv [Preprint]. 2024 Apr 5:2024.04.04.588176. doi: 10.1101/2024.04.04.588176. bioRxiv. 2024. Update in: Nat Commun. 2025 Jun 17;16(1):5310. doi: 10.1038/s41467-025-60507-9. PMID: 38617373 Free PMC article. Updated. Preprint.
-
Regulated cell death and DAMPs as biomarkers and therapeutic targets in normothermic perfusion of transplant organs. Part 2: implementation strategies.Front Transplant. 2025 Apr 24;4:1575703. doi: 10.3389/frtra.2025.1575703. eCollection 2025. Front Transplant. 2025. PMID: 40343200 Free PMC article. Review.
-
A Hospitable Home? Cell-Free DNA and the Inflammatory Milieu in Lung Transplant Candidates.Am J Respir Crit Care Med. 2024 Mar 15;209(6):627-628. doi: 10.1164/rccm.202312-2242ED. Am J Respir Crit Care Med. 2024. PMID: 38226872 Free PMC article. No abstract available.
-
Circulating cell-free DNA methylation patterns indicate cellular sources of allograft injury after liver transplant.Nat Commun. 2025 Jun 17;16(1):5310. doi: 10.1038/s41467-025-60507-9. Nat Commun. 2025. PMID: 40527875 Free PMC article.
-
Biomarkers for primary graft dysfunction after lung transplantation: a review of current evidence and future prospects.Front Physiol. 2025 May 22;16:1557182. doi: 10.3389/fphys.2025.1557182. eCollection 2025. Front Physiol. 2025. PMID: 40476215 Free PMC article. Review.
References
-
- Egan TM, Murray S, Bustami RT, Shearon TH, McCullough KP, Edwards LB, et al. Development of the new lung allocation system in the United States. Am J Transplant . 2006;6:1212–1227. - PubMed
-
- Organ Procurement and Transplantation Network. https://optn.transplant.hrsa.gov/media/jhcppfnd/guide_to_calculating_lu...
Publication types
MeSH terms
Substances
Grants and funding
LinkOut - more resources
Full Text Sources
Medical
