. 2024 Apr;70(4):259-282.
doi: 10.1165/rcmb.2023-0232OC.

The Regulation of Fatty Acid Synthase by Exosomal miR-143-5p and miR-342-5p in Idiopathic Pulmonary Fibrosis

Affiliations

The Regulation of Fatty Acid Synthase by Exosomal miR-143-5p and miR-342-5p in Idiopathic Pulmonary Fibrosis

Hassan Hayek et al. Am J Respir Cell Mol Biol. 2024 Apr.

Abstract

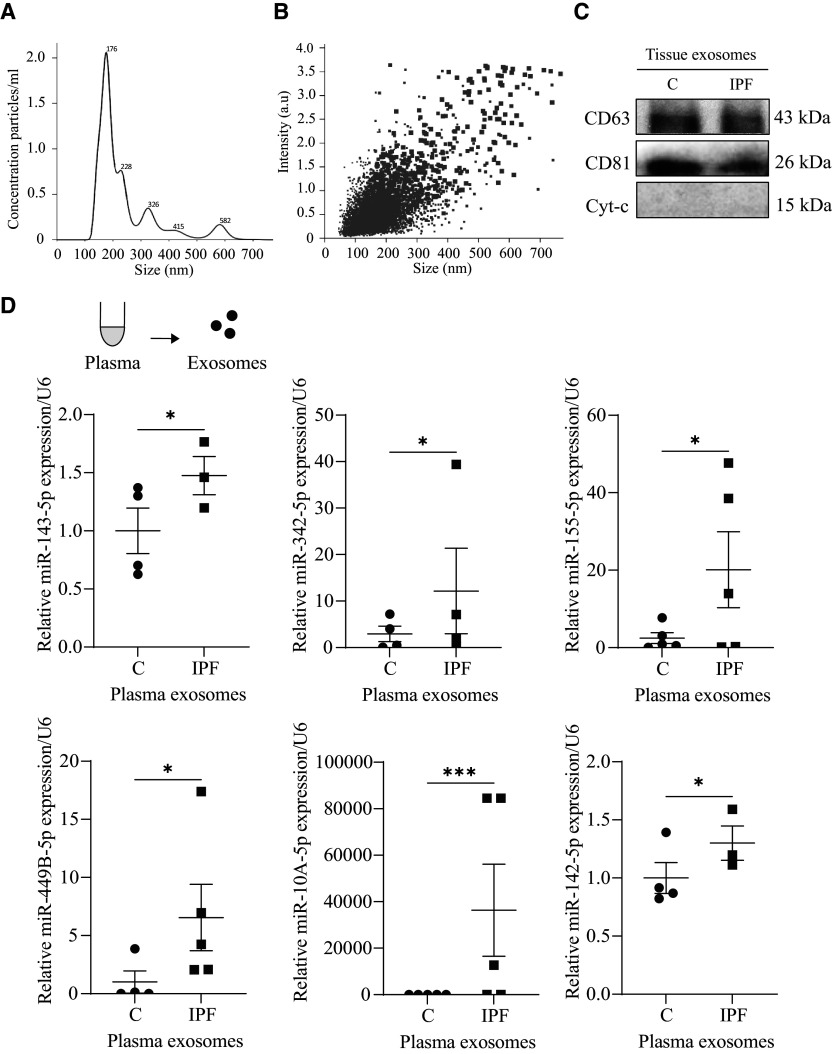
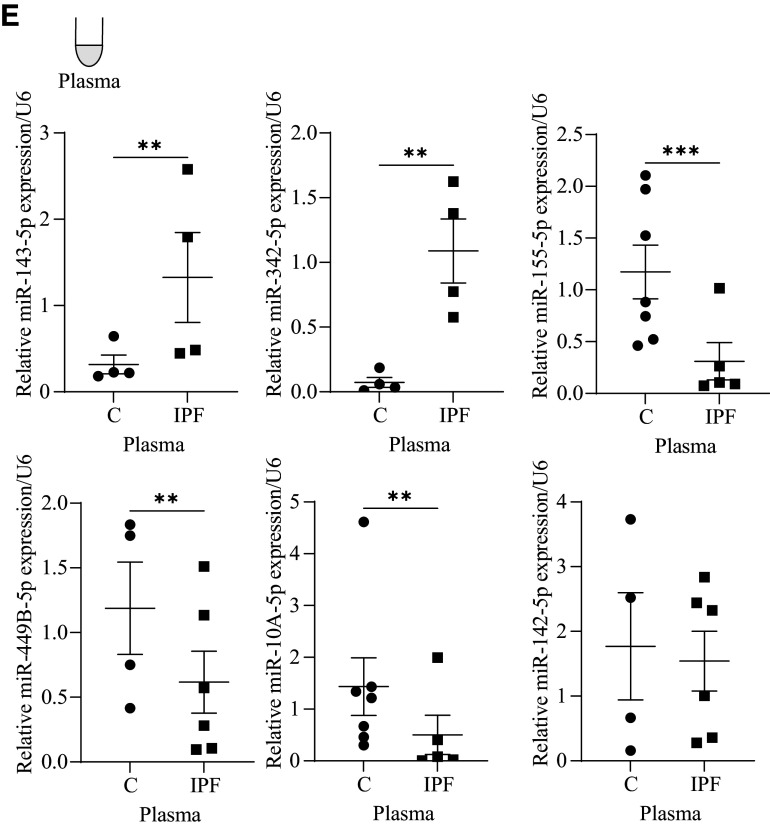
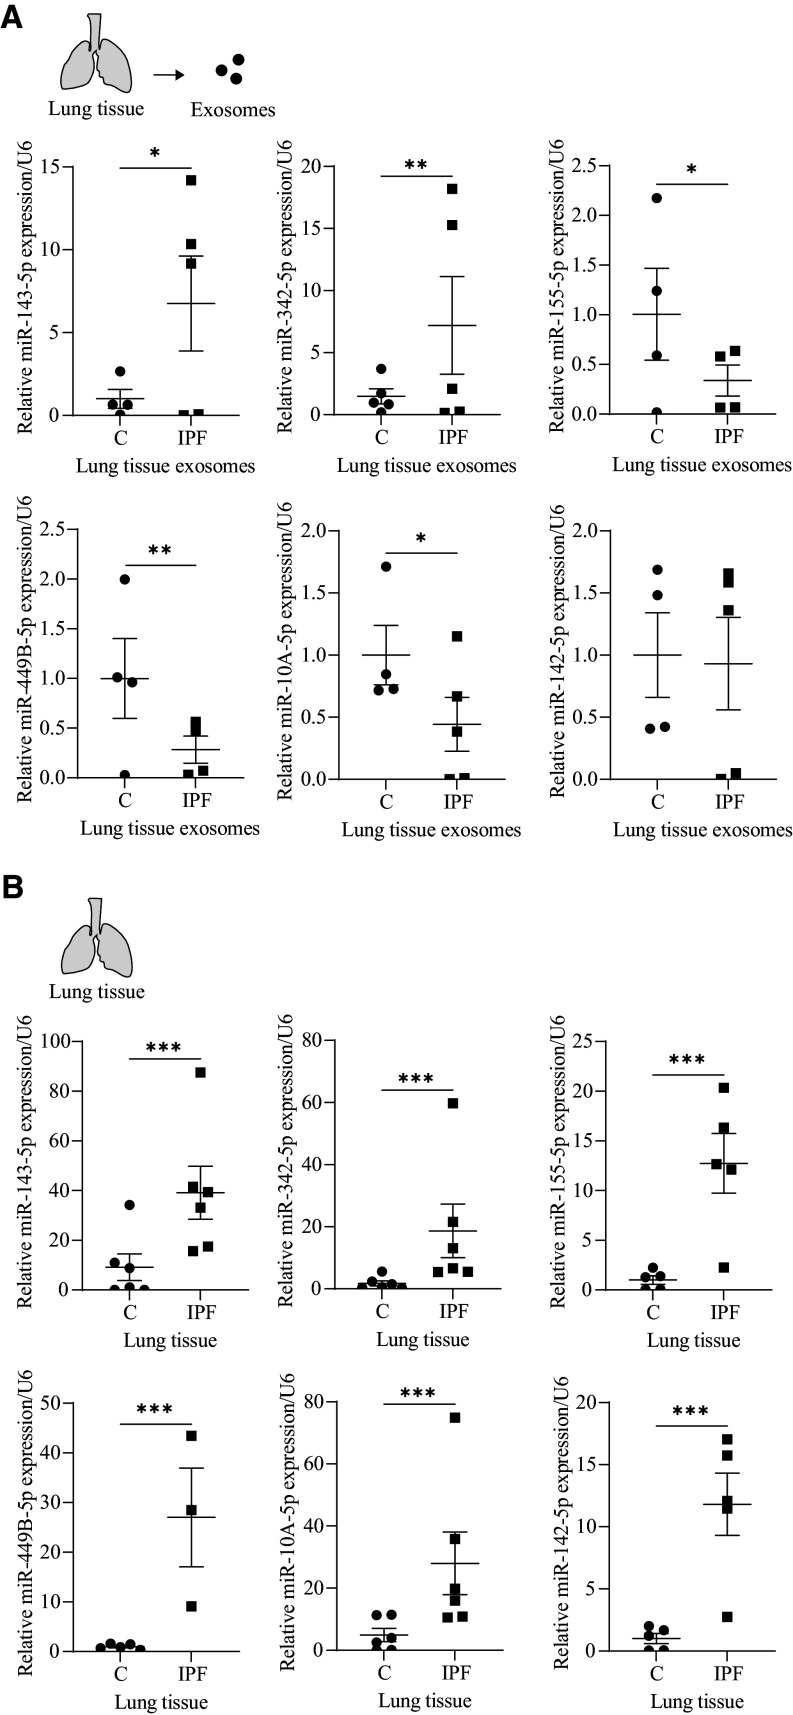
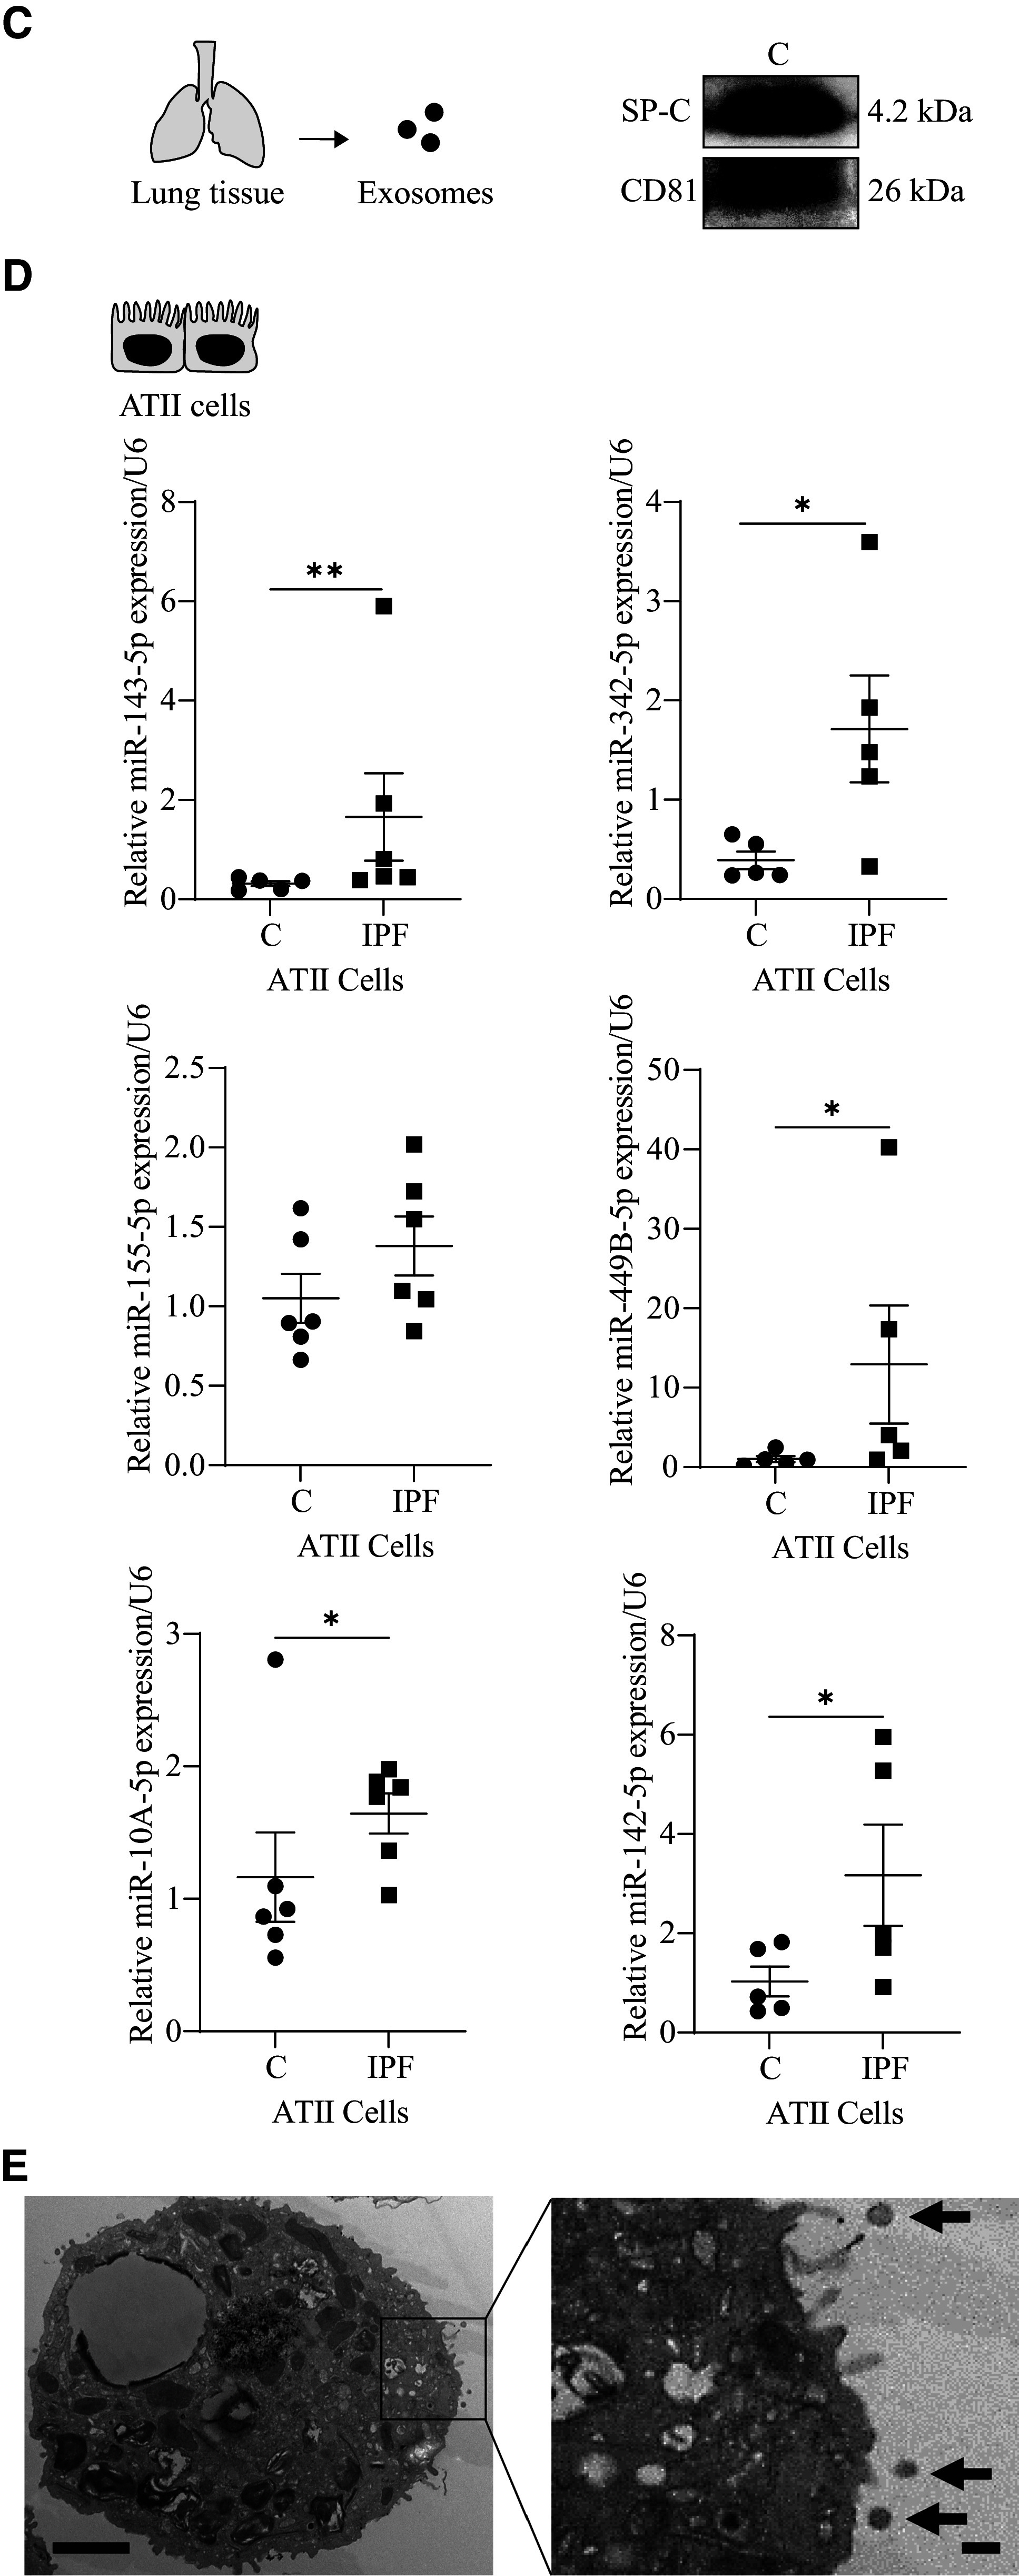
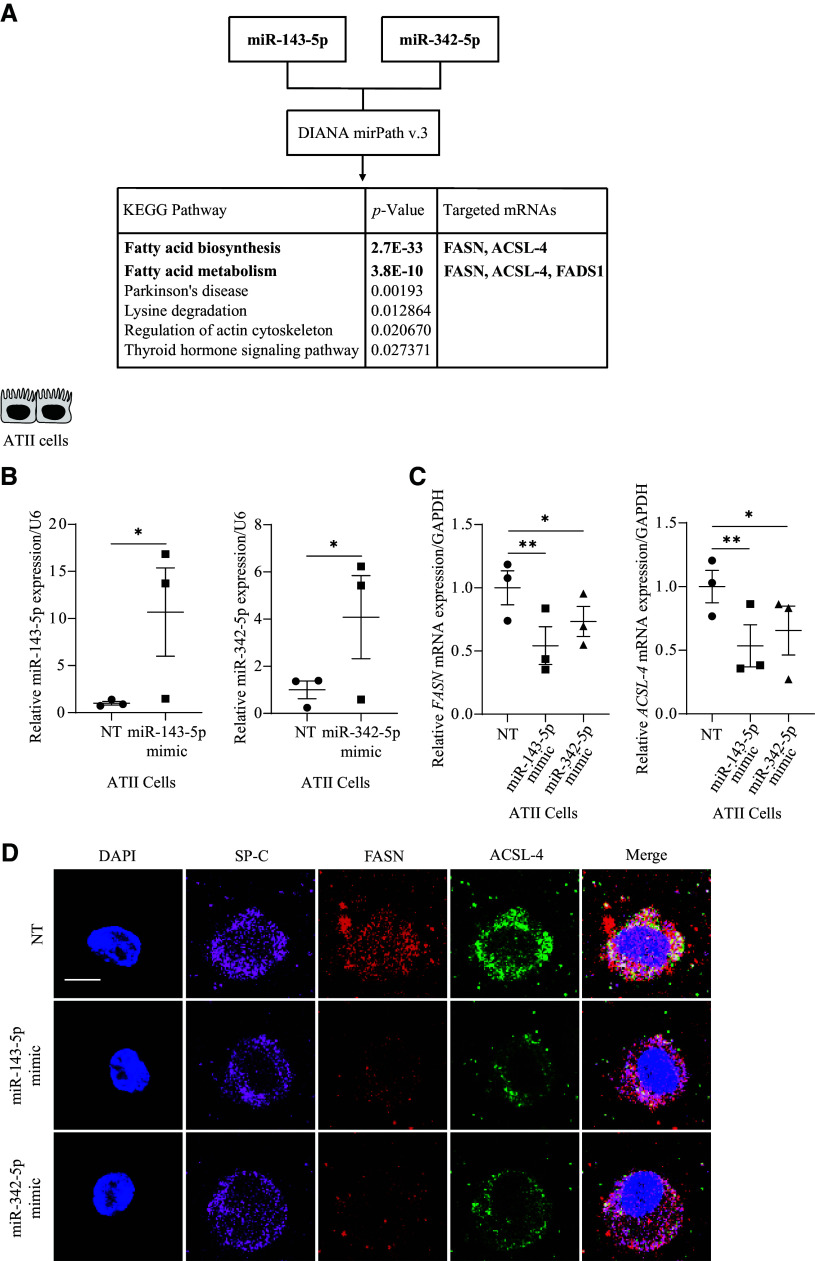
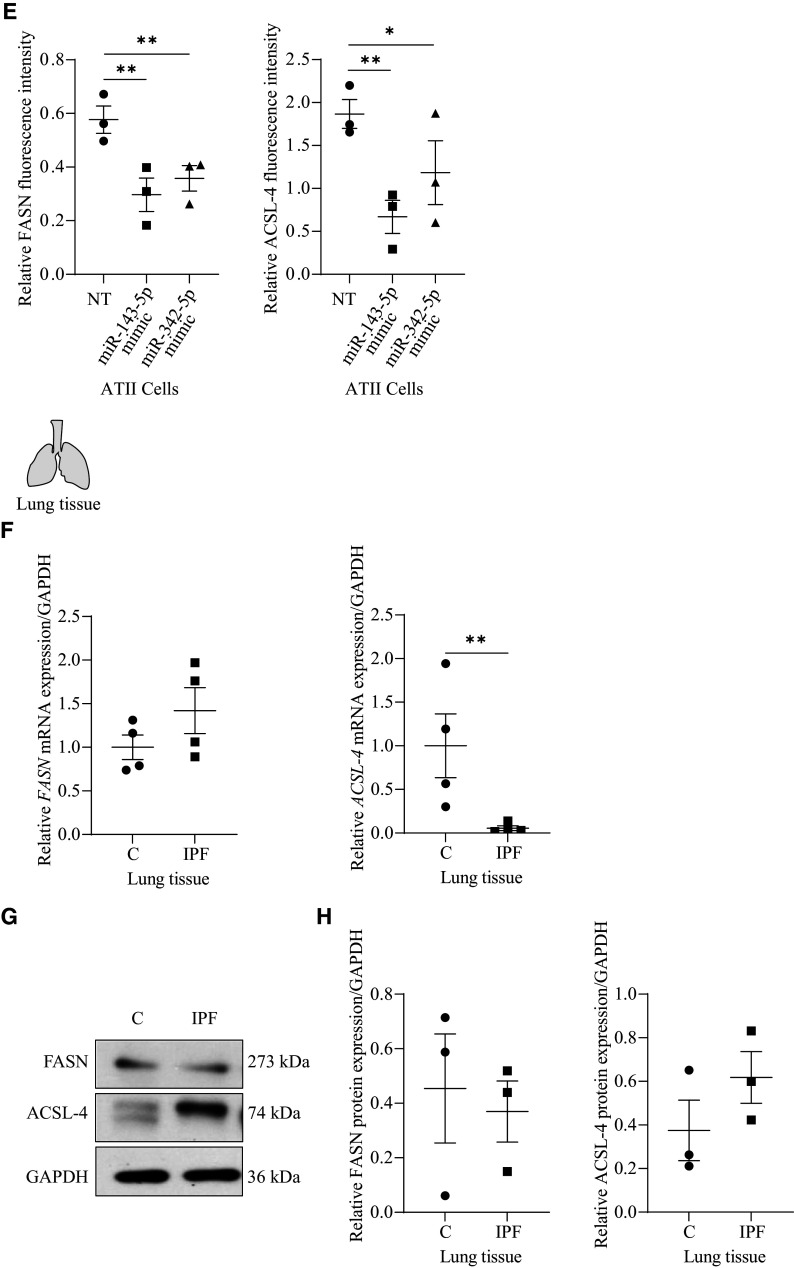
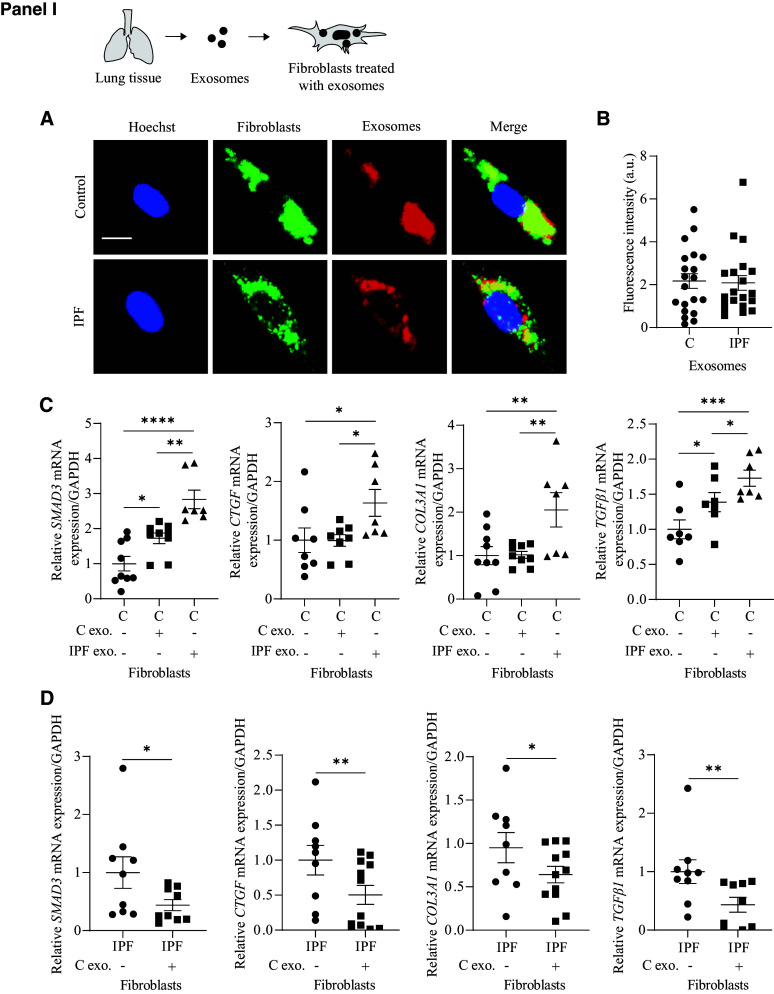
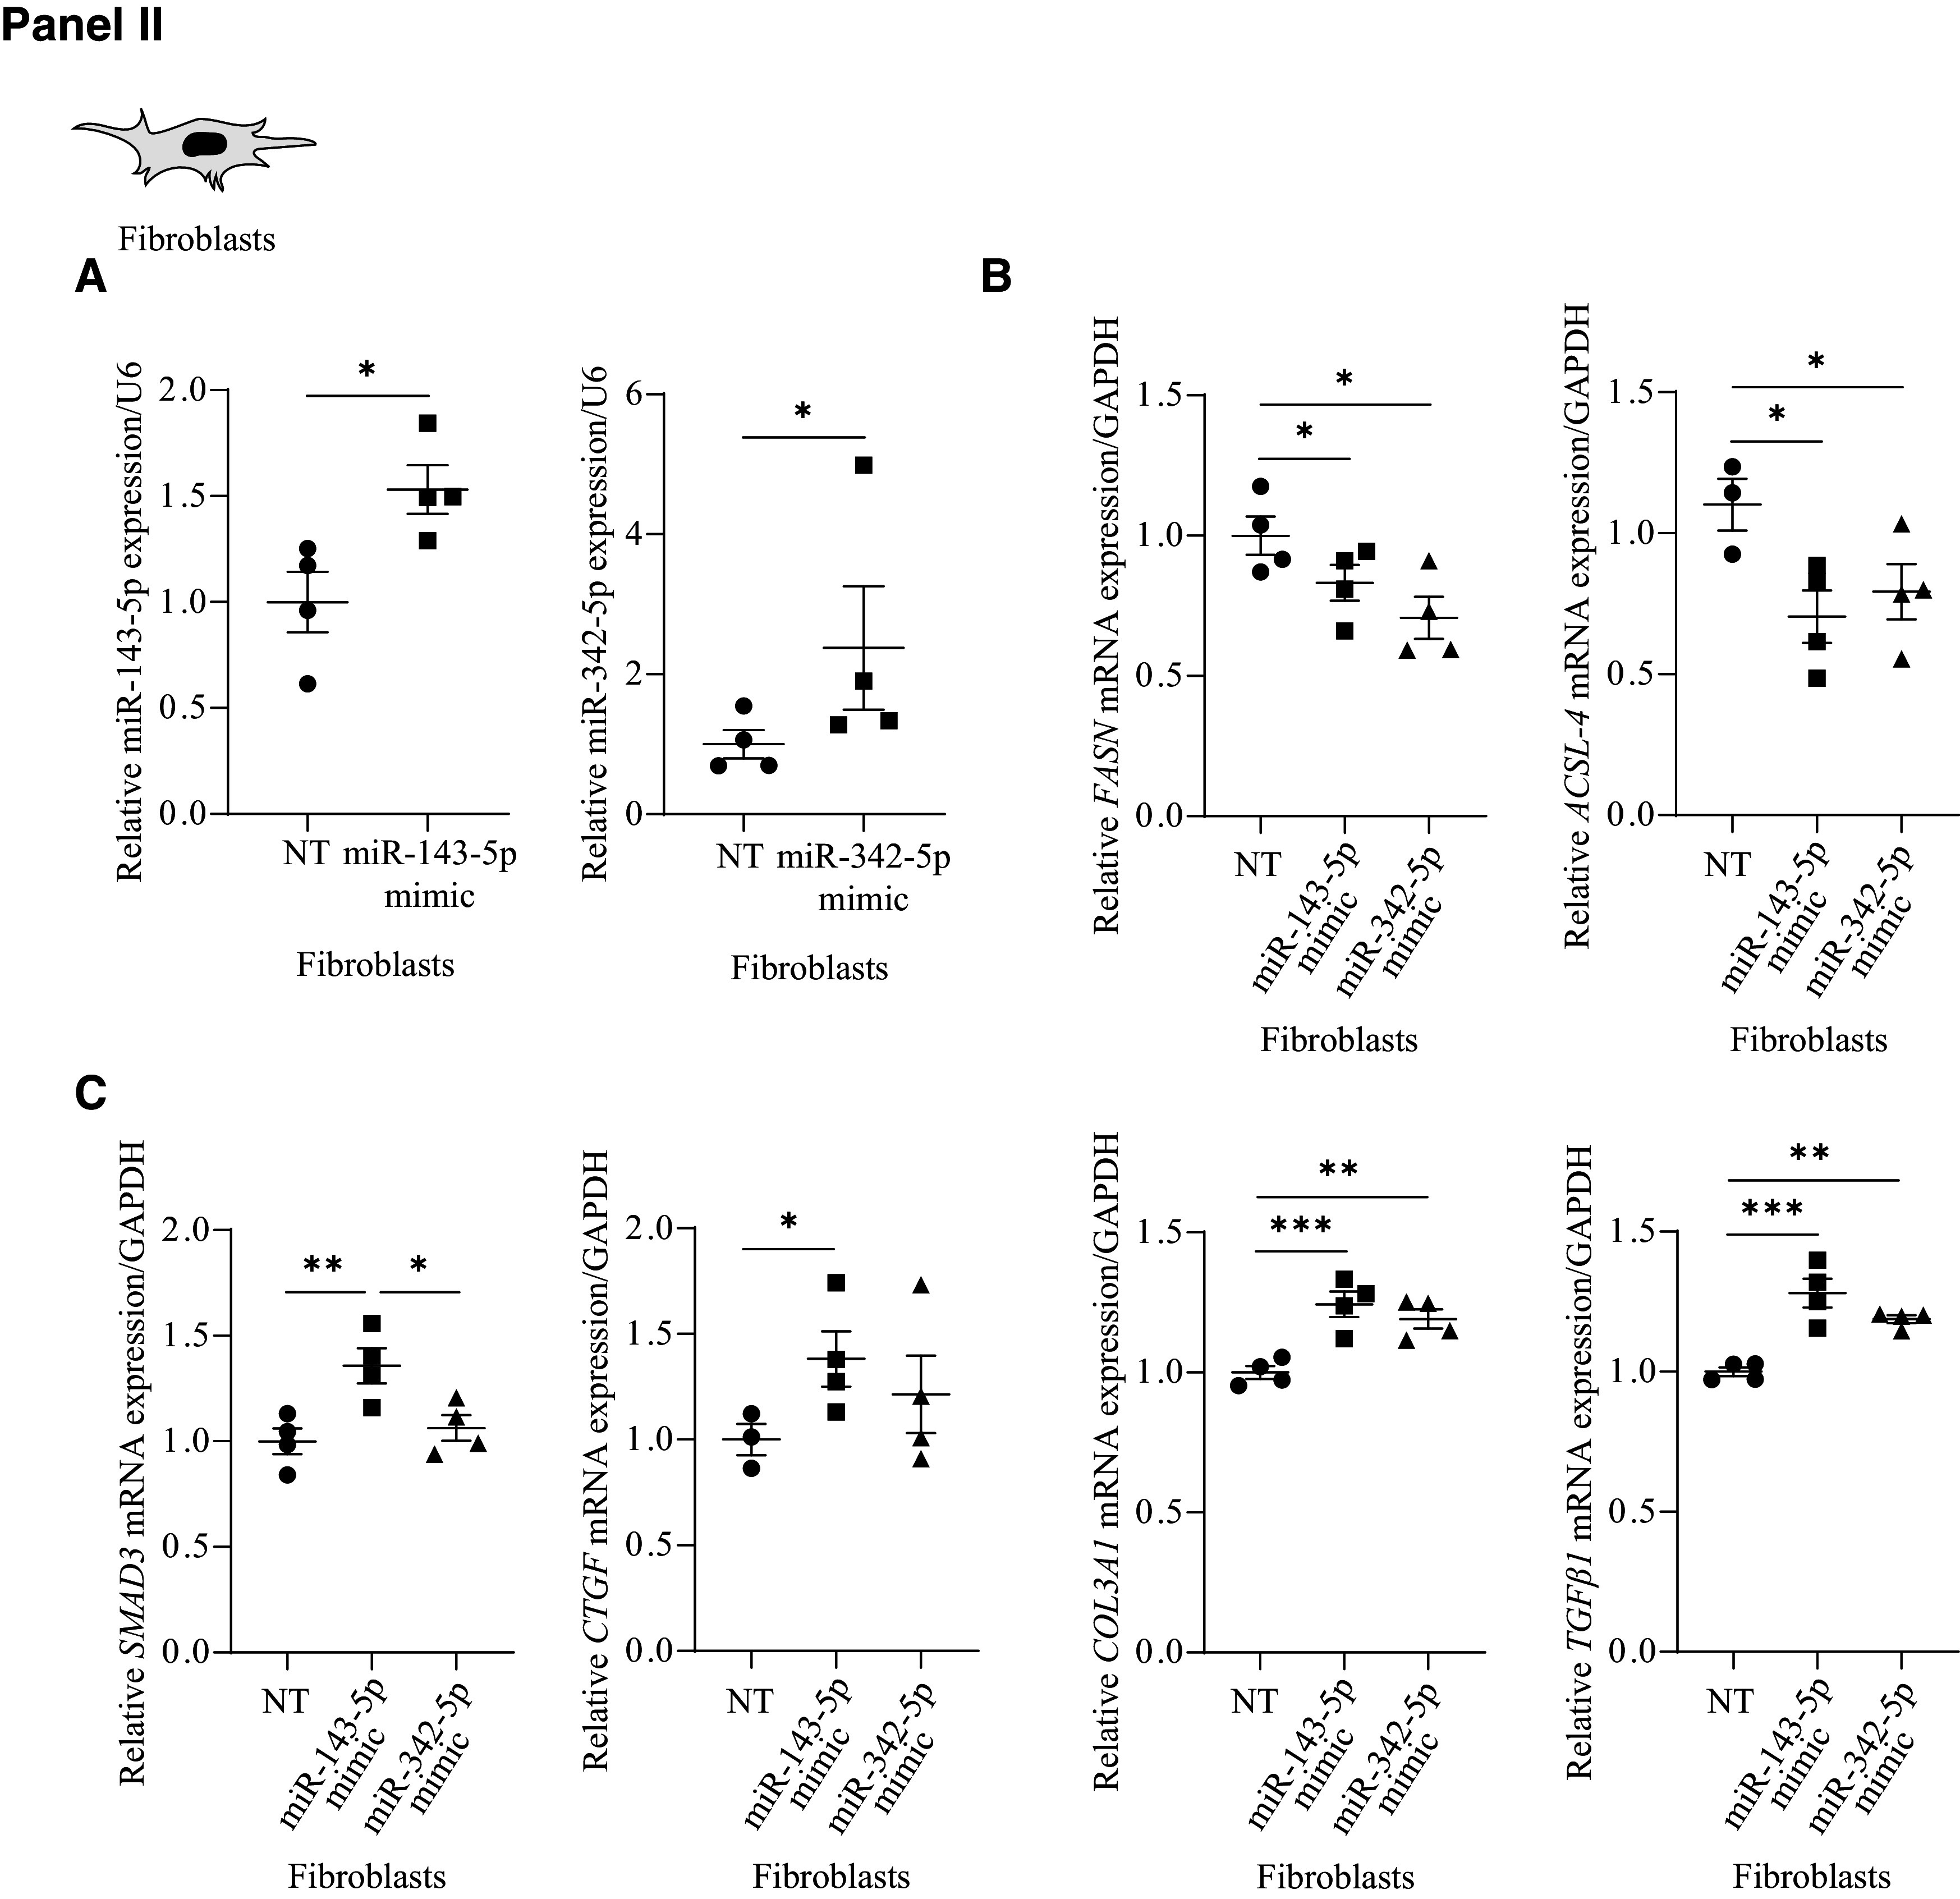
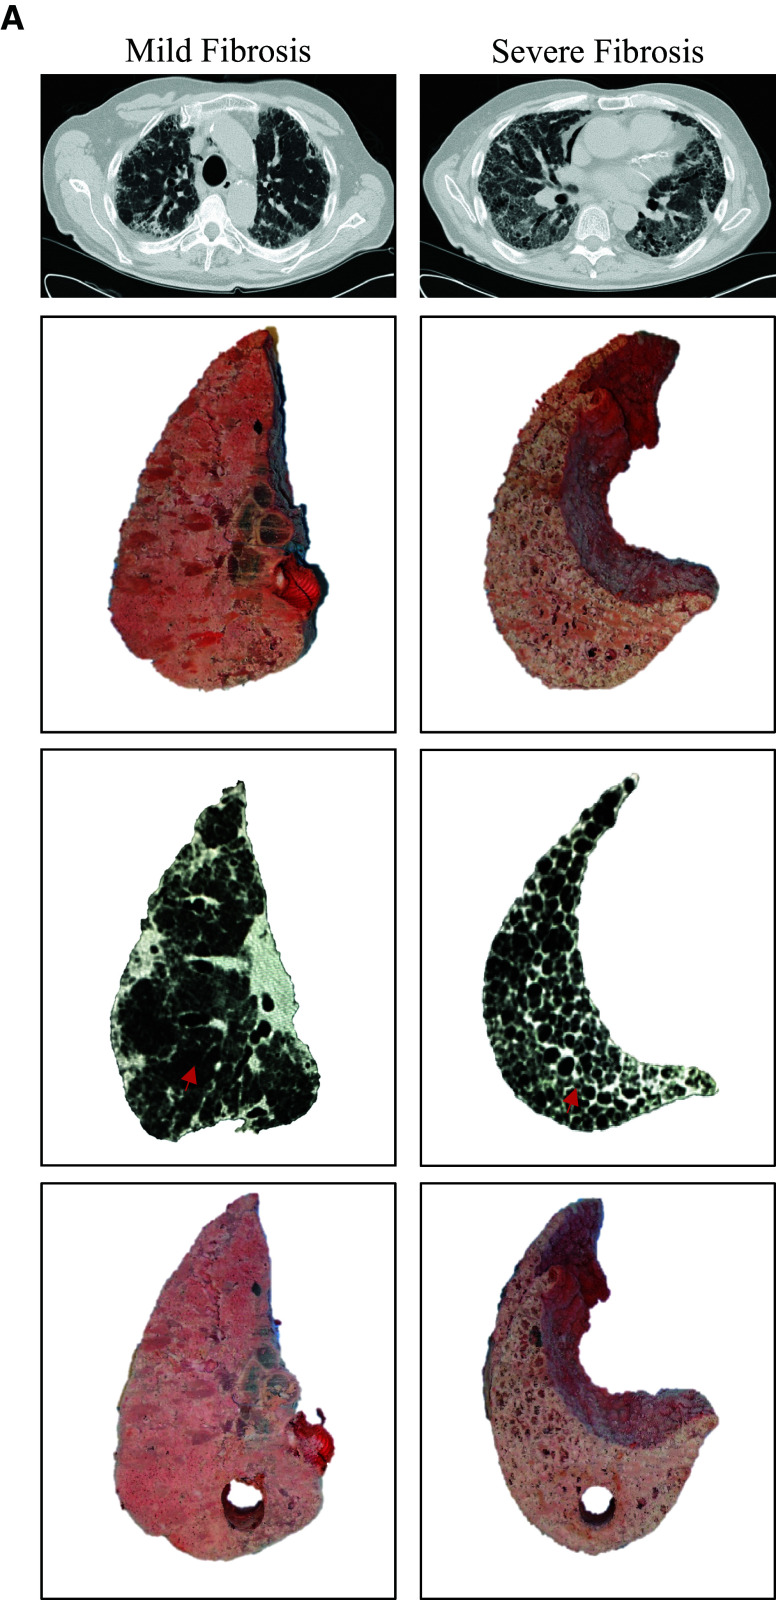
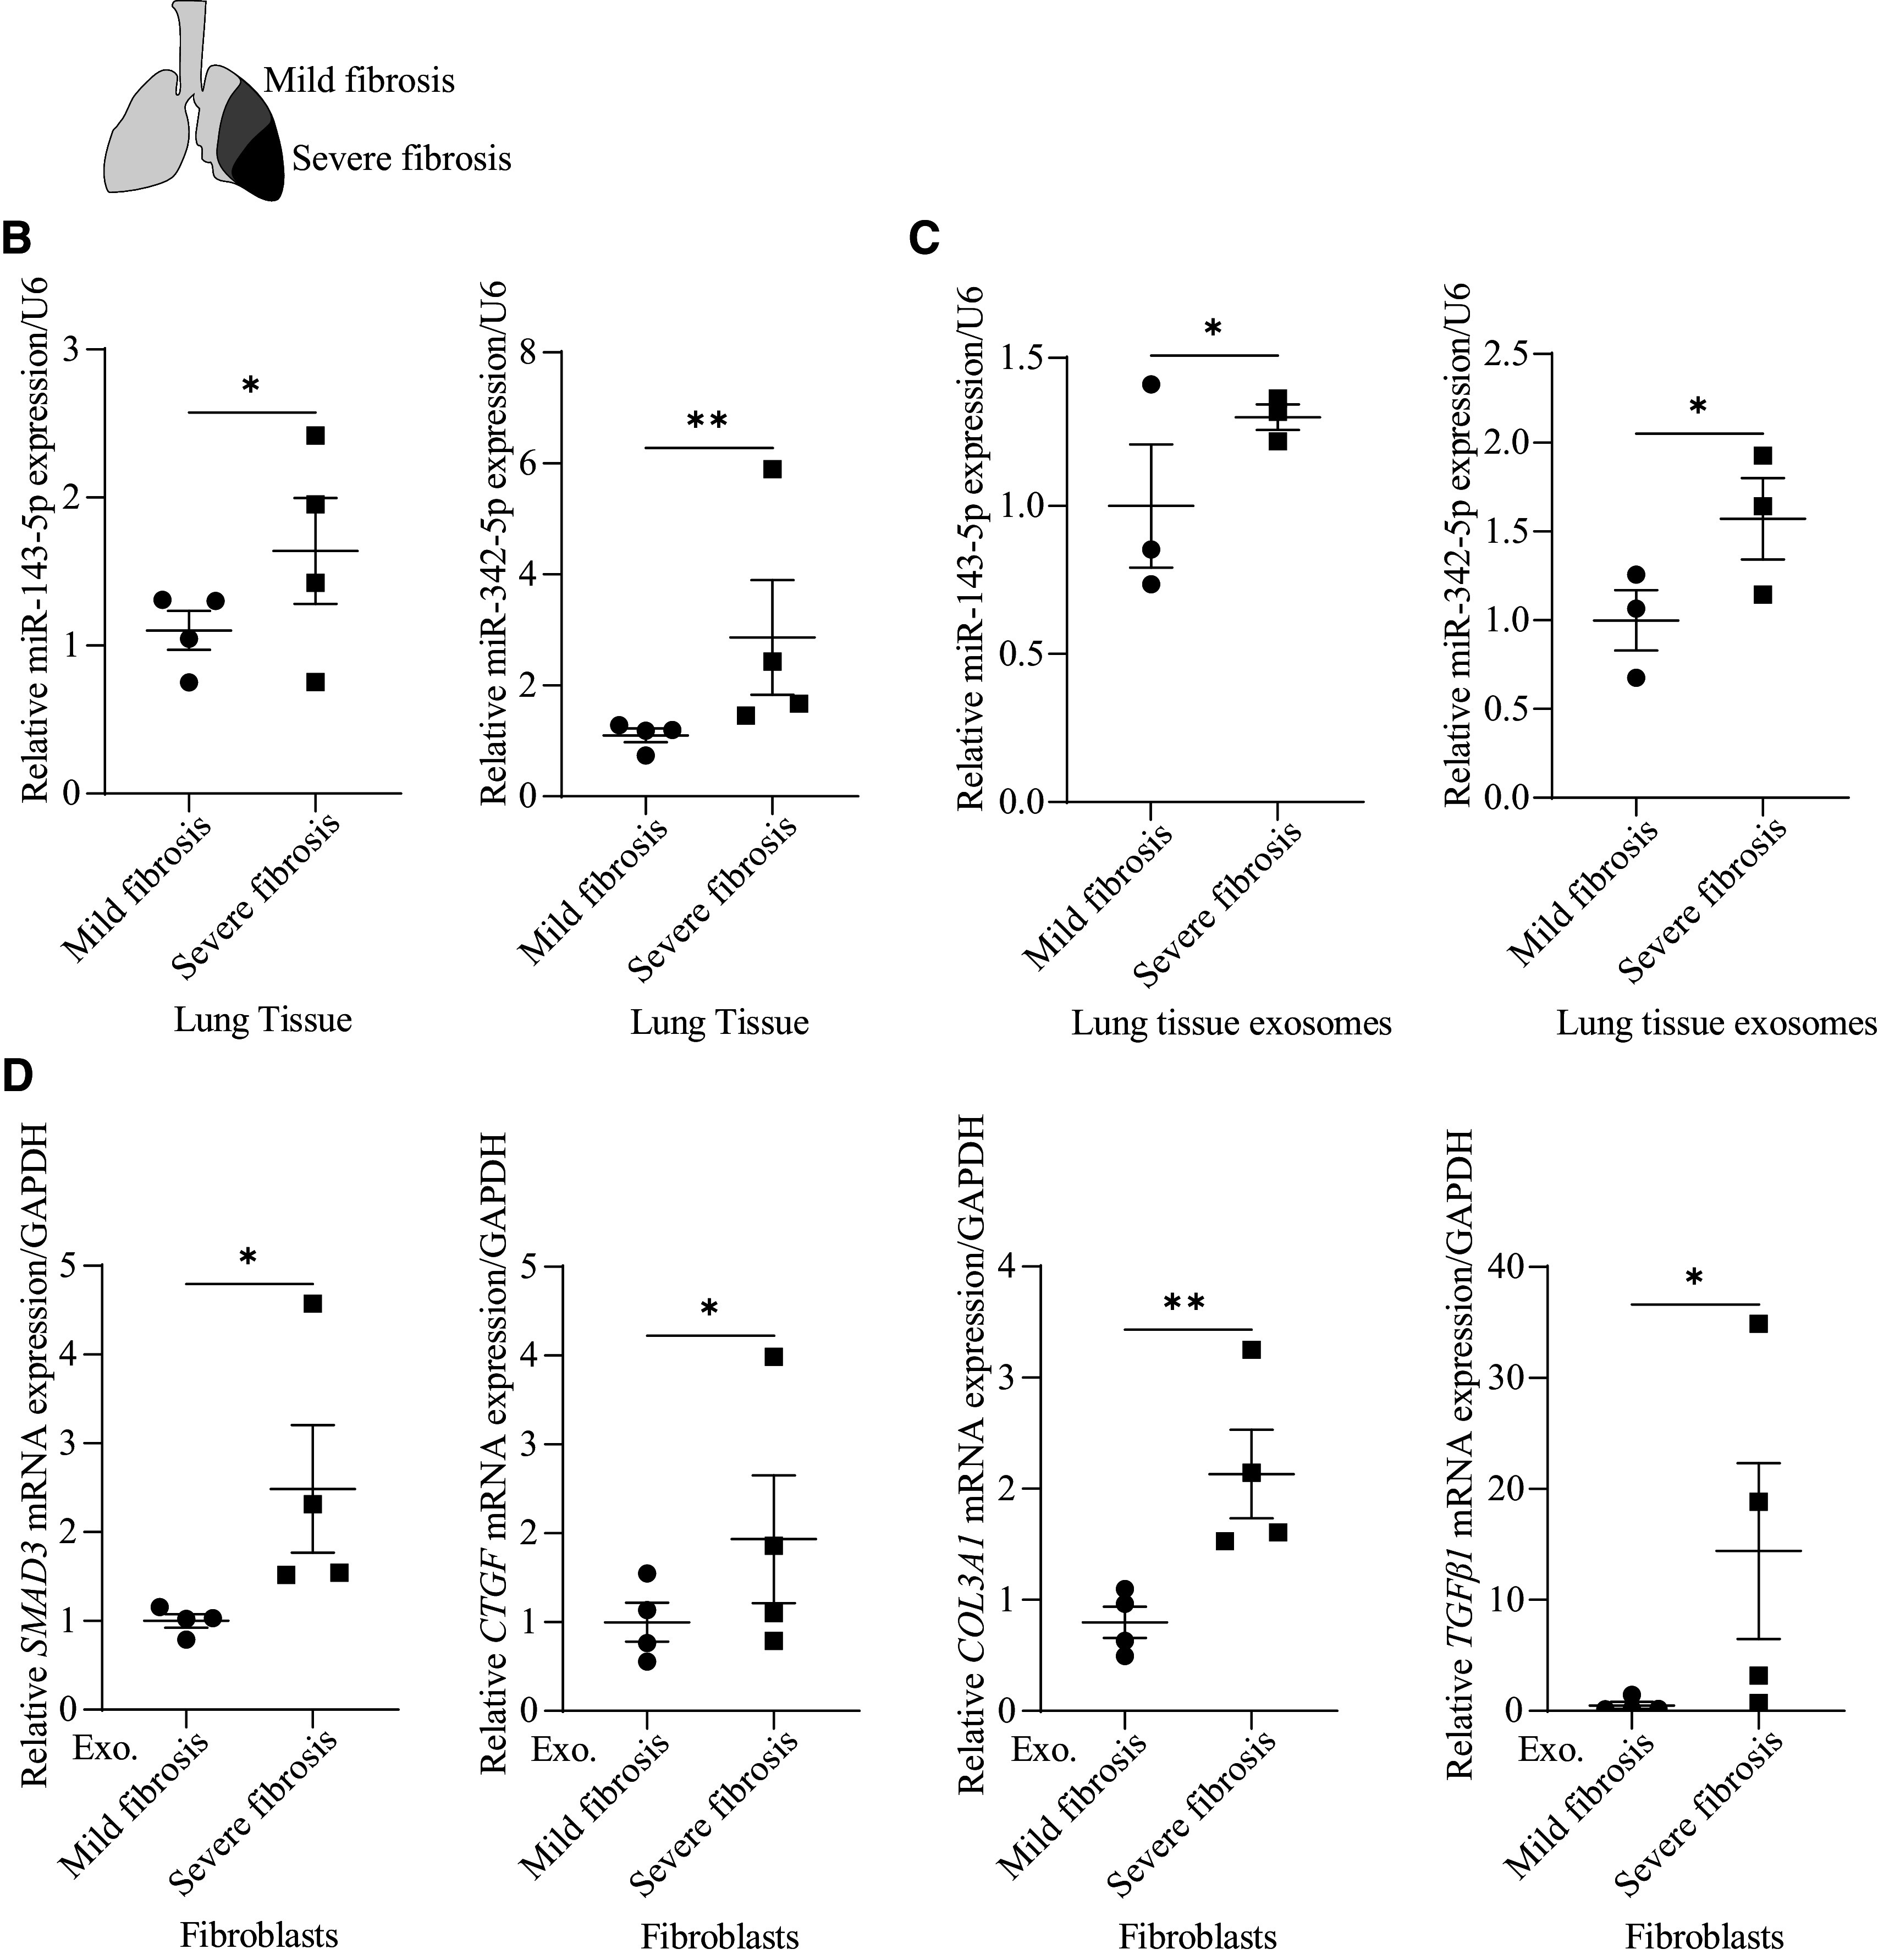
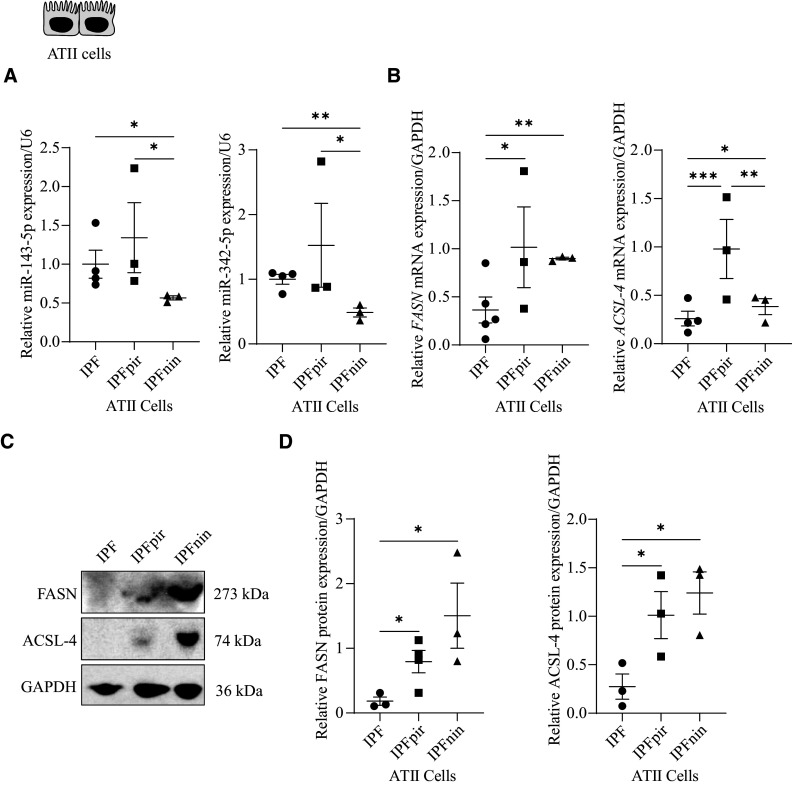
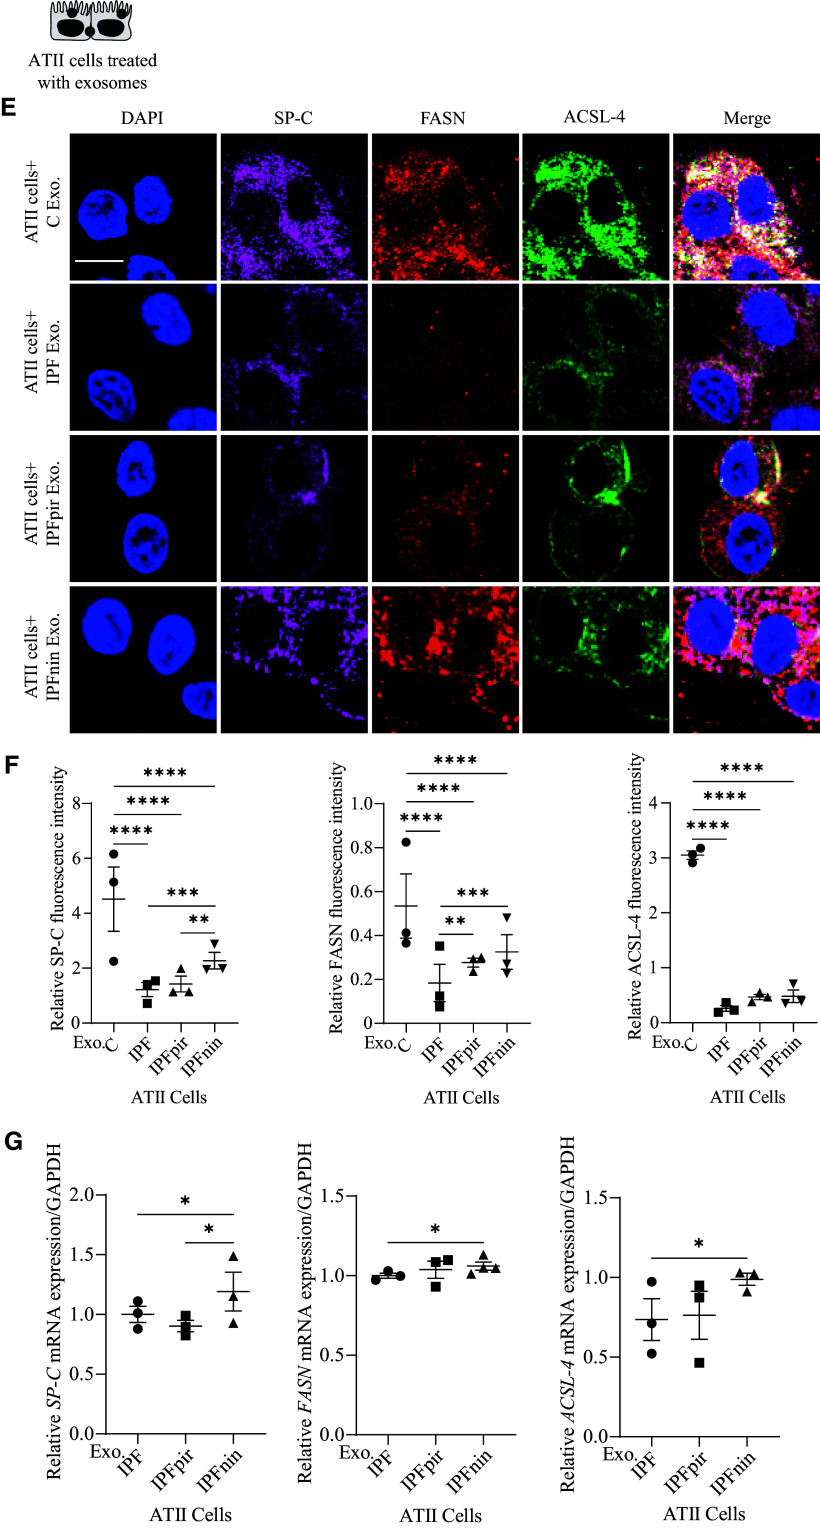
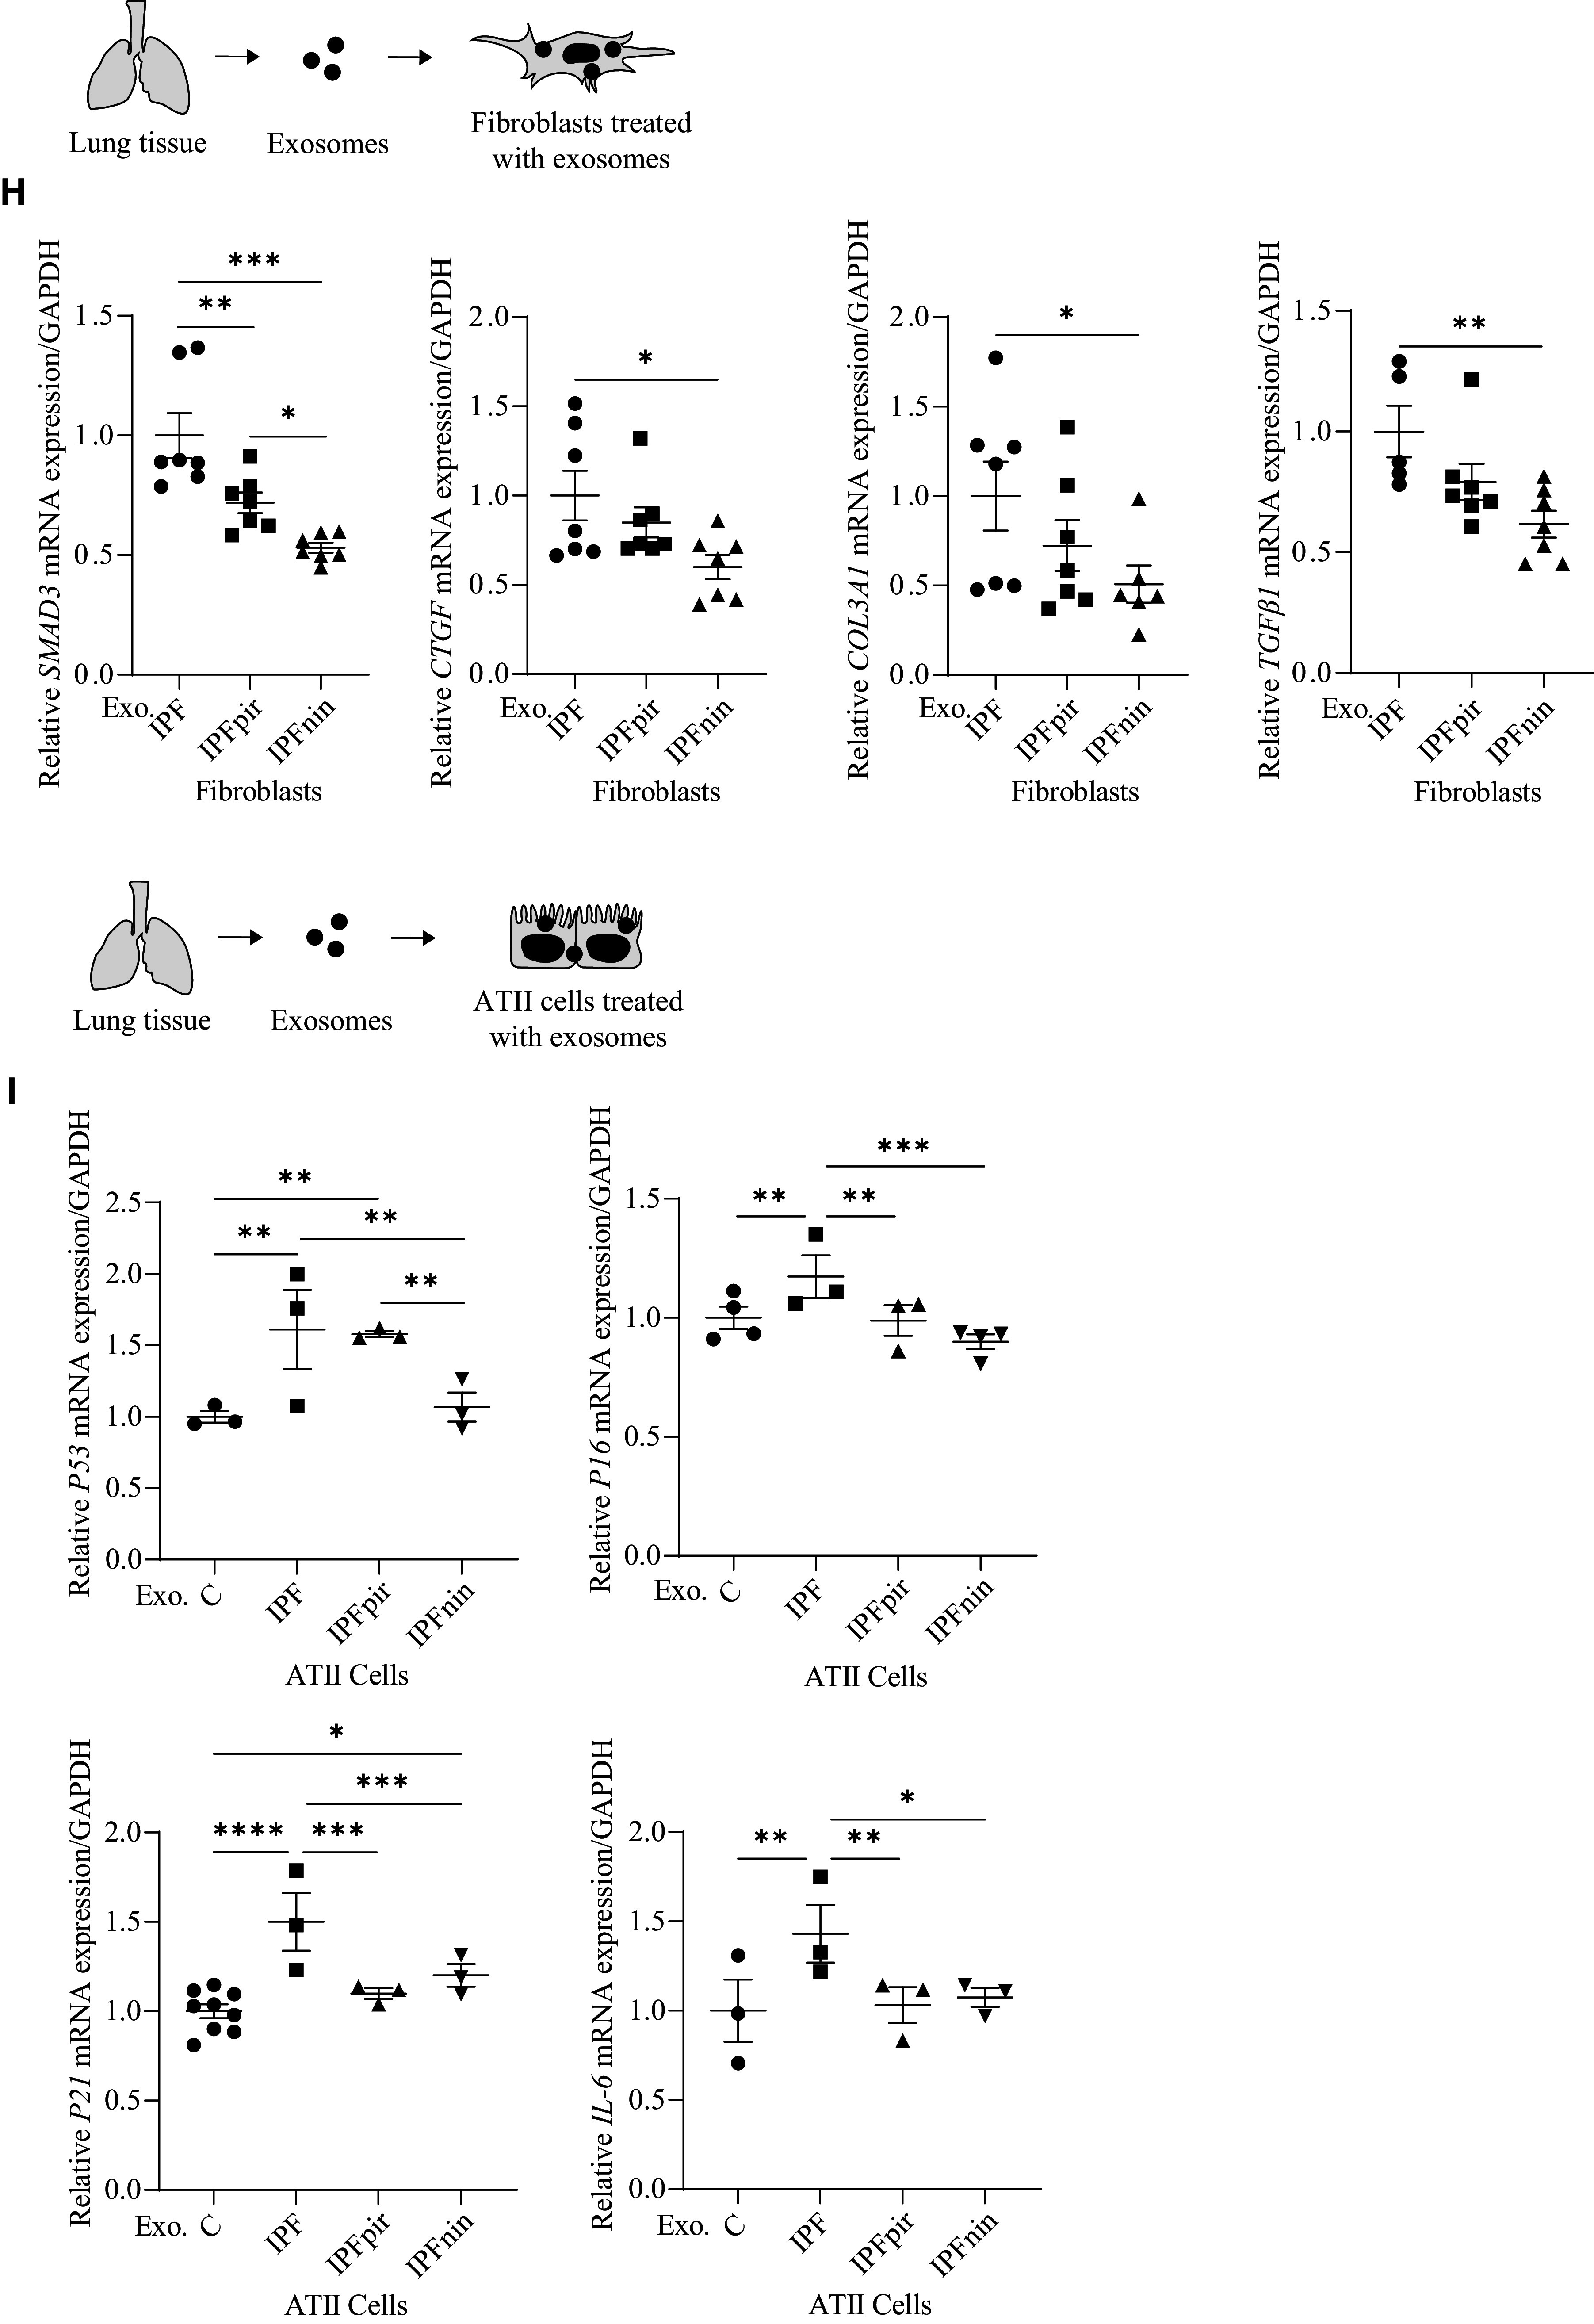
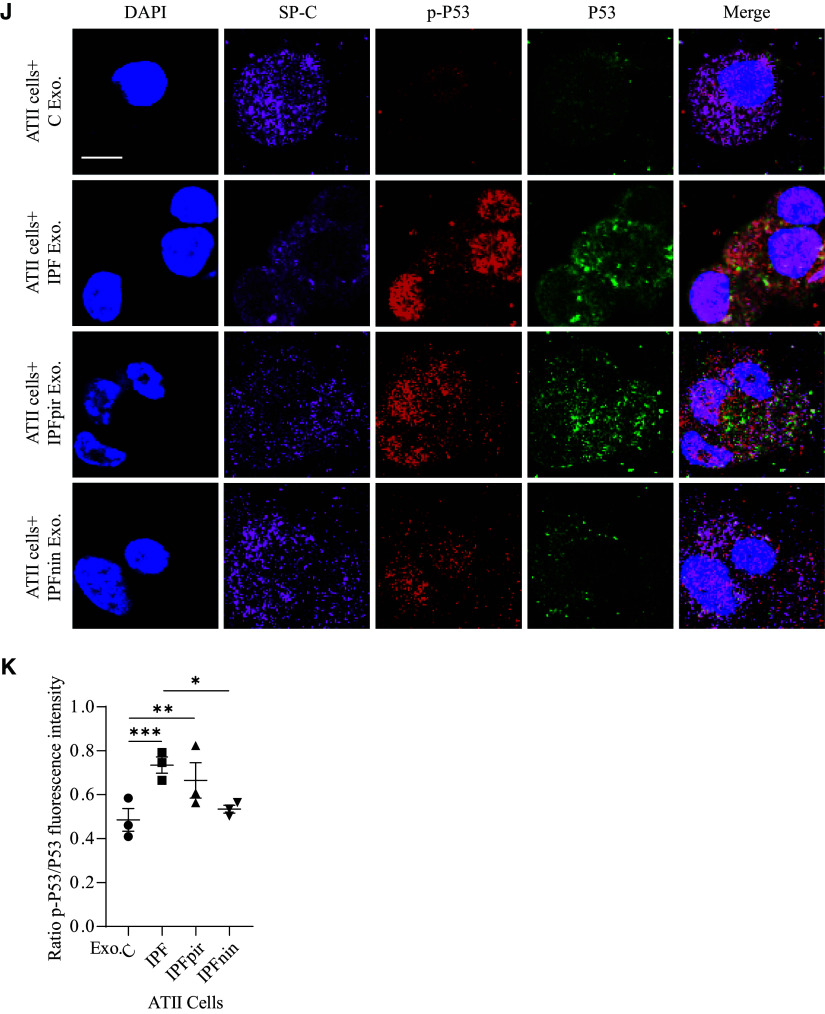
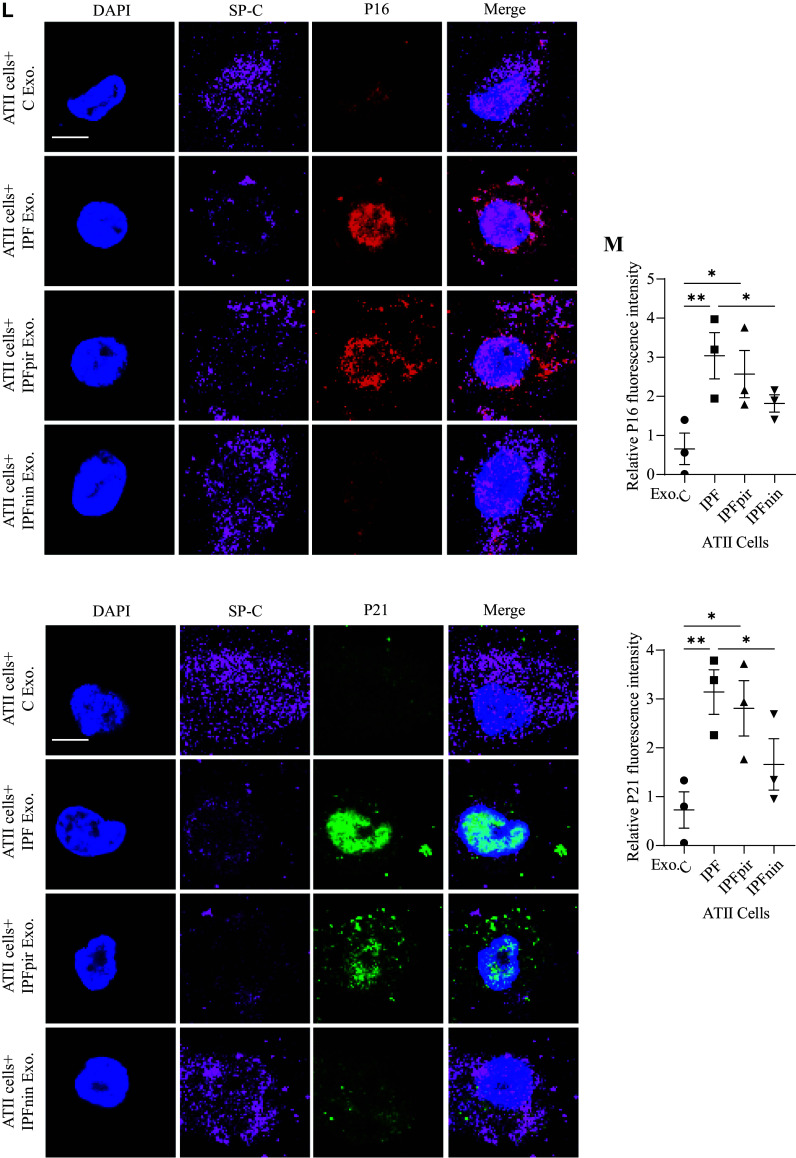
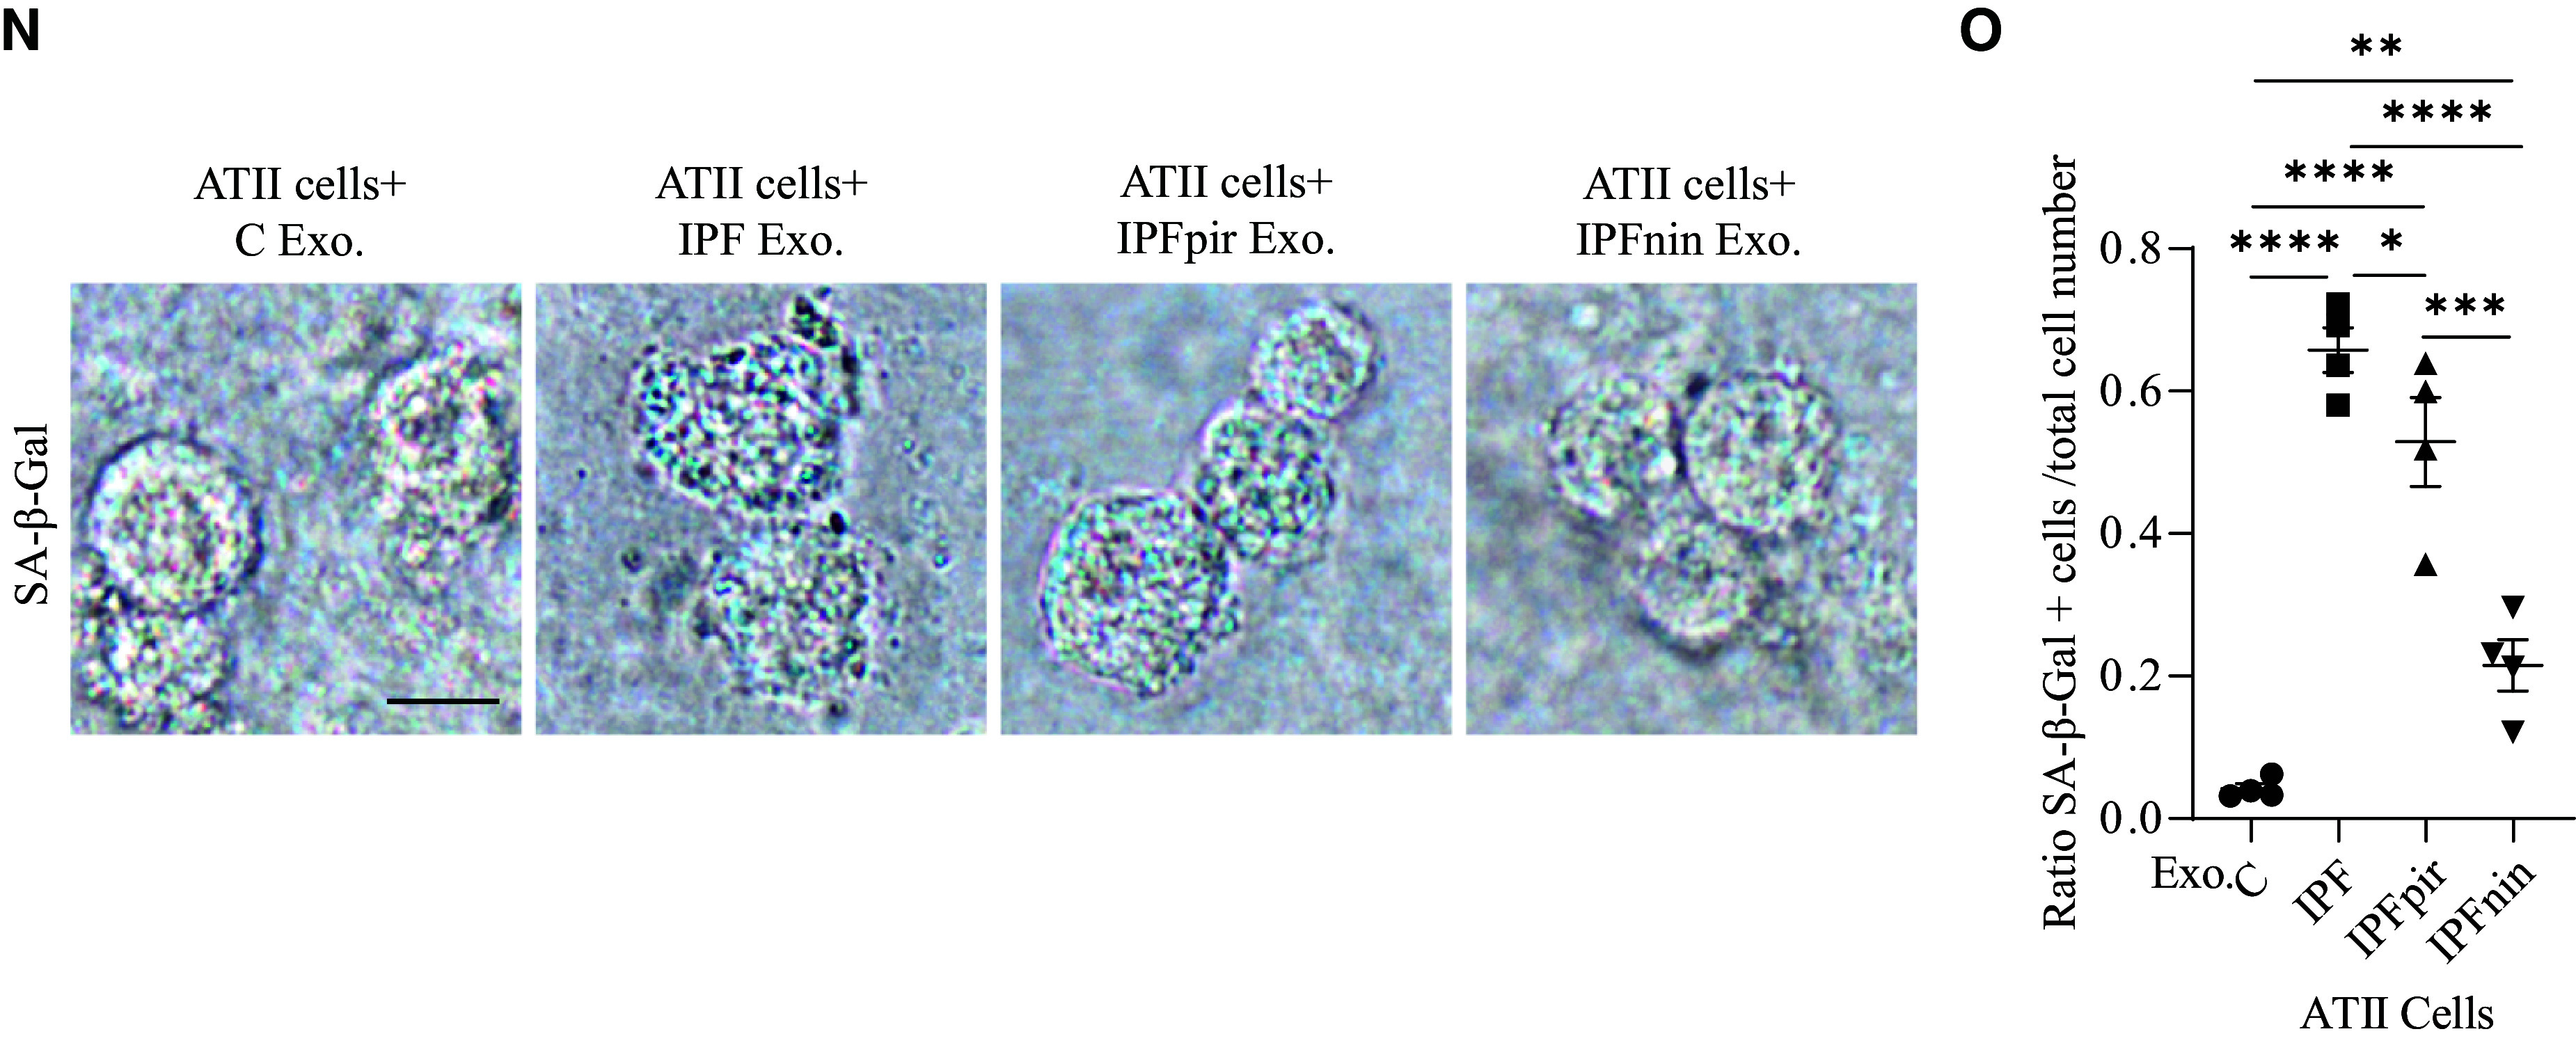
Idiopathic pulmonary fibrosis (IPF) is a chronic and progressive disease caused by an aberrant repair of injured alveolar epithelial cells. The maintenance of the alveolar epithelium and its regeneration after the damage is fueled by alveolar type II (ATII) cells. Injured cells release exosomes containing microRNAs (miRNAs), which can alter the recipient cells' function. Lung tissue, ATII cells, fibroblasts, plasma, and exosomes were obtained from naive patients with IPF, patients with IPF taking pirfenidone or nintedanib, and control organ donors. miRNA expression was analyzed to study their impact on exosome-mediated effects in IPF. High miR-143-5p and miR-342-5p levels were detected in ATII cells, lung tissue, plasma, and exosomes in naive patients with IPF. Decreased FASN (fatty acid synthase) and ACSL-4 (acyl-CoA-synthetase long-chain family member 4) expression was found in ATII cells. miR-143-5p and miR-342-5p overexpression or ATII cell treatment with IPF-derived exosomes containing these miRNAs lowered FASN and ACSL-4 levels. Also, this contributed to ATII cell injury and senescence. However, exosomes isolated from patients with IPF taking nintedanib or pirfenidone increased FASN expression in ATII cells compared with naive patients with IPF. Furthermore, fibroblast treatment with exosomes obtained from naive patients with IPF increased SMAD3, CTGF, COL3A1, and TGFβ1 expression. Our results suggest that IPF-derived exosomes containing miR-143-5p and miR-342-5p inhibited the de novo fatty acid synthesis pathway in ATII cells. They also induced the profibrotic response in fibroblasts. Pirfenidone and nintedanib improved ATII cell function and inhibited fibrogenesis. This study highlights the importance of exosomes in IPF pathophysiology.

Keywords: IPF; alveolar type II cells; exosomes; fatty acid synthesis; microRNA.


Figures

Figure 1.
Figure 1.
Characterization and identification of exosomes. Exosomes were isolated from lung tissue and plasma obtained from control organ donors (C) and naive patients with idiopathic pulmonary fibrosis (IPF). (A) Representative diagram of size and concentration of lung tissue–derived exosomes using NanoSight. (B) Representative diagram of lung tissue–derived exosomes analyzed by NanoSight. (C) Western blot images of CD63, CD81, and Cyt-c (cytochrome c) expression in lung tissue–derived exosomes. (D) microRNA (miRNA) levels were determined in exosomes obtained from plasma using RT-PCR. (E) miRNA expression in plasma by RT-PCR. (N = 3–7 samples per group. *P < 0.05, **P < 0.01, and ***P < 0.001.) Data are shown as means ± SEM.
Figure 1.
Figure 1.
Characterization and identification of exosomes. Exosomes were isolated from lung tissue and plasma obtained from control organ donors (C) and naive patients with idiopathic pulmonary fibrosis (IPF). (A) Representative diagram of size and concentration of lung tissue–derived exosomes using NanoSight. (B) Representative diagram of lung tissue–derived exosomes analyzed by NanoSight. (C) Western blot images of CD63, CD81, and Cyt-c (cytochrome c) expression in lung tissue–derived exosomes. (D) microRNA (miRNA) levels were determined in exosomes obtained from plasma using RT-PCR. (E) miRNA expression in plasma by RT-PCR. (N = 3–7 samples per group. *P < 0.05, **P < 0.01, and ***P < 0.001.) Data are shown as means ± SEM.
Figure 2.
Figure 2.
miRNA expression in lung tissue, alveolar type II (ATII) cells, and exosomes obtained from control subjects and patients with IPF. Samples were obtained from control organ donors and naive patients with IPF. (A) miRNA levels analyzed in lung tissue–derived exosomes using RT-PCR. (B) miRNA expression in lung tissue by RT-PCR. (C) Representative Western blotting image of SP-C expression in lung tissue–derived exosomes. (D) miRNA levels in ATII cells using RT-PCR. (E) ATII cell image by transmission electron microscopy (left image; scale bar, 5 μm). Vesicles are shown by black arrows (right image; scale bar, 0.2 μm). (N = 3–6 lungs per group. *P < 0.05, **P < 0.01, and ***P < 0.001.) Data are shown as means ± SEM.
Figure 2.
Figure 2.
miRNA expression in lung tissue, alveolar type II (ATII) cells, and exosomes obtained from control subjects and patients with IPF. Samples were obtained from control organ donors and naive patients with IPF. (A) miRNA levels analyzed in lung tissue–derived exosomes using RT-PCR. (B) miRNA expression in lung tissue by RT-PCR. (C) Representative Western blotting image of SP-C expression in lung tissue–derived exosomes. (D) miRNA levels in ATII cells using RT-PCR. (E) ATII cell image by transmission electron microscopy (left image; scale bar, 5 μm). Vesicles are shown by black arrows (right image; scale bar, 0.2 μm). (N = 3–6 lungs per group. *P < 0.05, **P < 0.01, and ***P < 0.001.) Data are shown as means ± SEM.
Figure 3.
Figure 3.
Overexpression of miR-143-5p and miR-342-5p mimics in ATII cells. (A) In silico analysis using DIANA miRPath v.3 shows miR-143-5p and miR-342-5p targets. (B) ATII cells were isolated from control organ donors. Cultured cells were transfected with miR-143-5p and miR-342-5p mimics, and their overexpression was confirmed by RT-PCR. (C) FASN (fatty acid synthase) and ACSL-4 (acyl-CoA-synthetase long-chain family member 4) mRNA levels in ATII cells with miR-143-5p and miR-342-5p mimic overexpression were determined by RT-PCR. (D) ATII cells were stained using SP-C (magenta), FASN (red), and ACSL-4 (green) antibodies and DAPI (blue) by immunofluorescence using confocal microscopy. Scale bars, 5 μm. (E) Quantification of fluorescence intensity is also shown. (F) FASN and ACSL-4 mRNA levels in lung tissue were evaluated by RT-PCR. (G) Representative images of FASN and ACSL-4 protein expression in lung tissue by Western blotting. (H) Quantification of protein expression normalized to GAPDH. (I) FASN and ACSL-4 mRNA levels in ATII cells by RT-PCR. (J) FASN and ACSL-4 protein expression in ATII cells by Western blotting. (K) Quantification of protein expression is shown. (L) FASN mRNA levels in ATII cells treated with TVB-3664 were detected by RT-PCR. (M) miR-143-5p and miR-342-5p expression in ATII cells treated with TVB-3664, detected by RT-PCR. (N) ATII cells were stained using SP-C (magenta), FASN (red) antibodies, and DAPI (blue) by immunofluorescence using confocal microscopy. Scale bars, 5 μm. (O) Quantification of FASN and SP-C fluorescence intensity. (P) P53 and P21 mRNA levels in ATII cells by RT-PCR. (N = 3–8 lungs per group. *P < 0.05, **P < 0.01, and ***P < 0.001.) Data are shown as means ± SEM. NT = non-target.
Figure 3.
Figure 3.
Overexpression of miR-143-5p and miR-342-5p mimics in ATII cells. (A) In silico analysis using DIANA miRPath v.3 shows miR-143-5p and miR-342-5p targets. (B) ATII cells were isolated from control organ donors. Cultured cells were transfected with miR-143-5p and miR-342-5p mimics, and their overexpression was confirmed by RT-PCR. (C) FASN (fatty acid synthase) and ACSL-4 (acyl-CoA-synthetase long-chain family member 4) mRNA levels in ATII cells with miR-143-5p and miR-342-5p mimic overexpression were determined by RT-PCR. (D) ATII cells were stained using SP-C (magenta), FASN (red), and ACSL-4 (green) antibodies and DAPI (blue) by immunofluorescence using confocal microscopy. Scale bars, 5 μm. (E) Quantification of fluorescence intensity is also shown. (F) FASN and ACSL-4 mRNA levels in lung tissue were evaluated by RT-PCR. (G) Representative images of FASN and ACSL-4 protein expression in lung tissue by Western blotting. (H) Quantification of protein expression normalized to GAPDH. (I) FASN and ACSL-4 mRNA levels in ATII cells by RT-PCR. (J) FASN and ACSL-4 protein expression in ATII cells by Western blotting. (K) Quantification of protein expression is shown. (L) FASN mRNA levels in ATII cells treated with TVB-3664 were detected by RT-PCR. (M) miR-143-5p and miR-342-5p expression in ATII cells treated with TVB-3664, detected by RT-PCR. (N) ATII cells were stained using SP-C (magenta), FASN (red) antibodies, and DAPI (blue) by immunofluorescence using confocal microscopy. Scale bars, 5 μm. (O) Quantification of FASN and SP-C fluorescence intensity. (P) P53 and P21 mRNA levels in ATII cells by RT-PCR. (N = 3–8 lungs per group. *P < 0.05, **P < 0.01, and ***P < 0.001.) Data are shown as means ± SEM. NT = non-target.
Figure 4.
Figure 4.
IPF-derived exosomes enhance profibrotic response in control fibroblasts and decrease FASN and ACSL-4 expression in control ATII cells. Panel I: Cultured lung fibroblasts and ATII cells isolated from control organ donors were treated with lung tissue–derived exosomes obtained from naive patients with IPF. (A) Exosomes stained with PKH26 dye (red) were internalized by fibroblasts labeled with PKH67 (green) and Hoechst 33342 (blue; scale bar, 10 μm). (B) Quantification of exosome internalization by fibroblasts is shown. (C) SMAD3, CTGF, COL3A1, and TGFβ1 mRNA levels in fibroblasts treated with exosomes by RT-PCR. (D) Fibroblasts obtained from IPF were treated with lung tissue–derived exosomes isolated from control organ donors. SMAD3, CTGF, COL3A1, and TGFβ1 mRNA levels were detected by RT-PCR. Panel II: Overexpression of miR-143-5p and miR-342-5p mimics in cultured lung fibroblasts. (A) miR-143-5p and miR-342-5p mimic overexpression was confirmed by RT-PCR. (B) FASN and ACSL-4 mRNA expression in fibroblasts detected by RT-PCR. (C) SMAD3, CTGF, COL3A1, and TGFβ1 mRNA levels by RT-PCR. Panel III: The impact of exosomes on cultured ATII cells isolated from control organ donors. (A) Exosomes stained with PKH26 dye (red) were internalized by ATII cells labeled by PKH67 dye (green) and Hoechst 33342 (blue; scale bar, 10 μm). (B) Quantification of exosome internalization by ATII cells is shown. (C) miR-143-5p and miR-342-5p levels in ATII cells treated with exosomes obtained from patients with IPF. (D) FASN, ACSL-4, and SP-C mRNA levels in ATII cells treated with exosomes by RT-PCR. (N = 3–9 lungs per group; *P < 0.05, **P < 0.01, ***P < 0.001, and ****P < 0.0001.) Data are shown as means ± SEM. Exo = exosomes.
Figure 4.
Figure 4.
IPF-derived exosomes enhance profibrotic response in control fibroblasts and decrease FASN and ACSL-4 expression in control ATII cells. Panel I: Cultured lung fibroblasts and ATII cells isolated from control organ donors were treated with lung tissue–derived exosomes obtained from naive patients with IPF. (A) Exosomes stained with PKH26 dye (red) were internalized by fibroblasts labeled with PKH67 (green) and Hoechst 33342 (blue; scale bar, 10 μm). (B) Quantification of exosome internalization by fibroblasts is shown. (C) SMAD3, CTGF, COL3A1, and TGFβ1 mRNA levels in fibroblasts treated with exosomes by RT-PCR. (D) Fibroblasts obtained from IPF were treated with lung tissue–derived exosomes isolated from control organ donors. SMAD3, CTGF, COL3A1, and TGFβ1 mRNA levels were detected by RT-PCR. Panel II: Overexpression of miR-143-5p and miR-342-5p mimics in cultured lung fibroblasts. (A) miR-143-5p and miR-342-5p mimic overexpression was confirmed by RT-PCR. (B) FASN and ACSL-4 mRNA expression in fibroblasts detected by RT-PCR. (C) SMAD3, CTGF, COL3A1, and TGFβ1 mRNA levels by RT-PCR. Panel III: The impact of exosomes on cultured ATII cells isolated from control organ donors. (A) Exosomes stained with PKH26 dye (red) were internalized by ATII cells labeled by PKH67 dye (green) and Hoechst 33342 (blue; scale bar, 10 μm). (B) Quantification of exosome internalization by ATII cells is shown. (C) miR-143-5p and miR-342-5p levels in ATII cells treated with exosomes obtained from patients with IPF. (D) FASN, ACSL-4, and SP-C mRNA levels in ATII cells treated with exosomes by RT-PCR. (N = 3–9 lungs per group; *P < 0.05, **P < 0.01, ***P < 0.001, and ****P < 0.0001.) Data are shown as means ± SEM. Exo = exosomes.
Figure 5.
Figure 5.
Increased miR-143-5p and miR-342-5p levels in severe fibrosis. (A) Representative computed tomography scan of IPF lung with mild and severe fibrosis in the same patient. (B) miR-143-5p and miR-342-5p levels in tissue obtained from mild and severe fibrosis areas by RT-PCR. (C) miR-143-5p and miR-342-5p expression in lung tissue–derived exosomes isolated from mild and severe fibrosis areas. (D) Fibroblasts obtained from control organ donors were cultured. SMAD3, CTGF, COL3A1, and TGFβ1 mRNA levels in fibroblasts treated with lung tissue–derived exosomes isolated from mild and severe fibrosis areas (N = 3–4 lungs; *P < 0.05 and **P < 0.01.) Data are shown as means ± SEM.
Figure 5.
Figure 5.
Increased miR-143-5p and miR-342-5p levels in severe fibrosis. (A) Representative computed tomography scan of IPF lung with mild and severe fibrosis in the same patient. (B) miR-143-5p and miR-342-5p levels in tissue obtained from mild and severe fibrosis areas by RT-PCR. (C) miR-143-5p and miR-342-5p expression in lung tissue–derived exosomes isolated from mild and severe fibrosis areas. (D) Fibroblasts obtained from control organ donors were cultured. SMAD3, CTGF, COL3A1, and TGFβ1 mRNA levels in fibroblasts treated with lung tissue–derived exosomes isolated from mild and severe fibrosis areas (N = 3–4 lungs; *P < 0.05 and **P < 0.01.) Data are shown as means ± SEM.
Figure 6.
Figure 6.
Pirfenidone and nintedanib increased FASN and ACSL-4 expression in ATII cells in patients with IPF. Cultured ATII cells and fibroblasts isolated from control organ donors were treated with lung tissue–derived exosomes obtained from naive patients with IPF and patients with IPF treated with pirfenidone (pir) or nintedanib (nin). (A) miR-143-5p and miR-342-5p expression in ATII cells isolated from patients with IPF by RT-PCR. (B) FASN and ACSL-4 mRNA levels in ATII cells isolated from IPF using RT-PCR. (C) Representative Western blotting images of FASN and ACSL-4 expression in ATII cells. (D) Quantification of protein expression is also shown. (E) Cultured ATII cells were treated with lung tissue–derived exosomes obtained from naive patients with IPF and medicated patients with IPF. Cells were stained using SP-C (magenta), FASN (red), and ACSL-4 (green) antibodies and DAPI (blue) by immunofluorescence using confocal microscopy. (F) Quantification of their fluorescence intensity is also shown. (G) SP-C, FASN, and ACSL-4 mRNA levels by RT-PCR in ATII cells treated with exosomes obtained from naive patients with IPF and patients with IPF treated with pirfenidone or nintedanib. (H) SMAD3, CTGF, COL3A1, and TGFβ1 mRNA levels by RT-PCR in fibroblasts treated with lung tissue–derived exosomes obtained from naive patients with IPF and medicated patients with IPF. Cultured ATII cells isolated from organ donors were treated with exosomes obtained from the lung tissue of naive patients with IPF or patients with IPF medicated with pirfenidone or nintedanib. (I) P53, P16, P21, and IL-6 mRNA levels in ATII cells by RT-PCR. (J) ATII cells were stained using SP-C (magenta), p-P53 (red), and P53 (green) antibodies and DAPI (blue) by immunofluorescence using confocal microscopy. (K) Quantification of p-P53/P53 is also shown. (L) ATII cells were stained using SP-C (magenta), P16 (red), and P21 (green) antibodies and DAPI (blue) by immunofluorescence using confocal microscopy. (M) Quantification of their fluorescence intensity is also shown. (N) Representative images of SA-β-Gal staining in ATII cells. (O) The quantification of SA-β-Gal–positive ATII cells (N = 3–9 lungs per group. Scale bars, 5 μm. *P < 0.05, **P < 0.01, ***P < 0.001, and ****P < 0.0001.) Data are shown as means ± SEM.
Figure 6.
Figure 6.
Pirfenidone and nintedanib increased FASN and ACSL-4 expression in ATII cells in patients with IPF. Cultured ATII cells and fibroblasts isolated from control organ donors were treated with lung tissue–derived exosomes obtained from naive patients with IPF and patients with IPF treated with pirfenidone (pir) or nintedanib (nin). (A) miR-143-5p and miR-342-5p expression in ATII cells isolated from patients with IPF by RT-PCR. (B) FASN and ACSL-4 mRNA levels in ATII cells isolated from IPF using RT-PCR. (C) Representative Western blotting images of FASN and ACSL-4 expression in ATII cells. (D) Quantification of protein expression is also shown. (E) Cultured ATII cells were treated with lung tissue–derived exosomes obtained from naive patients with IPF and medicated patients with IPF. Cells were stained using SP-C (magenta), FASN (red), and ACSL-4 (green) antibodies and DAPI (blue) by immunofluorescence using confocal microscopy. (F) Quantification of their fluorescence intensity is also shown. (G) SP-C, FASN, and ACSL-4 mRNA levels by RT-PCR in ATII cells treated with exosomes obtained from naive patients with IPF and patients with IPF treated with pirfenidone or nintedanib. (H) SMAD3, CTGF, COL3A1, and TGFβ1 mRNA levels by RT-PCR in fibroblasts treated with lung tissue–derived exosomes obtained from naive patients with IPF and medicated patients with IPF. Cultured ATII cells isolated from organ donors were treated with exosomes obtained from the lung tissue of naive patients with IPF or patients with IPF medicated with pirfenidone or nintedanib. (I) P53, P16, P21, and IL-6 mRNA levels in ATII cells by RT-PCR. (J) ATII cells were stained using SP-C (magenta), p-P53 (red), and P53 (green) antibodies and DAPI (blue) by immunofluorescence using confocal microscopy. (K) Quantification of p-P53/P53 is also shown. (L) ATII cells were stained using SP-C (magenta), P16 (red), and P21 (green) antibodies and DAPI (blue) by immunofluorescence using confocal microscopy. (M) Quantification of their fluorescence intensity is also shown. (N) Representative images of SA-β-Gal staining in ATII cells. (O) The quantification of SA-β-Gal–positive ATII cells (N = 3–9 lungs per group. Scale bars, 5 μm. *P < 0.05, **P < 0.01, ***P < 0.001, and ****P < 0.0001.) Data are shown as means ± SEM.
Figure 7.
Figure 7.
Model of the exosomal miRNA function in IPF. Increased miR-143-5p and miR-342-5p were detected in all analyzed samples obtained from naive patients with IPF. Lung tissue–derived exosomes isolated from naive patients with IPF induced ATII cell senescence and fibroblast differentiation to myofibroblasts. Exosomes obtained from patients with IPF treated with nintedanib increased SP-C expression in ATII cells and decreased expression of profibrotic genes in fibroblasts compared with naive patients with IPF.

Comment in

References

    1. Raghu G, Remy-Jardin M, Myers JL, Richeldi L, Ryerson CJ, Lederer DJ, et al. American Thoracic Society, European Respiratory Society, Japanese Respiratory Society, and Latin American Thoracic Society Diagnosis of idiopathic pulmonary fibrosis: an official ATS/ERS/JRS/ALAT clinical practice guideline. Am J Respir Crit Care Med . 2018;198:e44–e68. - PubMed
    1. Sharif R. Overview of idiopathic pulmonary fibrosis (IPF) and evidence-based guidelines. Am J Manag Care . 2017;23:S176–S182. - PubMed
    1. Marijic P, Schwarzkopf L, Schwettmann L, Ruhnke T, Trudzinski F, Kreuter M. Pirfenidone vs. nintedanib in patients with idiopathic pulmonary fibrosis: a retrospective cohort study. Respir Res . 2021;22:268. - PMC - PubMed
    1. Lin CR, Bahmed K, Kosmider B. Impaired alveolar re-epithelialization in pulmonary emphysema. Cells . 2022;11:2055. - PMC - PubMed
    1. Parimon T, Yao C, Stripp BR, Noble PW, Chen P. Alveolar epithelial type II cells as drivers of lung fibrosis in idiopathic pulmonary fibrosis. Int J Mol Sci . 2020;21:2269. - PMC - PubMed

MeSH terms

LinkOut - more resources