. 2024 Feb 5;221(2):e20230675.
doi: 10.1084/jem.20230675. Epub 2023 Dec 20.

CD163+ macrophages monitor enhanced permeability at the blood-dorsal root ganglion barrier

Affiliations

CD163+ macrophages monitor enhanced permeability at the blood-dorsal root ganglion barrier

Harald Lund et al. J Exp Med. .

Abstract

In dorsal root ganglia (DRG), macrophages reside close to sensory neurons and have largely been explored in the context of pain, nerve injury, and repair. However, we discovered that most DRG macrophages interact with and monitor the vasculature by sampling macromolecules from the blood. Characterization of the DRG vasculature revealed a specialized endothelial bed that transformed in molecular, structural, and permeability properties along the arteriovenous axis and was covered by macrophage-interacting pericytes and fibroblasts. Macrophage phagocytosis spatially aligned with peak endothelial permeability, a process regulated by enhanced caveolar transcytosis in endothelial cells. Profiling the DRG immune landscape revealed two subsets of perivascular macrophages with distinct transcriptome, turnover, and function. CD163+ macrophages self-maintained locally, specifically participated in vasculature monitoring, displayed distinct responses during peripheral inflammation, and were conserved in mouse and man. Our work provides a molecular explanation for the permeability of the blood-DRG barrier and identifies an unappreciated role of macrophages as integral components of the DRG-neurovascular unit.


Conflict of interest statement

Disclosures: Z. Kurtović reported “other” from Kancera AB (PhD salary) during the conduct of the study. J.H. Graversen reported being a minor shareholder of OncoSpear ApS that develops CD163 antibodies for the treatment of cancer. No other disclosures were reported.

Figures

None
Graphical abstract
Figure 1.
Figure 1.
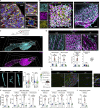
DRG macrophages interact with the vasculature. (A) Representative immunostaining of neurons, SGCs, endothelial cells, and macrophages in naive DRGs. Scale bar, 40 and 10 μm (inset). (B) 3D confocal images of DRG whole mounts to visualize neurons, macrophages, and endothelial cells. Scale bar, 30 μm (left) and 80 μm (right). (C) 3D confocal images of iDISCO-cleared whole mounts of DRGs with attached SpN and DRs and ventral roots (VR) stained with Iba1 and CD31. Scale bar, 400 μm. (D) Confocal Z-stacks of boxed areas in C and quantifications of macrophage and vascular density performed in indicated regions. n = 10 (SpN), 10 (DRG), 11 (DR) mice. Tukey’s multiple comparisons test. ***P < 0.001; ns, not significant. Scale bar, 40 μm. (E) Morphology of perivascular macrophages as measured by their spareness (high value indicates spider-like shape) and elongation (high value indicates cigar-like shape). Data are mean values of individual macrophages from n = 10 (SpN), 10 (DRG), 11 (DR) mice. Tukey’s multiple comparisons test. **P < 0.01, ***P < 0.001; ns, not significant. Scale, bar 10 μm. (F) Experiment schematic of i.v tracer injections. Created with https://BioRender.com. (G and H) (G) Representative confocal images (scale bar, 100 μm) and (H) quantification of BSA-A647 (20 mg/kg) uptake in Iba1+ macrophages 1 h after i.v injection. n = 4 mice/group. The experiment was performed twice. Tukey’s multiple comparisons test. ***P < 0.001; ns, not significant. (I) Uptake of goat IgG-A488 (4 mg/kg) in Iba1+ macrophages 4 h after i.v injection. n = 4 mice/group. The experiment was performed twice. Tukey’s multiple comparisons test. **P < 0.01, ***P < 0.001; ns, not significant. (J) Uptake of 70 kD dextran-TMR (10 mg/kg) in Iba1+ macrophages 2 h 45 min after i.v injection. The experiment was performed twice. Tukey’s multiple comparisons test. **P < 0.01, ***P < 0.001; ns, not significant.
Figure S1.
Figure S1.
Additional arteriovenous zonation characteristics of DRG endothelium. (A) Flow cytometry–based quantification of CD64+F4/80+ DRG or ScN macrophages, normalized to wet weight of tissue. n = 3 experiments pooled, three mice/exp. Student’s unpaired t test. ***P < 0.001. (B) qPCR of MACS-enriched CD31+ endothelial cells (ECs) from indicated organs, normalized to brain. n = 4 (brain), 5 (DRG), 2 (kidney, liver, lung). Illustration created with https://BioRender.com. (C) Expression of artery and vein signature genes across mouse DRG endothelial clusters (Avraham et al., 2020): artery (A), capillary (C), vein (V). Tukey’s multiple comparisons test. *P < 0.05, **P < 0.01, ***P < 0.001. (D) Enrichment of DRG vein or artery signature genes in BBB or peripheral endothelial cells (Munji et al., 2019). DRG artery genes are enriched in BBB, whereas DRG vein genes are enriched in peripheral endothelium. (E) Expression of DRG vein or artery signature genes in endothelial cells isolated from indicated organs (Kalucka et al., 2020). DRG artery genes are enriched in brain endothelial cells, and DRG vein genes are enriched in several peripheral endothelial types. (F) CLDN5-GFP expression in entire DRG section from Cldn5GFP/+ mouse, visualizing cropped areas in Fig. 2 H. Scale bar, 100 μm. (G) Immunostaining of PLVAP in entire DRG section, visualizing cropped areas in Fig. 2 I. Scale bar, 100 μm. (H) Whole-mount imaging of native GFP expression in DRG from Cldn5GFP/+ mice, confirming absence of CLDN5 expression in large veins (arrowheads) and venous capillaries. Scale bar, 200 μm. (I) CLDN5 and PLVAP immunostaining in indicated tissues. Outside of the DRG, PLVAP+CLDN5 vessels are only present in epineurial blood vessels. ScN and SpN endoneurial vessels are PLVAPCLDN5+. Scale bar, 100 μm. (J) Artery and vein signature gene expression in human DRG endothelial clusters (Avraham et al., 2022). Tukey’s multiple comparisons test. *P < 0.05, **P < 0.01, ***P < 0.001.
Figure S2.
Figure S2.
Additional analysis of tracer uptake, ultrastructure, and caveolar transcytosis in DRG endothelium. (A) Low-magnification images of Iba1 and CD31 stained DRG sections from mice injected with indicated i.v tracers. All tracers readily accumulate inside macrophages. Images related to analyses in Fig. 3 A and panel B. Scale bar, 50 μm. (B) Uptake of indicated i.v injected tracers in DRG endothelial cells, separated by vessel segments. The following tracers, doses, and circulation times were used: 3 kD dextran-TMR (25 mg/kg, 1 h, n = 4 mice), BSA-A647 (5 mg/kg, 1 h, n = 4 mice), 70 kD dextran-TMR (25 mg/kg, 1 h, n = 9 mice), goat anti rabbit IgG-A488 (4 mg/kg, 4 h, n = 4 mice), 500 kD dextran-FITC (25 mg/kg, 1 h or 24 h, n = 4 mice), 2,000 kD dextran-FITC (25 mg/kg, 24 h, n = 4 mice). Values are mean of individual macrophages, normalized to tissue background. (C) Analysis of endothelial fenestrae (arrowheads) in TEM images from indicated DRG vessel segments. Total images per vessel segment are indicated above each bar. n = 4 mice. Fisher’s exact test. ***P < 0.001. Scale bar, 1 μm. (D) Scanning electron micrograph of luminal surface of DRG v-cap with an apparent scarcity of endothelial fenestrae. Scale bar, 500 nm. (E) Representative TEM images of v-caps from WT and Cav1−/− mice, showing the absence of caveolar vesicles (red arrowhead), but presence of fenestrae (black arrowhead) in Cav1−/− mice. Scale bar, 500 nm. (F) Mfsd2a expression across endothelial cells isolated from indicated organs showing expression restricted to brain and testis (Kalucka et al., 2020). (G) Mfsd2a expression in MACS-enriched CD31+ endothelial cells from indicated organs, normalized to brain. n = 3 (brain), 4 (DRG), 2 (kidney, liver, lung). (H) MFSD2A immunostaining in DRG section, demonstrating that MFSD2A is absent in SpN and DR. Scale bar, 200 μm. (I) CAV1 immunostaining in entire DRG section from WT and Cav1−/− mice, demonstrating antibody specificity. Scale bar, 200 μm. (J) Representative MFSD2A immunostaining in DRG section, visualizing cropped areas in Fig. 3 D. Scale bar, 100 μm. (K) Representative CAV1 immunostaining in DRG section, visualizing cropped areas in Fig. 3 D. Scale bar, 100 μm. A, artery; V, vein.
Figure 2.
Figure 2.
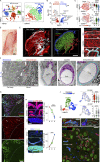
DRG vasculature has dual identity. (A) Reclustering of published scRNA-seq data of 432 DRG endothelial cells from mouse (Avraham et al., 2020), displaying clusters with artery, capillary, and vein identity. (B) Differential gene expression between artery and vein clusters using Venice algorithm. (C) Cldn5 (artery; A) and Plvap (vein; V) expression across clusters. Tukey’s multiple comparisons test. ***P < 0.001. (D) Photomicrograph of undissected L5 DRG from unperfused mouse illustrating blood-filled vasculature. Scale bar, 200 μm. (E) Whole-mount imaging and iDISCO tissue clearing of CD31 and ACTA2 stained lumbar DRG. 3D reconstruction and vessel segment identification using Imaris. Scale bar, 200 and 20 μm (inset). (F) Identification of vessel segments in ultrathin DRG sections by TEM, based on their anatomical localization. Scale bar, 50 μm. (G) Immunolocalization of CLDN5 and PLVAP expression to CD31+ DRG endothelial cells, displaying minimal overlap. Arrows indicate PLVAP/CLDN5 breakpoints. Scale bar, 100 μm. (H and I) (H) CLDN5-GFP (Cldn5GFP/+ mice) and (I) PLVAP expression in DRG vessel segments, normalized to % of max. n = 3 mice. Tukey’s multiple comparisons test. **P < 0.01, ***P < 0.001. Scale bar, 20 μm. C, capillary. (J) Reclustering snRNA-seq data of 777 endothelial nuclei from human DRGs from five donors (Avraham et al., 2022) and the expression of CLDN5 and PLVAP across artery, capillary, and vein clusters. Tukey’s multiple comparisons test. ***P < 0.001. (K) Immunostaining of CLDN5 and PLVAP in human DRG sections. Scale bars, 100 μm.
Figure 3.
Figure 3.
Macrophage monitoring is arteriovenously zonated and requires caveolar vesicles. (A) Machine-learning-based spatial mapping of Iba1+ macrophages to DRG vessel segments and analysis of the uptake of indicated i.v-injected tracers using the DRGQuant algorithm. The following tracers, doses, and circulation times were used: 3 kD dextran-TMR (25 mg/kg, 1 h, n = 4 mice), BSA-A647 (5 mg/kg, 1 h, n = 4 mice), 70 kD dextran-TMR (25 mg/kg, 1 h, n = 9 mice), goat anti rabbit IgG-A488 (4 mg/kg, 4 h, n = 4 mice), 500 kD dextran-FITC (25 mg/kg, 1 h or 24 h, n = 4 mice), 2,000 kD dextran-FITC (25 mg/kg, 24 h, n = 4 mice). Values are the mean of individual macrophages, normalized to tissue background. Scale bar, 100 μm. (B) Machine-learning-based quantifications of endothelial vesicles (<100 nm diameter) in high-resolution TEM images of indicated DRG vessel segments. Data are mean of 50 (artery), 51 (a-cap), 42 (v-cap), and 120 (vein) images from n = 2 mice. Tukey’s multiple comparisons test. *P < 0.05, **P < 0.01, ***P < 0.001. Scale bar, 250 nm. (C) Expression of Cav1 and Mfsd2a mRNA in DRG vessel segments. Tukey’s multiple comparisons test. *P < 0.05, ***P < 0.001. (D) CAV1 and MFSD2A immunostaining in DRG sections and expression across vessel segments normalized to % of max. n = 3 mice. Tukey’s multiple comparisons test. *P < 0.05, **P < 0.01, ***P < 0.001. Scale bars, 25 μm. A, artery; V, vein. (E) Macrophage uptake of i.v injected BSA-A488 (1 mg/ml) and Goat IgG-A647 (1 mg/ml, 2 h circulation) in WT and Cav1−/− mice (n = 4/group). Bar graphs are quantification of uptake in parenchymal and perivascular Iba1+ macrophages. Line-connected graphs are quantifications of perivascular macrophages across endothelial vessel segments. Percentages indicate the reduction in macrophage uptake between WT to Cav1−/− mice at each vessel segment. Multiple unpaired t test with Holm Sidak correction. *P < 0.05. The experiment was performed twice. (F) Confocal image of CD64+ macrophage and CAV1+ DRG capillary. Scale bar, 10 μm. (G) STED-captured Z-stack (left) and one Z-layer (right) of CD64+ macrophage in contact with CAV1+ capillary. Scale bar, 2 μm. (H) TEM image of macrophage-endothelial contact. Scale bar, 2 μm.
Figure 4.
Figure 4.
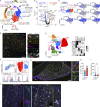
DRG contains two molecularly distinct macrophage populations. (A) scRNA-seq analysis of 2668 CD45+ DRG cells. n = 3 mice. (B) Differential gene expression between CD163 and CD163+ macrophages using Venice algorithm. (C) UMAP of monocyte/macrophage/DC clusters and their expression of key transcripts. (D) Validation of Fcrls and Ccr2 expression in separate subsets of Cx3cr1+ macrophages using RNAscope in DRG sections. Purple arrows indicate Fcrls+Ccr2 cells and turquoise arrows indicate FcrlsCcr2+ cells. Images are representative of n = 3 mice. Scale bar, 50 and 5 μm (inset). (E) UMAP of live, CD45+ DRG cells analyzed by flow cytometry and expression heatmap of selected markers in all myeloid populations. n = 4 mice pooled. The experiment was performed three times. (F) Subclustering of CD64+CX3CR1+ macrophages from flow cytometry data. Histograms of key markers in resulting CD163 and CD163+ macrophage clusters. (G and H) (G) Representative immunostaining and (H) quantification of Iba1+CD163 and Iba1+CD163+ macrophages in DRG parenchyma. n = 12 mice. Scale bar, 100 μm. (I) Center-of-mass distance to nearest CD31+ blood vessel for CD64+CD163 and CD64+CD163+ macrophages. Values are individual macrophages from n = 3 mice. Mann Whitney test. ***P < 0.001. (J) Immunostaining of CCR2 and MRC1 in DRG sections, displaying non-overlapping expression in CD163 and CD163+ macrophages. Scale bar, 50 μm.
Figure S3.
Figure S3.
Additional scRNA-seq and flow cytometry data of DRG immune cells. (A) Epineurial macrophage signature (selected genes from Ydens et al. [2020]) across DRG immune cell types. (B) Ex vivo activation gene signature (25 genes identified in Marsh et al. [2022]) across DRG immune cell types. Induction of gene signature is most apparent in macrophages. (C) Conventional gating strategy to identify major immune cell populations in the UMAP. (D) Expression heatmap of all flow cytometry markers across UMAP clusters.
Figure 5.
Figure 5.
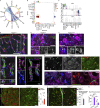
The two DRG macrophage subsets display different turnover by monocytes. (A) Subclustering of DRG monocyte/macrophage clusters from flow cytometry data presented in Fig. 4 E. n = 4 mice pooled. (B) Expression of indicated markers across clusters. (C) Expression heatmap of selected markers in indicated populations. (D) Expression of Retnla and Ear2 (genes expressed in recently infiltrated monocytes, Sanin et al., 2022) within monocyte/macrophage clusters. (E) Immunolocalization of CCR2+ monocytes and CD64+CCR2+ macrophages adjacent to the DRG capsule. Scale bar, 50 μm. (F) Analysis of chimerism in CD45.2 mice 12 wk after whole body irradiation and i.v injection of 5 × 10⁶ CD45.1 bone marrow cells. Frequency of indicated cell populations that are of donor origin (CD45.1+), analyzed by flow cytometry. n = 6 mice, one experiment. Student’s unpaired t test. ***P < 0.001. RPM, red pulp macrophage. KC, Kupffer cell. MG, microglia. (G) CD45.2 mice received irradiation of only the hindlegs followed by i.v injection of 5 × 10⁶ bone marrow cells from CD45.1:Cx3cr1GFP/+ mice. Donor chimerism was assessed by immunostaining in tissue sections, analyzing GFP frequency in Iba1+ parenchymal microglia, Iba1+CD163 or Iba1+CD163+ DRG macrophages at the indicated time points after irradiation. n = 7, 5, 5 mice. One experiment/time point. Multiple unpaired t tests with Holm-Sidak correction. **P < 0.01, ***P < 0.001. (H) Cx3cr1CreER/+R26EYFP/+ mice were given 4 × 2 mg tamoxifen injections i.p and YFP+ frequencies analyzed in indicated cell populations using flow cytometry after 72 h (0 w) or 12 wk (n = 6, 11 mice). Two experiments pooled. Sidak’s multiple comparisons test. **P < 0.01, ***P < 0.001. Mouse illustrations in F–H were created with https://BioRender.com.
Figure S4.
Figure S4.
Additional ontogeny data and response to peripheral inflammation by the two macrophage subsets. Additional analysis of DRG mural cells. (A) Mouse fur at 27 wk after hindleg irradiation. (B) Flow cytometry–based analysis of hindleg-irradiated CD45.1:Cx3cr1GFP/+→ CD45.2 chimeric mice at 33 wk after irradiation. Chimerism was calculated as frequency of GFP+ cells within indicated cell subsets, normalized to blood GFP+ frequency. n = 5 mice. The experiment was performed once. Student’s unpaired t test. ***P < 0.001. (C) Expression of TLF genes (Dick et al., 2022) across monocyte/macrophage/DC clusters in scRNA-seq data from Fig. 4 A. (D) Expression of TLF markers by flow cytometry in indicated cell types using flow cytometry. n = 4 mice pooled. The experiment was performed twice. (E) FOLR2 expression in indicated macrophage subsets. (F) Experiment illustration for macrophage depletion and peripheral LPS challenge. Mice were fed control or PLX3397 chow (290 ppm) and injected i.p with 1 mg/kg LPS or saline. Created with https://BioRender.com. (G) Quantification of ICAM1 expression in CD31+ vessel segments. Two-way ANOVA with Tukey’s multiple comparisons test. n = 5 mice/group. The experiment was performed once. *P < 0.05, ***P < 0.001. Scale bar, 20 μm. A, artery; C, capillary; V, vein. (H) Quantification of endothelial coverage by Iba1+ perivascular macrophages, split into CD163+ and CD163 subsets. Endothelial coverage was additionally analyzed based on which vessel segment macrophages contacted. n = 5 mice/group. The experiment was performed once. Sidak’s multiple comparisons tests. *P < 0.05, ***P < 0.001; ns, not significant. (I) mRNA expression of indicated fibroblast, SMC, and pericyte marker genes in the dataset used for CellChat (Avraham et al., 2020), presented in Fig. 7, A and B. (J) PdgfrbGFP/+ mice label GFP+ACTA2+ SMCs covering arteries and veins. Scale bar, 50 μm.
Figure 6.
Figure 6.
Only CD163+ macrophages monitor the vasculature. (A) Flow cytometry quantification of BSA-A647 (4 mg/kg, 1.5 h) and IgG-A647 (6 mg/kg, 2 h) uptake in indicated organs/cell subsets. Gated on CD11b+Ly6Chi (monocytes), CX3CR1hiCD64low (microglia), and CX3CR1+CD64hi (macrophages). The experiment was performed two (IgG, n = 5 total) or three times (BSA, n = 8 total). Tukey’s multiple comparisons test. ***P < 0.001. (B) Machine-learning (DRGQuant)-based analysis of uptake of BSA-A647 (20 mg/kg, 1 h), goat anti rabbit IgG-A488 (4 mg/kg, 4 h) in CD163Iba1+ and CD163+Iba1+ macrophages without (parenchymal) or with (perivascular) contact with vasculature. Perivascular macrophages were additionally analyzed based on which vessel segment they contacted. Student’s unpaired t test. ***P < 0.001. Scale bar, 25 μm. (C) Experiment schematic of tracer uptake in macrophage depleted mice using the CSF1R antagonist PLX3397 (290 ppm in chow). Created with https://BioRender.com. (D) Uptake of coinjected BSA-A647 (4 mg/kg), 70 kD dextran-TMR (10 mg/kg), and goat anti rabbit IgG-A488 (3 mg/kg) in Iba1+ macrophages 2 h 45 min after i.v injection. Depletion experiment was performed three times, uptake once. Student’s unpaired t test. *P < 0.05, **P < 0.01, ***P < 0.001. ns, not significant. Scale bar, 50 μm. (E) Experiment schematic of tracer uptake in CD163+ macrophage depleted mice using αCD163 or isotype control antibody (2.5 mg/kg, three injections separated by 48 h). Created with https://BioRender.com. (F) Quantification of macrophage subsets and uptake of i.v injected BSA-A488 (4 mg/kg) and goat anti human IgG-A647 (3 mg/kg) 2 h after i.v injection. n = 9, 10 mice. Two experiments pooled. Depletion experiment was performed three times, uptake twice. Student’s unpaired t test. *P < 0.05, **P < 0.01, ***P < 0.001. ns, not significant. Scale bar, 50 μm. (G) Flow cytometry UMAP of CD45+CD11b+Ly6CCD64+CX3CR1+ macrophages after αCD163 mediated depletion (2.5 mg/kg, three injections separated by 48 h). n = 4 (isotype), 3 (αCD163).
Figure 7.
Figure 7.
Pericyte-macrophage interactions via the IL34-CSF1R axis. (A) CellChat analysis of 1,592 naive DRG cells from a publicly available dataset (Avraham et al., 2020). Predicted cell–cell interactions via the IL34-CSF1R axis. (B) Heatmap visualizing communication probability between sender (y-axis) and receiver (x-axis) cells for the IL34-CSF1R axis using CellChat. (C) mRNA expression of indicated genes in the dataset used for CellChat. (D and E) Identification of capillary-wrapping CD13+GFP+p75 pericytes (PC) in PdgfrbGFP mice. Scale bar, 50 μm. (F) Identification of p75+GFP+CD13 fibroblasts (FB) in PdgfraH2GFP mice. Scale bar, 50 μm. (G) Z-stack and 3D rendering of Iba1+ macrophage, CD13+ pericyte, and p75+ fibroblast contacts on CD31+ DRG capillaries. Scale bars, 10 μm. (H) Localization of IL34 staining in GFP+ pericytes in PdgfrbGFP mice but absence from GFP+ fibroblasts in PdgfraH2GFP mice. Scale bars, 25 μm (top) and 10 μm (bottom). (I) IL34 staining in mice fed control or PLX3397 (290 ppm) chow for 7 d n = 5 mice/group. The experiment was performed twice. Student’s unpaired t test. *P < 0.05. Scale bar, 50 μm. (J) Analysis of coverage of CD31+ capillaries by CD13+ pericyte staining in Pdgfbret/ret and littermate Pdgfbret/+ mice. Arrowheads indicate capillaries without pericyte coverage. Student’s unpaired t test. ***P < 0.001. Scale bar, 50 μm. (K) Analysis of contact between CD13+ pericytes and Iba1+CD163+ or Iba1+CD163 macrophage subsets in Pdgfbret/ret and littermate Pdgfbret/+ mice. n = 3 mice/group. Sidak’s multiple comparisons test. **P < 0.01, ***P < 0.001.
Figure 8.
Figure 8.
Perivascular CD163+ macrophages are conserved in human DRGs. (A) UMAP of 2,098 subclustered macrophage nuclei from five human DRG donors (Avraham et al., 2022). (B) Expression of key indicated genes across clusters. (C) Iba1 immunostaining of a large human DRG section visualizing regional differences in macrophage density. Scale bar, 500 μm. (D) Boxed areas in C visualizing the difference in macrophage distribution between neuronal soma-rich and nerve fiber-rich areas. Scale bar, 100 μm. (E) Immunostaining of Iba1+ perineuronal macrophages and FASN+ SGCs. While distinct, both cell types cluster around neuron cell bodies. Scale bar, 25 μm. (F) Immunostaining showing the perineuronal localization of CX3CR1+Iba1+ macrophages and the interstitial localization of Iba1+CD163+MRC1+ macrophages. Scale bars, 50 μm. (G) Immunostaining showing perivascular location of CD163+MRC1+ macrophages. Scale bar, 50 μm. N, neuron.
Figure S5.
Figure S5.
Expression of TLF genes in human DRG macrophages. (A) UMAP of 2,098 subclustered macrophage nuclei from five human DRG donors (Avraham et al., 2022) and expression of TLF markers across clusters. (B) FOLR2 expression by immunostaining localized to Iba1+MRC1+ interstitial macrophages (arrowheads) and absence from Iba1+MRC1 perineuronal macrophages. Scale bar, 50 μm.

References

    1. Ajami, B., Bennett J.L., Krieger C., Tetzlaff W., and Rossi F.M.V.. 2007. Local self-renewal can sustain CNS microglia maintenance and function throughout adult life. Nat. Neurosci. 10:1538–1543. 10.1038/nn2014 - DOI - PubMed
    1. Amato, A.A., and Ropper A.H.. 2020. Sensory ganglionopathy. N. Engl. J. Med. 383:1657–1662. 10.1056/NEJMra2023935 - DOI - PubMed
    1. Andreone, B.J., Chow B.W., Tata A., Lacoste B., Ben-Zvi A., Bullock K., Deik A.A., Ginty D.D., Clish C.B., and Gu C.. 2017. Blood-brain barrier permeability is regulated by lipid transport-dependent suppression of caveolae-mediated transcytosis. Neuron. 94:581–594.e5. 10.1016/j.neuron.2017.03.043 - DOI - PMC - PubMed
    1. Anzil, A.P., Blinzinger K., and Herrlinger H.. 1976. Fenestrated blood capillaries in rat cranio-spinal sensory ganglia. Cell Tissue Res. 167:563–567. 10.1007/BF00215185 - DOI - PubMed
    1. Aran, D., Looney A.P., Liu L., Wu E., Fong V., Hsu A., Chak S., Naikawadi R.P., Wolters P.J., Abate A.R., et al. . 2019. Reference-based analysis of lung single-cell sequencing reveals a transitional profibrotic macrophage. Nat. Immunol. 20:163–172. 10.1038/s41590-018-0276-y - DOI - PMC - PubMed