. 2024 Mar 4;84(5):741-756.
doi: 10.1158/0008-5472.CAN-23-2093.

The Epigenetic Evolution of Glioma Is Determined by the IDH1 Mutation Status and Treatment Regimen

Collaborators, Affiliations

The Epigenetic Evolution of Glioma Is Determined by the IDH1 Mutation Status and Treatment Regimen

Tathiane M Malta et al. Cancer Res. .

Abstract

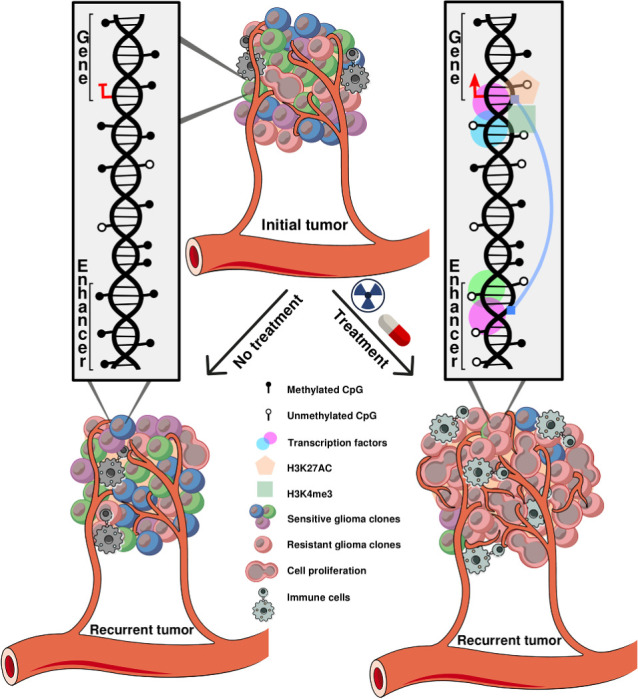
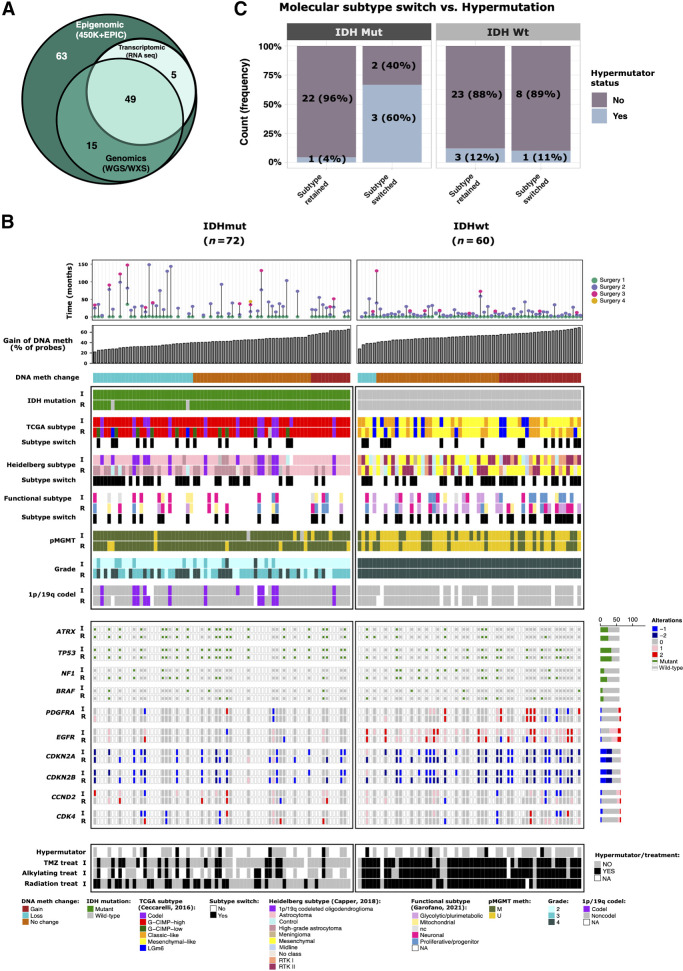
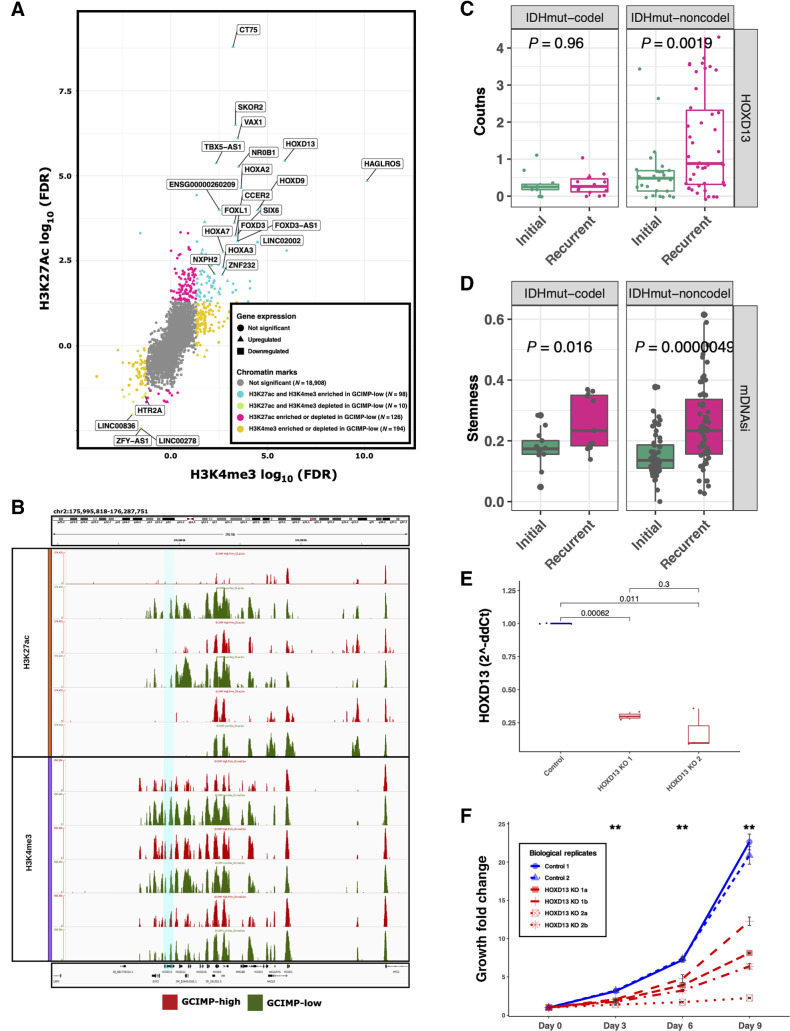
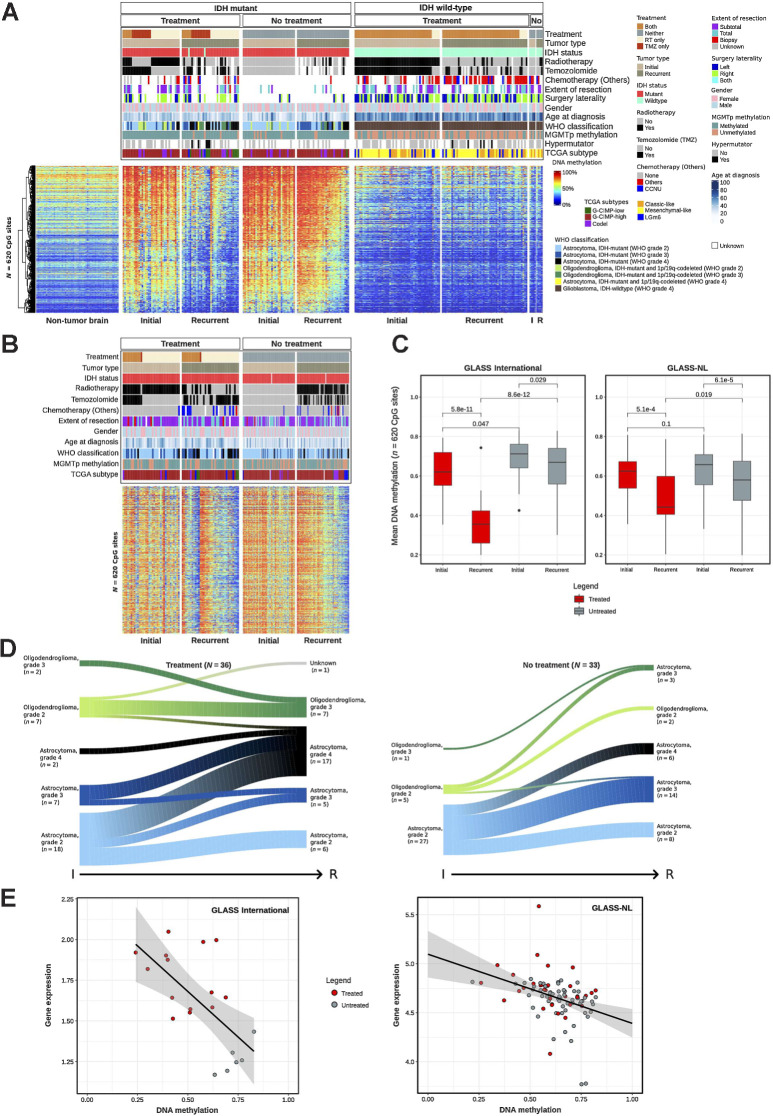
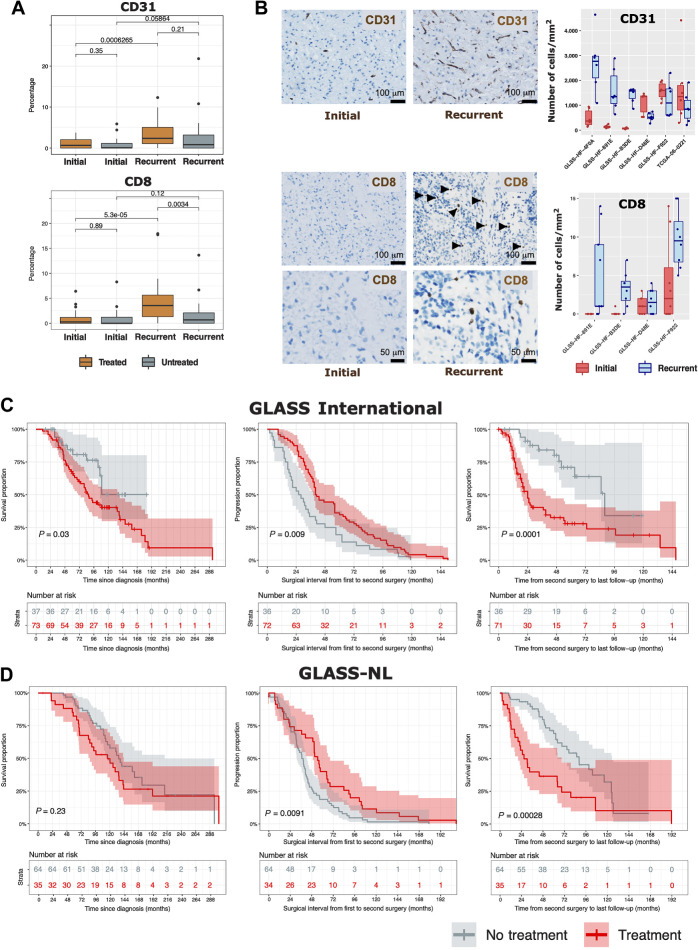
Tumor adaptation or selection is thought to underlie therapy resistance in glioma. To investigate longitudinal epigenetic evolution of gliomas in response to therapeutic pressure, we performed an epigenomic analysis of 132 matched initial and recurrent tumors from patients with IDH-wildtype (IDHwt) and IDH-mutant (IDHmut) glioma. IDHwt gliomas showed a stable epigenome over time with relatively low levels of global methylation. The epigenome of IDHmut gliomas showed initial high levels of genome-wide DNA methylation that was progressively reduced to levels similar to those of IDHwt tumors. Integration of epigenomics, gene expression, and functional genomics identified HOXD13 as a master regulator of IDHmut astrocytoma evolution. Furthermore, relapse of IDHmut tumors was accompanied by histologic progression that was associated with survival, as validated in an independent cohort. Finally, the initial cell composition of the tumor microenvironment varied between IDHwt and IDHmut tumors and changed differentially following treatment, suggesting increased neoangiogenesis and T-cell infiltration upon treatment of IDHmut gliomas. This study provides one of the largest cohorts of paired longitudinal glioma samples with epigenomic, transcriptomic, and genomic profiling and suggests that treatment of IDHmut glioma is associated with epigenomic evolution toward an IDHwt-like phenotype.

Significance: Standard treatments are related to loss of DNA methylation in IDHmut glioma, resulting in epigenetic activation of genes associated with tumor progression and alterations in the microenvironment that resemble treatment-naïve IDHwt glioma.


Figures

None
Graphical abstract
Figure 1. Epigenomic evolution of matched initial and recurrent gliomas. A, Venn diagram of number of patients who had DNA methylation, genomic (WGS/WXS), and/or RNA sequencing profiling. B, Clinical and molecular overview of matched initial and first recurrent DNA methylation cohort. Each column represents a single patient (N = 132) at two separate time points grouped by IDH status and ordered by increase of gain of DNA methylation at recurrent tumor from left to right. The gain of DNA methylation represents the percentage of probes that showed an increase of DNA methylation at recurrence. Top plot shows the surgical interval of each patient. C, Frequency of patients with hypermutator tumors that switched or retained molecular subtype at recurrence. Patients are distinguished by IDH status.
Figure 1.
Epigenomic evolution of matched initial and recurrent gliomas. A, Venn diagram of number of patients who had DNA methylation, genomic (WGS/WXS), and/or RNA sequencing profiling. B, Clinical and molecular overview of matched initial and first recurrent DNA methylation cohort. Each column represents a single patient (N = 132) at two separate time points grouped by IDH status and ordered by increase of gain of DNA methylation at recurrent tumor from left to right. The gain of DNA methylation represents the percentage of probes that showed an increase of DNA methylation at recurrence. Top plot shows the surgical interval of each patient. C, Frequency of patients with hypermutator tumors that switched or retained molecular subtype at recurrence. Patients are distinguished by IDH status.
Figure 2. Master regulators associated with IDHmut glioma recurrence/progression. A, Starburst plot of all H3K27ac and H3K4me3 peaks overlapping known transcription start sites. Significant gains or losses of H3K27ac (y-axis) and H3K4me3 (x-axis) are highlighted. Each dot indicates a gene and the shape indicates the expression difference between GCIMP-low versus GCIMP-high. Triangles, upregulated genes; squares, downregulated genes. If a gene is enriched for both H3K27ac and H3K4me3, this implies active TSS and the associated gene expression is defined as upregulated (turquoise, top right corner). If a gene is depleted for both H3K4me3 and H3K27ac, this implies weak or quiescent expression of the associated gene (green, bottom left corner). Gray, not significant gene promoter enrichment. Only the most significant upregulated genes are labeled in this plot. B, Genome browser representation focused on the HOXD family. The region related to HOXD13 gene (hg18.chr2: 176,092,721–176,095,944) is highlighted in turquoise. HOXD13 is more enriched by the H3K27ac and H3K4me3 peaks in the GCIMP-Low (recurrent) samples (n = 3) than in their corresponding GCIMP-High (primary) pairs (n = 3), top and bottom graph, respectively. C, HOXD13 expression level by RNA sequencing of GLASS IDHmut samples stratified by initial/recurrent and codel status (N = 11 codels and 26 noncodels patients). Each box represents quartiles, and the center line represents the median of each group. The whiskers represent absolute range. D, Stemness activity in the GLASS IDHmut samples stratified by initial/recurrent and codel status. Each box represents quartiles, and the center line represents the median of each group. The whiskers represent absolute range. E, Quantification analysis of the relative HOXD13 expression levels (2-ΔΔCt) between samples: control, n = 2; HOXD13 1 sgRNA HOXD13–07, n = 2; HOXD13 2 sgRNA HOXD13–55, n = 2 biological replicates. The boxplots represent the analysis of three technical replicates for each sample. F, Proliferation growth curve over 9 days of analysis (control, N = 2; HOXD13 1 sgRNA HOXD13–07, N = 2; HOXD13 2 sgRNA HOXD13–55, N = 2 biological replicates). **, P < 0.01
Figure 2.
Master regulators associated with IDHmut glioma recurrence/progression. A, Starburst plot of all H3K27ac and H3K4me3 peaks overlapping known transcription start sites. Significant gains or losses of H3K27ac (y-axis) and H3K4me3 (x-axis) are highlighted. Each dot indicates a gene and the shape indicates the expression difference between GCIMP-low versus GCIMP-high. Triangles, upregulated genes; squares, downregulated genes. If a gene is enriched for both H3K27ac and H3K4me3, this implies active TSS and the associated gene expression is defined as upregulated (turquoise, top right corner). If a gene is depleted for both H3K4me3 and H3K27ac, this implies weak or quiescent expression of the associated gene (green, bottom left corner). Gray, not significant gene promoter enrichment. Only the most significant upregulated genes are labeled in this plot. B, Genome browser representation focused on the HOXD family. The region related to HOXD13 gene (hg18.chr2: 176,092,721–176,095,944) is highlighted in turquoise. HOXD13 is more enriched by the H3K27ac and H3K4me3 peaks in the GCIMP-Low (recurrent) samples (n = 3) than in their corresponding GCIMP-High (primary) pairs (n = 3), top and bottom graph, respectively. C, HOXD13 expression level by RNA sequencing of GLASS IDHmut samples stratified by initial/recurrent and codel status (N = 11 codels and 26 noncodels patients). Each box represents quartiles, and the center line represents the median of each group. The whiskers represent absolute range. D, Stemness activity in the GLASS IDHmut samples stratified by initial/recurrent and codel status. Each box represents quartiles, and the center line represents the median of each group. The whiskers represent absolute range. E, Quantification analysis of the relative HOXD13 expression levels (2-ΔΔCt) between samples: control, n = 2; HOXD13 1 sgRNA HOXD13–07, n = 2; HOXD13 2 sgRNA HOXD13–55, n = 2 biological replicates. The boxplots represent the analysis of three technical replicates for each sample. F, Proliferation growth curve over 9 days of analysis (control, N = 2; HOXD13 1 sgRNA HOXD13–07, N = 2; HOXD13 2 sgRNA HOXD13–55, N = 2 biological replicates). **, P < 0.01
Figure 3. DNA methylation loss associates with malignant transformation of glioma after standard treatment. A, Heat map of DNA methylation data. Hierarchical clustering analysis of 620 CpG probes that are associated with different treatment strategies in IDHmut paired glioma samples. Columns represent glioma samples; rows represent CpG probes. Samples were stratified and clustered on the basis of IDH mutation status and initial/recurrent status and CpGs were ordered using hierarchical clustering methods. Nonneoplastic brain samples are represented on the left of the heat map. DNA methylation β values range from 0 (low) to 1 (high). Additional tracks are included at the top of the heat maps to identify each sample membership within separate cluster analysis. B, Heat map of DNA methylation data in the validation cohort - GLASS-NL, showing the same 620 CpG probes of A. C, Boxplot of the average DNA methylation β value of the 620 CpG probes from A, in IDHmut samples. Samples are stratified by initial/recurrent status and by treated/nontreated status. Left, GLASS-International samples; right, GLASS-NL samples. Each box represents quartiles, and the center line represents the median of each group. The whiskers represent absolute range. D, Evolution of tumor histology (2021 WHO classification) from initial to recurrent samples after treatment compared with nontreated gliomas. E, Scatter plot of mean DNA methylation of CpG probes and mean gene expression of the epigenetically regulated genes after treatment (Supplementary Table S5). Each dot is a sample.
Figure 3.
DNA methylation loss associates with malignant transformation of glioma after standard treatment. A, Heat map of DNA methylation data. Hierarchical clustering analysis of 620 CpG probes that are associated with different treatment strategies in IDHmut paired glioma samples. Columns represent glioma samples; rows represent CpG probes. Samples were stratified and clustered on the basis of IDH mutation status and initial/recurrent status and CpGs were ordered using hierarchical clustering methods. Nonneoplastic brain samples are represented on the left of the heat map. DNA methylation β values range from 0 (low) to 1 (high). Additional tracks are included at the top of the heat maps to identify each sample membership within separate cluster analysis. B, Heat map of DNA methylation data in the validation cohort - GLASS-NL, showing the same 620 CpG probes of A. C, Boxplot of the average DNA methylation β value of the 620 CpG probes from A, in IDHmut samples. Samples are stratified by initial/recurrent status and by treated/nontreated status. Left, GLASS-International samples; right, GLASS-NL samples. Each box represents quartiles, and the center line represents the median of each group. The whiskers represent absolute range. D, Evolution of tumor histology (2021 WHO classification) from initial to recurrent samples after treatment compared with nontreated gliomas. E, Scatter plot of mean DNA methylation of CpG probes and mean gene expression of the epigenetically regulated genes after treatment (Supplementary Table S5). Each dot is a sample.
Figure 4. Tumor microenvironment and clinical implications of treatment in IDH-mutant gliomas. A, CD31 and CD8 proportions (range scaled from 0 to 100%) in samples originating from IDHmut matched initial and recurrent tumors in treated and nontreated patients. Each box in A and B represents quartiles, and the center line represents the median of each group. The whiskers represent absolute range. B, Illustrative immunohistochemical stainings for two marker proteins (CD31 and CD8) in an individual patient showing change of levels of tumor-infiltrating immune cells between initial (left) and recurrent (right) tumors. CD8 stainings are shown in two different magnifications. Boxplots represent the number of CD31- (top) and CD8-positive cells (bottom) counted per area for individual patients. C and D, Overall survival and surgical interval analysis of IDHmut gliomas for the GLASS International (C) and GLASS-NL (D) cohorts.
Figure 4.
Tumor microenvironment and clinical implications of treatment in IDH-mutant gliomas. A, CD31 and CD8 proportions (range scaled from 0 to 100%) in samples originating from IDHmut matched initial and recurrent tumors in treated and nontreated patients. Each box in A and B represents quartiles, and the center line represents the median of each group. The whiskers represent absolute range. B, Illustrative immunohistochemical stainings for two marker proteins (CD31 and CD8) in an individual patient showing change of levels of tumor-infiltrating immune cells between initial (left) and recurrent (right) tumors. CD8 stainings are shown in two different magnifications. Boxplots represent the number of CD31- (top) and CD8-positive cells (bottom) counted per area for individual patients. C and D, Overall survival and surgical interval analysis of IDHmut gliomas for the GLASS International (C) and GLASS-NL (D) cohorts.

References

    1. Malta TM, de Souza CF, Sabedot TS, Silva TC, Mosella MS, Kalkanis SN, et al. . Glioma CpG island methylator phenotype (G-CIMP): biological and clinical implications. Neuro Oncol 2018;20:608–20. - PMC - PubMed
    1. Weller M, van den Bent M, Preusser M, Le Rhun E, Tonn JC, Minniti G, et al. . EANO guidelines on the diagnosis and treatment of diffuse gliomas of adulthood. Nat Rev Clin Oncol 2021;18:170–86. - PMC - PubMed
    1. Louis DN, Perry A, Reifenberger G, von Deimling A, Figarella-Branger D, Cavenee WK, et al. . The 2016 world health organization classification of tumors of the central nervous system: a summary. Acta Neuropathol 2016;131:803–20. - PubMed
    1. Louis DN, Perry A, Wesseling P, Brat DJ, Cree IA, Figarella-Branger D, et al. . The 2021 WHO classification of tumors of the central nervous system: a summary. Neuro Oncol 2021;23:1231–51. - PMC - PubMed
    1. Shirahata M, Ono T, Stichel D, Schrimpf D, Reuss DE, Sahm F, et al. . Novel, improved grading system(s) for IDH-mutant astrocytic gliomas. Acta Neuropathol 2018;136:153–66. - PubMed

Publication types

Substances