. 2023 Dec;131(12):127015.
doi: 10.1289/EHP12831. Epub 2023 Dec 20.

Racial and Ethnic Disparities in Phthalate Exposure and Preterm Birth: A Pooled Study of Sixteen U.S. Cohorts

Affiliations

Racial and Ethnic Disparities in Phthalate Exposure and Preterm Birth: A Pooled Study of Sixteen U.S. Cohorts

Barrett M Welch et al. Environ Health Perspect. 2023 Dec.

Abstract

Background: Phthalate exposures are ubiquitous during pregnancy and may contribute to racial and ethnic disparities in preterm birth.

Objectives: We investigated race and ethnicity in the relationship between biomarkers of phthalate exposure and preterm birth by examining: a) how hypothetical reductions in racial and ethnic disparities in phthalate metabolites might reduce the probability of preterm birth; and b) exposure-response models stratified by race and ethnicity.

Methods: We pooled individual-level data on 6,045 pregnancies from 16 U.S. cohorts. We investigated covariate-adjusted differences in nine urinary phthalate metabolite concentrations by race and ethnicity [non-Hispanic White (White, 43%), non-Hispanic Black (Black, 13%), Hispanic/Latina (38%), and Asian/Pacific Islander (3%)]. Using g-computation, we estimated changes in the probability of preterm birth under hypothetical interventions to eliminate disparities in levels of urinary phthalate metabolites by proportionally lowering average concentrations in Black and Hispanic/Latina participants to be approximately equal to the averages in White participants. We also used race and ethnicity-stratified logistic regression to characterize associations between phthalate metabolites and preterm birth.

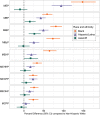
Results: In comparison with concentrations among White participants, adjusted mean phthalate metabolite concentrations were consistently higher among Black and Hispanic/Latina participants by 23%-148% and 4%-94%, respectively. Asian/Pacific Islander participants had metabolite levels that were similar to those of White participants. Hypothetical interventions to reduce disparities in metabolite mixtures were associated with lower probabilities of preterm birth for Black [13% relative reduction; 95% confidence interval (CI): -34%, 8.6%] and Hispanic/Latina (9% relative reduction; 95% CI: -19%, 0.8%) participants. Odds ratios for preterm birth in association with phthalate metabolites demonstrated heterogeneity by race and ethnicity for two individual metabolites (mono-n-butyl and monoisobutyl phthalate), with positive associations that were larger in magnitude observed among Black or Hispanic/Latina participants.

Conclusions: Phthalate metabolite concentrations differed substantially by race and ethnicity. Our results show hypothetical interventions to reduce population-level racial and ethnic disparities in biomarkers of phthalate exposure could potentially reduce the probability of preterm birth. https://doi.org/10.1289/EHP12831.


Figures

Figure 1 is a set of two area graphs, plotting intervention group and Reference group (y-axis) across exposure biomarker (phthalate metabolite) concentration (x-axis) for After hypothetical intervention and before hypothetical intervention.
Figure 1.
Visual representation of the hypothetical interventions applied to equitably reduce urinary phthalate metabolite concentrations. The figure displays simulated distributions on the natural log scale for a single phthalate metabolite among an intervention and reference group. The hypothetical intervention applies a proportional reduction to exposure among all members of the intervention group to make the adjusted geometric mean of the exposure biomarker (phthalate metabolite) concentration approximately equal to that of the reference group. Consequently, the hypothetical intervention shifts but does not change the shape of the distribution of the exposure in the intervention group, as shown by the “before” and “after” intervention distributions. Interventions were applied to all metabolites simultaneously in g-computation models.
Figure 2 is a stacked bar graph, plotting Participants (number), ranging from 0 to 900 in increments of 300 (y-axis) across Puerto Rico Testsite for Exploring Contamination Threats, The Infant Development and the Environment Study, Lifecodes, healthy start, Center for the Health Assessment of Mothers and Children of Salinas, Health Outcomes and Measures of the Environment Study, Environment and Reproductive Health Study, Children’s Environmental Health Study at the Mount Sinai School of Medicine, Study for Future Families, Reproductive Development Study, Harvard Epigenetic Birth Cohort, Markers of Autism Risk in Babies-Learning Early Signs, The North Carolina Early Pregnancy Study, Michigan Mother-Infant Pairs Project, and Rutgers University (x-axis) for race and ethnicity, white, black, Hispanic or Latina, Asian or Pacific Islander, and other.
Figure 2.
Distributions of participant race and ethnicity within each of the 16 studies included in the Pooled Study of Phthalate Exposure and Preterm Birth. Each racial and ethnic category represents a composite measure to maximize sample size and consistency, including non-Hispanic White (White: Caucasian, White), non-Hispanic Black (Black: African American, Black), Hispanic/Latina (Hispanic, Latino, Latin American indigenous heritage), Asian/Pacific Islander (Asian, PI, Native Hawaiian, South Asian), and Other races (Native American, Alaskan Native, >1 racial identity, or “Other”). Values for sample size and proportions are provided in Table 1. Note: CCCEH, Columbia Center for Children’s Environmental Health; CHAMACOS, Center for the Health Assessment of Mothers and Children of Salinas; EARTH, Environment and Reproductive Health Study; EPS, The North Carolina Early Pregnancy Study; Healthy Start, Healthy Start Study; HEBC, Harvard Epigenetic Birth Cohort; HOME, Health Outcomes and Measures of the Environment Study; MARBLES, Markers of Autism Risk in Babies-Learning Early Signs; MMIP, Michigan Mother-Infant Pairs Project; MSSM, Children’s Environmental Health Study at the Mount Sinai School of Medicine; PI, Pacific Islander; PROTECT, Puerto Rico Testsite for Exploring Contamination Threats; RDS, Reproductive Development Study; Rutgers, Rutgers University; SFF, Study for Future Families; TIDES, The Infant Development and the Environment Study.
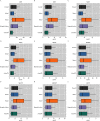
Figures 3(A) to (I) are horizontal boxplots, titled monoethyl phthalate; mono-n-butyl phthalate; mono-isobutyl phthalate; monobenzyl phthalate; mono(2-ethylhexyl) phthalate; mono(2-ethyl-5-hydroxyhexyl) phthalate; mono(2-ethyl-5-carboxypentyl) phthalate; mono(2-ethyl-5-oxohexyl) phthalate; and mono(3-carboxypropyl) phthalate, plotting Asian or Pacific Islander, Hispanic or Latina, Black, White, and Overall (y-axis) across nanogram per milliliter, ranging from 0 to 600 in increments of 200; 0 to 80 in increments of 20; 0 to 20 in increments of 10; 0 to 40 in increments of 10; 0 to 15 in increments of 5; 0 to 50 in increments of 10; 0 to 75 in increments of 25; 0 to 40 in increments of 10; and 2 to 6 in increments of 2 (x-axis), respectively.
Figure 3.
Boxplot distributions of pregnancy-averaged urinary phthalate metabolite concentrations in the Pooled Phthalate and Preterm Birth Study, overall and by race and ethnicity. Concentrations were standardized by urine dilution. Each box shows the 25th, 50th, and 75th percentiles. The upper whisker represents 1.5 times the 75th percentile, whereas the lower whisker represents 0.5 times the 25th percentile, stopping at the limit of detection. Values above or below whiskers not shown. Plotted values and sample sizes are displayed in Table S4. The range of LOD and proportion of samples below LOD are displayed in Table S2. If measures were under the LOD and no instrument-read values were available, values were multiply imputed. Phthalates metabolites are: MEP, MBP, MiBP, MBzP, MEHP, MEHHP, MECPP, MEOHP, and MCPP. Note: LOD, limit of detection; MBP, mono-n-butyl phthalate; MBzP, monobenzyl phthalate; MCPP, mono(3-carboxypropyl) phthalate; MECPP, mono(2-ethyl-5-carboxypentyl) phthalate; MEHHP, mono(2-ethyl-5-hydroxyhexyl) phthalate; MEHP, mono(2-ethylhexyl) phthalate; MEOHP, mono(2-ethyl-5-oxohexyl) phthalate; MEP, monoethyl phthalate; MiBP, monoisobutyl phthalate; PI, Pacific Islander.
Figure 4 is a forest plot, plotting monoethyl phthalate; mono-n-butyl phthalate; mono-isobutyl phthalate; monobenzyl phthalate; mono(2-ethylhexyl) phthalate; mono(2-ethyl-5-hydroxyhexyl) phthalate; mono(2-ethyl-5-carboxypentyl) phthalate; mono(2-ethyl-5-oxohexyl) phthalate; and mono(3-carboxypropyl) phthalate (y-axis) across percent difference (95 percent confidence intervals) compared to non-Hispanic White, ranging from 0 to 150 in increments of 50 (x-axis) for Race and ethnicity, including Black, Hispanic or Latina, and Asian or Pacific Islander.
Figure 4.
Adjusted percent differences in pregnancy-averaged urinary phthalate metabolite concentrations in the Pooled Phthalate and Preterm Birth Study for non-Hispanic Black (Black), Hispanic/Latina, or Asian/PI participants in comparison with non-Hispanic White participants. Estimates represent the percent difference and 95% CIs in adjusted geometric means of urinary phthalate metabolite concentrations. Values were estimated by multiple linear regression and adjusted for maternal age, education, prepregnancy BMI, delivery year, and study. Concentrations were corrected for urine dilution. Plotted values are provided in Table S3. Phthalates metabolites are: MEP, MBP, MiBP, MBzP, MEHP, MEHHP, MECPP, MEOHP, and MCPP. Note: BMI, body mass index; CI, confidence interval; MBP, mono-n-butyl phthalate; MBzP, monobenzyl phthalate; MCPP, mono(3-carboxypropyl) phthalate; MECPP, mono(2-ethyl-5-carboxypentyl) phthalate; MEHHP, mono(2-ethyl-5-hydroxyhexyl) phthalate; MEHP, mono(2-ethylhexyl) phthalate; MEOHP, mono(2-ethyl-5-oxohexyl) phthalate; MEP, monoethyl phthalate; MiBP, monoisobutyl phthalate; PI, Pacific Islander.
Figure 5 is a forest plot, plotting Hispanic or Latina, including Before intervention and After intervention; Non-Hispanic Black, including Before intervention and After intervention; and Non-Hispanic White, including No intervention (y-axis) across Number of preterm births per 1000 live births (95 per confidence intervals), ranging from 75 to 125 in increments of 25 (x-axis) for difference in preterm births per 1000 live births after hypothetical intervention, including count and percent.
Figure 5.
Preterm births per 1,000 live births before and after a hypothetical intervention to reduce concentrations of all urinary phthalate metabolites to the distributions observed among non-Hispanic White participants in the Pooled Study of Phthalate Exposure and Preterm Birth. Predicted probability of preterm birth without an intervention was applied to Non-Hispanic White participants because this population had the lowest adjusted geometric mean concentrations of each metabolite. Results were estimated from g-computation following multivariable logistic regression stratified by race and ethnicity and adjusted for maternal age, education, prepregnancy BMI, delivery year, and study. Point estimates and 95% CIs are provided in Table S6. Note: BMI, body mass index; CI, confidence interval.
Figure 6 is a forest plot, plotting monoethyl phthalate; mono-n-butyl phthalate; mono-isobutyl phthalate; monobenzyl phthalate; mono(2-ethylhexyl) phthalate; mono(2-ethyl-5-hydroxyhexyl) phthalate; mono(2-ethyl-5-carboxypentyl) phthalate; mono(2-ethyl-5-oxohexyl) phthalate; and mono(3-carboxypropyl) phthalate (y-axis) across Odds ratio(95 percent confidence intervals), ranging from 0.6 to 3 in increments of 0.6 (x-axis) for White, Black, and Hispanic or Latina.
Figure 6.
Associations between urinary phthalate metabolites and preterm birth in models stratified by race and ethnicity in the Pooled Phthalate and Preterm Birth Study. Odds ratios and 95% CI represent estimated odds of preterm birth in comparison with term birth per overall IQR increase in each phthalate metabolite. Associations were estimated by multiple logistic regression models stratified by race and ethnicity. All models were adjusted for study, maternal age, education, prepregnancy BMI, and delivery year. An asterisk (*) indicates p<0.10 from augmented Wald tests, which compared nested models with and without an interaction term between phthalate metabolite and race and ethnicity. Point estimates, 95% CI, and Wald tests are provided in Table S7. Phthalates metabolites and IQRs in ng/mL are: MEP, 168.2; MBP, 21.4; MiBP, 8.6; MBzP, 11.0; MEHP, 5.0; MEHHP, 17.3; MECPP, 26.9; MEOHP, 12.4; and MCPP, 2.5. Note: CI, confidence interval; IQR, interquartile range; MBP, mono-n-butyl phthalate; MBzP, monobenzyl phthalate; MCPP, mono(3-carboxypropyl) phthalate; MECPP, mono(2-ethyl-5-carboxypentyl) phthalate; MEHHP, mono(2-ethyl-5-hydroxyhexyl) phthalate; MEHP, mono(2-ethylhexyl) phthalate; MEOHP, mono(2-ethyl-5-oxohexyl) phthalate; MEP, monoethyl phthalate; MiBP, monoisobutyl phthalate.

References

    1. Smid MC, Lee JH, Grant JH, Miles G, Stoddard GJ, Chapman DA, et al. . 2017. Maternal race and intergenerational preterm birth recurrence. Am J Obstet Gynecol 217(4):480.e1–480.e9, PMID: , 10.1016/j.ajog.2017.05.051. - DOI - PubMed
    1. National Center for Health Statistics. 2022. Births: Provisional Data for 2021. Hyattsville, MD: National Center for Health Statistics.
    1. 'Driscoll AO, Hamilton BE, Valenzuela CP, Martin JA. Quarterly Provisional Estimates for Selected Birth Indicators, Quarter 1, 2020–Quarter 1, 2022. https://www.cdc.gov/nchs/nvss/vsrr/natality-dashboard.htm [accessed 1 November 2022].
    1. Braveman P, Dominguez TP, Burke W, Dolan SM, Stevenson DK, Jackson FM, et al. . 2021. Explaining the Black-White disparity in preterm birth: a consensus statement from a multi-disciplinary scientific work group convened by the March of Dimes. Front Reprod Health 3:684207, PMID: , 10.3389/frph.2021.684207. - DOI - PMC - PubMed
    1. Mendez DD, Hogan VK, Culhane J. 2011. Institutional racism and pregnancy health: using home mortgage disclosure act data to develop an index for mortgage discrimination at the community level. Public Health Rep 126 Suppl 3(suppl 3):102–114, PMID: , 10.1177/00333549111260S315. - DOI - PMC - PubMed

Publication types

Grants and funding