. 2024 Jan 23;43(1):113608.
doi: 10.1016/j.celrep.2023.113608. Epub 2023 Dec 20.

Non-canonical Hedgehog signaling mediates profibrotic hematopoiesis-stroma crosstalk in myeloproliferative neoplasms

Affiliations

Non-canonical Hedgehog signaling mediates profibrotic hematopoiesis-stroma crosstalk in myeloproliferative neoplasms

Jessica E Pritchard et al. Cell Rep. .

Abstract

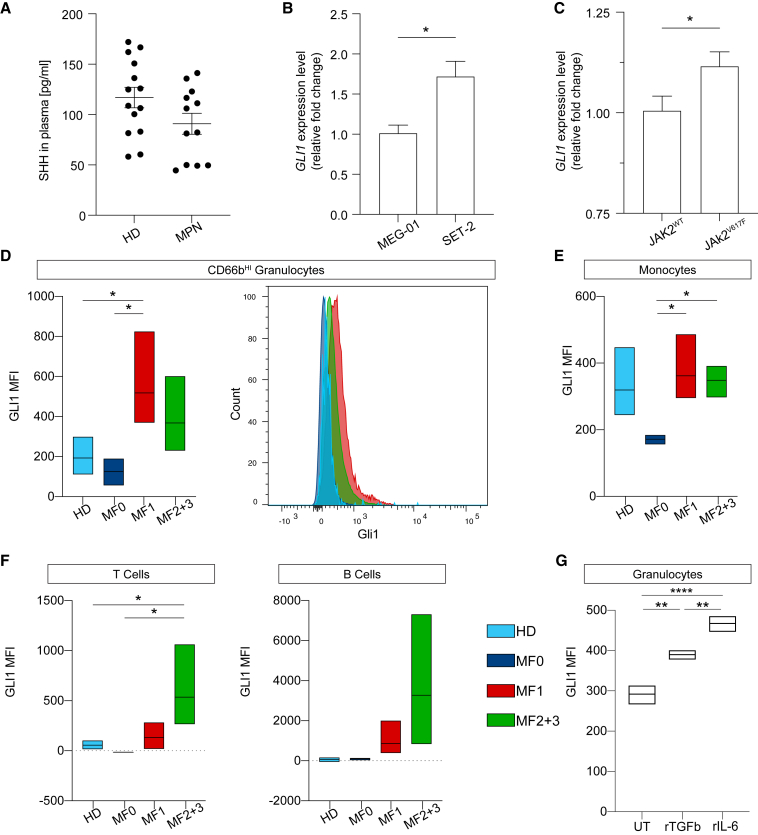
The role of hematopoietic Hedgehog signaling in myeloproliferative neoplasms (MPNs) remains incompletely understood despite data suggesting that Hedgehog (Hh) pathway inhibitors have therapeutic activity in patients. We aim to systematically interrogate the role of canonical vs. non-canonical Hh signaling in MPNs. We show that Gli1 protein levels in patient peripheral blood mononuclear cells (PBMCs) mark fibrotic progression and that, in murine MPN models, absence of hematopoietic Gli1, but not Gli2 or Smo, significantly reduces MPN phenotype and fibrosis, indicating that GLI1 in the MPN clone can be activated in a non-canonical fashion. Additionally, we establish that hematopoietic Gli1 has a significant effect on stromal cells, mediated through a druggable MIF-CD74 axis. These data highlight the complex interplay between alterations in the MPN clone and activation of stromal cells and indicate that Gli1 represents a promising therapeutic target in MPNs, particularly that Hh signaling is dispensable for normal hematopoiesis.

Keywords: CP: Stem cell research; Gli1; Hedgehog signaling; MIF; bone marrow fibrosis; cellular crosstalk; hematopoietic stem cells; mesenchymal stromal cells; myeloproliferative neoplasms; single-cell RNA sequencing; therapeutic target.


Conflict of interest statement

Declaration of interests N.B. is employed by Prelude Therapeutics. S.K. received research grants from Geron, Janssen, AOP Pharma, and Novartis; received consulting fees from Pfizer, Incyte, Ariad, Novartis, AOP Pharma, Bristol Myers Squibb, Celgene, Geron, Janssen, CTI BioPharma, Roche, Bayer, PharmaEssentia, Sierra Oncology, Imago Biosciences, and GSK; payment or honoraria from Novartis, BMS/Celgene, and Pfizer; received travel/accommodation support from Alexion, Novartis, Bristol Myers Squibb, Incyte, AOP Pharma, CTI BioPharma, Pfizer, Celgene, Janssen, Geron, Roche, AbbVie, Sierra Oncology, and Karthos; and participated on advisory boards for Pfizer, Incyte, Ariad, Novartis, AOP Pharma, BMS, Celgene, Geron, Janssen, CTI BioPharma, Roche, Bayer, Sierra Oncology, PharmaEssentia, Imago Biosciences, and GSK. R.L.L. is on the supervisory board of QIAGEN and is a scientific advisor to Imago, Mission Bio, Zentalis, Ajax, Auron, Prelude, C4 Therapeutics, and Isoplexis; receives research support from Ajax, Zentalis, and Abbvie; consulted for Incyte, Janssen, and Astra Zeneca; and received honoraria from Astra Zeneca for invited lectures. R.K. has grants from Travere Therapeutics, Galapagos, Chugai, and Novo Nordisk and is a consultant for Bayer, Pfizer, Novo Nordisk, and Gruenenthal. I.G.C. has a grant from Illumina. R.K. and R.K.S. are founders and shareholders of Sequantrix GmbH. N.F. is employed by Sequantrix GmbH.

Figures

None
Graphical abstract
Figure 1
Figure 1
SHH levels remain normal in patients with MPNs, while GLI1 RNA and protein level increases are linked to the JAK2V617F mutation (A) Plasma from patients with MPNs (n = 12, IDs MPN1–MPN12) and healthy donors (HDs) was isolated, and SHH protein levels were determined by ELISA. (B) GLI1 expression in megakaryocytic cell lines was quantified with qPCR relative to GAPDH, and the JAK2V617F-containing SET2 cell line was normalized to the JAK2WT MEG-01 cell line (n = 3). (C) GLI1 expression in undifferentiated patient-derived iPSC lines was quantified with qPCR relative to GAPDH, normalized to respective JAK2WT clones (n = 3). (D) PBMCs isolated from patients with MPNs compared with HD samples (HDs, n = 4, n = 5; MF0, n = 3; MF1, n = 4; MF2 and MF3, n = 3, IDs MPN13–MPN22). Shown are MFI quantification of GLI1 levels in CD66bHI granulocytes per group normalized to fluorescence minus one (FMO) controls and a representative GLI1 histogram, with count normalized to mode. (E and F) MFI quantification of GLI1 levels per group normalized to FMO controls in CD88+CD89+HLADR+ monocytes (E), CD3+ T cells, and CD19+ B cells (F). (G) MFI quantification of GLI1 levels in CD66b+ granulocytes after PBMCs from HDs (n = 3) were stimulated with 10 ng/mL rTGFb or 50 ng/mL rIL-6 for 72 h, normalized to FMO controls. Bar chart data are shown as mean ± SEM with unpaired Student’s t test. Boxplot data are shown as minimum (min) to maximum (max) with line at mean, one-way ANOVA followed by Tukey’s post hoc test. p < 0.05, ∗∗ = p < 0.01, ∗∗∗∗ = p < 0.0001. See also Figure S1 and Table S1.
Figure 2
Figure 2
Loss of Gli1 in HSPCs reduces BMF (A) C57BL/6 mice received lethal irradiation followed by WT or Gli1−/− cKit+ HSPCs transduced with Jak2V617F or WT control retroviral vectors (n = 5/group). Mice were sacrificed at 112 days after transplantation. (B) Hgb, PLT, and WBC counts from PB over the course of the experiment. Mean ± SEM, two-way ANOVA with Geisser-Greenhouse correction followed by Tukey’s post hoc test; significance for values at sacrifice is indicated. (C) FACS quantification of the long-term hematopoietic stem cell (LT HSC; Lin−-Sca1+cKit+ CD48CD150+) population as a percentage of the LinSca1+cKit+ (LSK) fraction in BM. (D) FACS quantification of GFP+ LT HSC population as a percentage of all single cells (SCs) in the BM. (E) Representative images of H&E staining. Scale bar, 60 μm. (F) Quantification of megakaryocyte number and area in BM from H&E staining of the femur. (G) Weight of the spleen at sacrifice as a percentage of total body weight. (H) Quantification of myelofibrosis grade based on reticulin staining of the femur. (I) Representative images of reticulin staining. Scale bar, 200 μm. (J) Representative images of Sirius red/fast green staining of the femur. Scale bar, 60 μm. (K) Quantification of Sirius red staining as a percentage of total area from Sirius red/fast green staining of the femur. Bar chart data are shown as mean ± SEM, one-way ANOVA followed by Tukey’s post hoc test. p < 0.05, ∗∗p < 0.01,∗∗∗ = p < 0.001,∗∗∗∗p < 0.0001. See also Figure S2.
Figure 3
Figure 3
Loss of Gli2 or Smo in HSPCs does not reduce MPN or fibrotic phenotype C57BL/6 recipient mice received lethal irradiation followed by WT, Gli2−/−, or Smo−/− cKit+ HSPCs, isolated 4 weeks after final poly(I:C) injection, transduced with Jak2V617F or WT control retroviral vectors (n = 5/group). Mice were sacrificed 112 days after transplantation. (A) Hgb, PLT, and WBC counts from PB over the course of the experiment. Mean ± SEM, two-way ANOVA with Geisser-Greenhouse correction followed by Tukey’s post hoc test; significance for values at sacrifice is indicated. (B) Quantification of megakaryocyte number and area in BM from H&E staining of the femur. (C) Representative images of H&E staining of the femur. Scale bar, 60 μm. (D) Weight of the spleen at sacrifice as percentage of total body weight. (E) Quantification of myelofibrosis grade based on reticulin staining of the femur. (F) Representative images of reticulin staining. Scale bar, 200 μm. Bar chart data are shown as mean ± SEM, one-way ANOVA followed by Tukey’s post hoc test. p < 0.05, ∗∗p < 0.01, ∗∗∗p < 0.001, ∗∗∗∗p < 0.0001. See also Figure S3.
Figure 4
Figure 4
scRNA-seq analysis reveals the role of Gli1 in pro-fibrotic gene expression and pathway activation (A) Unsupervised clustering of scRNA-seq of whole BM collected at sacrifice (112 days post Tx) from mice transplanted with either WT or Gli1−/− cKit+ HSPCs transduced with either Jak2V617F or WT control retroviral vectors (n = 3/group, n = 19,897 cells) and identification of 13 hematopoietic clusters and 1 non-hematopoietic cluster. (B) Volcano plots of DEGs, Gli1−/− versus WT in control, HSC, CMP1, and CMP3 clusters. Wilcoxon rank-sum test, two tailed; calculated individually per cluster. (C) Volcano plot of Gli1−/− versus WT in Jak2V617F fibrosis in HSC, CMP1, and CMP3 clusters. (D) Heatmap representation of Discriminant Regulon Enrichment Analysis (DoRothEA) of Gli-family TFs in HSC and CMP1 clusters. (E–H) Top 5 (p.adj) Hallmark terms identified by GSEA comparing Gli1−/−Jak2V617F and WTJak2V617F conditions for the (E) CMP1, (F) CMP3, (H) BP2, and (I) stromal clusters. (I) Top 5 (p.adj) Hallmark terms identified by GSEA for the stromal cluster, comparing Gli1−/−Jak2WT and WTJak2WT conditions. (J) hBM-MSC cell line pre-treated with 5 μM apitosilib or DMSO control and then treated and co-stimulated with 10 ng/mL rTGFB1 for 48 h. COL1a1 expression was quantified with qPCR relative to HPRT1, normalized to the unstimulated, untreated condition (n = 3). Mean ± SEM, one-way ANOVA followed by Tukey’s post hoc test. p < 0.05, ∗∗p < 0.01. See also Figure S4 and Table S3. Marker genes per cluster, related to Figures 4 and S4, Table S4. DEGs, related to Figure 4, Table S5. Gene sets, related to Figure 4.
Figure 5
Figure 5
Ligand-receptor analysis shows change in interactions via the disease-relevant MIF-CD74 axis (A–C) Network plots of ligand-receptor (LR) activity comparing (A) the GLI1−/− condition and WT in the non-disease setting, (B) the Jak2V617F and WT conditions, and (C) the GLI1−/−Jak2V617F and WTJak2V617F conditions. (D) Top 35 downregulated interactions based on stromal cluster receptors in GLI1−/−Jak2V617F compared with WT Jak2V617F; interactions are ordered based on LRScore. (E) Representation of LR interactions shortlisted for further interrogation. (F) Violin plot of MIF expression across HSPC and myeloid primed clusters and of Cd74 in the stromal cluster across all conditions. One-way ANOVA followed by Tukey’s post hoc test. (G) A human MSC cell line, MSOD, was stimulated with 100 ng/mL recombinant MIF for 24 h. TNFa and TGFb expression relative to HPRT1 expression was quantified by qPCR and normalized to the unstimulated condition. Unpaired Student’s t test with Welch’s correction (n = 3). (H) BM-MSCs isolated from WT or CD74−/− mice were treated with conditioned medium collected from an immortalized BM progenitor cell line overexpressing ThPO to induce a fibrotic phenotype. aSMA and GLI1 expression levels were quantified by qPCR and normalized to the WT stromal cells (n = 3). Unpaired Student’s t-test with Welch’s correction. p < 0.05, ∗∗p < 0.01, ∗∗∗∗p < 0.0001. See also Table S6.
Figure 6
Figure 6
MIF protein levels are relevant in patients with MPNs, and genetic or pharmacological perturbation of the MIF-CD74 axis reduces disease phenotype (A) MIF protein level assessed by ELISA in patients with MPNs (n = 54) was normalized to HD (n = 10) samples (IDs MPN23–MPN76). Unpaired Student’s t test with Welch’s correction. Shown is correlation of MIF protein levels and PLT levels in patients with MPNs; simple linear regression testing. (B) MIF protein levels divided according to genotype (Jak2V617F, n = 33; CALRmut, n = 21). One-way ANOVA; p < 0.05, ∗∗p < 0.01, ∗∗∗∗p < 0.0001. (C) JAK2V617F mutant HEL cells were treated with 500 nM ruxolitinib for 24 h or 250 nM BEZ235 for 4 h, and MIF expression levels relative to GAPDH were quantified by qPCR and normalized to the DMSO-treated control (n = 3). Unpaired Student’s t test with Welch’s correction. (D) C57BL/6 recipient mice received lethal irradiation followed by transplantation with either WT or MIF−/− cKit+ HSPCs transduced with either ThPO or empty vector (EV) control lentiviral vectors (n = 5/group). Mice were sacrificed 32 days after transplantation. Monocytes (CD11b+ GR1) and macrophages (F4/80+GR1) in the PB were analyzed via FACS over the course of the experiment. Mean ± SEM, two-way ANOVA followed by Tukey’s post hoc test; significance for values at sacrifice is indicated. (E) Monocytes (CD11b+ GR1) and macrophages (F4/80+GR1) were analyzed in the BM at sacrifice via FACS. Mean ± SEM, one way ANOVA followed by Tukey’s post hoc test. (F) Representative images of H&E staining of the femur. Scale bar, 60 μm. (G) Representative images of reticulin staining. Scale bar, 200 μm. (H) Quantification of myelofibrosis grade based on reticulin staining of the femur. (I) BM cellularity (total cell count) and viability (percent trypan blue negative) at sacrifice. (J) Human BM-MSC cell line cultured with conditioned medium collected from spin embryoid bodies (EBs) generated from either JAK2WT or JAK2V617F patient-derived IPSCs (n = 2 each) and treated with 40 μM ISO-1 or DMSO for 48 h. Col1a1 expression was quantified with qPCR relative to HPRT1, normalized to respective JAK2WT conditioned medium, untreated conditions (n = 3). Mean ± SEM, one-way ANOVA followed by Tukey’s post hoc test. p < 0.05, ∗∗p < 0.01, ∗∗∗p < 0.001, ∗∗∗∗p < 0.0001. See also Figure S5.

References

    1. Baxter E.J., Scott L.M., Campbell P.J., East C., Fourouclas N., Swanton S., Vassiliou G.S., Bench A.J., Boyd E.M., Curtin N., et al. Acquired mutation of the tyrosine kinase JAK2 in human myeloproliferative disorders. Lancet. 2005;365:1054–1061. - PubMed
    1. Vainchenker W., Delhommeau F., Constantinescu S.N., Bernard O.A. New mutations and pathogenesis of myeloproliferative neoplasms. Blood. 2011;118:1723–1735. - PubMed
    1. Rampal R., Al-Shahrour F., Abdel-Wahab O., Patel J.P., Brunel J.P., Mermel C.H., Bass A.J., Pretz J., Ahn J., Hricik T., et al. Integrated genomic analysis illustrates the central role of JAK-STAT pathway activation in myeloproliferative neoplasm pathogenesis. Blood. 2014;123:e123–e133. - PMC - PubMed
    1. Thorsten K., Gisslinger H., Harutyunyan A.S., Nivarthi H., Rumi E., Milosevic J.D., Them N.C.C., Berg T., Gisslinger B., Pietra D., et al. Frequent Mutations in the Calreticulin Gene CALR in Myeloproliferative Neoplasms. Blood. 2013;122
    1. Schneider R.K., Mullally A., Dugourd A., Peisker F., Hoogenboezem R., Van Strien P.M.H., Bindels E.M., Heckl D., Büsche G., Fleck D., et al. Gli1(+) Mesenchymal Stromal Cells Are a Key Driver of Bone Marrow Fibrosis and an Important Cellular Therapeutic Target. Cell Stem Cell. 2017;20:785–800.e8. - PMC - PubMed

Publication types