. 2024 Jan 23;43(1):113584.
doi: 10.1016/j.celrep.2023.113584. Epub 2023 Dec 20.

Subcutaneous white adipose tissue independently regulates burn-induced hypermetabolism via immune-adipose crosstalk

Affiliations

Subcutaneous white adipose tissue independently regulates burn-induced hypermetabolism via immune-adipose crosstalk

Carly M Knuth et al. Cell Rep. .

Abstract

Severe burns induce a chronic hypermetabolic state that persists well past wound closure, indicating that additional internal mechanisms must be involved. Adipose tissue is suggested to be a central regulator in perpetuating hypermetabolism, although this has not been directly tested. Here, we show that thermogenic adipose tissues are activated in parallel to increases in hypermetabolism independent of cold stress. Using an adipose tissue transplantation model, we discover that burn-derived subcutaneous white adipose tissue alone is sufficient to invoke a hypermetabolic response in a healthy recipient mouse. Concomitantly, transplantation of healthy adipose tissue alleviates metabolic dysfunction in a burn recipient. We further show that the nicotinic acetylcholine receptor signaling pathway may mediate an immune-adipose crosstalk to regulate adipose tissue remodeling post-injury. Targeting this pathway could lead to innovative therapeutic interventions to counteract hypermetabolic pathologies.

Keywords: CP: Metabolism; adipose tissue; browning; burn injury; hypermetabolism; inflammation.


Conflict of interest statement

Declaration of interests The authors declare no competing interests.

Figures
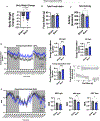
Figure 1.
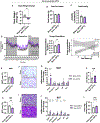
Figure 1.. Severe burns induce increases in energy expenditure and alterations in fuel utilization at room temperature
(A–E) Change in body weight, (B) food intake, and (C) activity in sham and burn mice at room temperature (22°C), n = 7–8/group. (D) Energy expenditure and (E) respiratory exchange ratio overall and during the light and dark phases over a 36-h period in sham and burn mice at room temperature (22°C), n = 7–8/group. Data reported as the mean ± SEM. Significance was determined by a two-tailed Student’s t test or regression-based analysis of covariance (ANCOVA; D, energy expenditure vs. total mass). *p < 0.05, **p < 0.01, ***p < 0.001, ****p < 0.0001.
Figure 2.
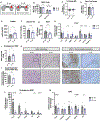
Figure 2.. Severe burns induce increases in energy expenditure and adipose tissue thermogenesis independent of cold stress
(A–D) Change in body weight, (B) food intake, (C) activity, and (D) energy expenditure over a 36-h period in sham and burn mice at thermoneutrality (30°C), n = 7–8/group. (E) iWAT mass as a percentage of body weight, n = 8/group. (F) Representative images of H&E staining of iWAT. Scale bar, 100 μm. (G) mRNA expression of iWAT thermogenic genes as a fold change over sham 30°C mice, n = 5–6/group. (H) BAT mass as a percentage of body weight, n = 8/group. (I) Representative images of H&E staining of BAT. Scale bar, 100 μm. (J) mRNA expression of BAT thermogenic genes as a fold change over sham 30°C mice, n = 5–6/group. (K) Liver mass as a percentage of body weight, n = 8/group. (L) FFA in sham and burn mice at thermoneutrality, n = 8/group. Data reported as the mean ± SEM. Significance was determined by a two-tailed Student’s t test or ANCOVA (D, energy expenditure vs. total mass). *p < 0.05, **p < 0.01, ***p < 0.001, ****p < 0.0001.
Figure 3.
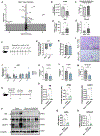
Figure 3.. Burn adipose tissue transplantation into a healthy mouse leads to systemic dysfunction
(A) Schematic of study design, whereby minced iWAT from either a sham donor mouse (S → S) or burn donor mouse (B → S) was transplanted into sham recipients. (B) iWAT graft mass when added and retrieved 3 weeks post-implantation, n = 13/group. (C) Change in body weight, n = 13/group. (D) Total caloric intake over the 3-week period, n = 12–13/group. (E) Serum triglycerides, n = 5/group. (F) Serum AST, n = 5/group. (G) Liver mRNA expression of insulin and glucose sensitivity, lipogenic, and inflammatory markers calculated as a fold change over controls (S → S), n = 4–5/group. (H–J) Representative biaxial plots of CD45+ lymphoid (CD11b) immune cells and (H) B220+ B cells or (I) CD3+ T cells and (J) myeloid (CD11b+) immune cells and CD64+ macrophages in the endogenous iWAT SVF, n = 4 iWAT fat pads/group, pooled. (K and L) (K) Oxygen consumption rate (VO2) and (L) respiratory exchange ratio overall and during the light and dark phases during a 24-h period on days 29–30 post-transplantation, n = 5/group. Data reported as the mean ± SEM. Significance was determined by two-way ANOVA (B), two-tailed Student’s t test (C–L), and ANCOVA (K, oxygen consumption vs. total mass). *p < 0.05, **p < 0.01, ***p < 0.001.
Figure 4.
Figure 4.. Healthy adipose tissue transplantation into a burn mouse improves systemic dysfunction and reduces thermogenesis
(A) Schematic of study design, whereby minced iWAT from either a sham donor mouse (S → B) or a burn donor mouse (B → B) was transplanted into burn recipients. (B) iWAT graft mass when added and retrieved 3 weeks post-implantation, n = 14/group. (C) Change in body weight, n = 14/group. (D) Total caloric intake over the 3-week period, n = 12–14/group. (E) Serum leptin concentrations, n = 10/group. (F) Serum triglycerides, n = 5/group. (G) Serum AST, n = 9/group. (H) Liver mRNA expression of insulin and glucose sensitivity, lipogenic, and inflammatory markers as a fold change over controls (S → S), n = 5/group. (I) Ratio of endogenous iWAT mass to body weight, n = 14/group. (J) Basal respiration of isolated mitochondria from the endogenous iWAT, n = 5/group. (K) Representative images of H&E histology and UCP1-stained immunohistochemistry of endogenous iWAT at 10× original magnification. Scale bar, 100 μm. (L and M) mRNA expression of thermogenic, lipolytic, and neurogenic markers calculated as a fold change over controls (S → S) in (L) endogenous iWAT and (M) BAT, n = 5–9/group. Data reported as the mean ± SEM. Significance was determined by two-way ANOVA for (B) and two-tailed Student’s t test for (C)–(M). *p < 0.05, **p < 0.01, ***p < 0.001, S → B vs. B → B. &&&p < 0.001, within groups S → B or B → B.
Figure 5.
Figure 5.. Single-cell mass cytometry reveals that the dysfunctional immune cell profile following a severe burn is rescued with healthy adipose tissue transplantation
(A) Representative viSNE plots for B → B and S → B endogenous iWAT SVF of the identified cellular populations. (B) Proportion of live singlets representing CD45+ leukocytes, PDGFRα+ adipose progenitor cells (APCs), and CD45/PDGRFα cells. (C–F) Biaxial and viSNE plots with median expression of markers for (C) leukocytes and APCs, followed by CD45+ leukocyte markers for CD11b+ (D) macrophages and CD11b (E) B cells and (F) T cells in the endogenous iWAT SVF of B → B (left) and S → B groups (right), n = 4 iWAT fat pads/group, pooled. (G) Flow cytometry biaxial plots showing post-burn changes over time in CD19+ B cells and CD4+ T cells in isolated SVF from subcutaneous adipose tissue from adult human burn patients.
Figure 6.
Figure 6.. The nicotinic acetylcholine receptor signaling pathway mediates post-burn adipose tissue thermogenesis
(A) Volcano plot highlighting differentially expressed proteins between sham and burn mice at 7 days post-burn. Red dots indicate significantly decreased proteins and blue dots indicate significantly increased proteins in burn mice, n = 3/group. (B) Relative protein abundance of acetylcholinesterase between sham and burn mice, n = 3/group. (C) Secreted acetylcholine concentration measured in culture medium with iWAT explants from sham or burn mice, n = 3–5/group. (D and E) mRNA expression of (D) Ucp1, n = 9/group, and (E) Chrna2, n = 9/group, in iWAT of sham or burn mice at 7 days post-burn, calculated as a fold change over sham controls. (F) Schematic of study design, whereby sham or burn (20% TBSA) mice were injected daily with either 30 mg/kg of hexamethonium bromide (HexBr, HBr) or PBS for 7 days until euthanasia and tissue collection. (G) Change in body weight post-injection, n = 8–12/group. (H) Total food intake, n = 5/group. (I) Representative images of H&E staining in iWAT of burn + saline and burn + HBr mice. Scale bar, 100 μm. (J) mRNA expression of thermogenic, adrenergic, and insulin receptor signaling markers as a fold change over BSal mice in iWAT, n = 8–9/group. (K–M) Percentage frequency of CD45+ (K) B cells, (L) T cells, and (M) M2-like macrophages, n = 3–4/group. (N) Schematic of study design for chemical denervation followed by burn injury experiments. (O and P) (O) Quantified western blot protein expression of TH, ATGL, and UCP1 in iWAT of denervated and sham-denervated burn mice and (P) representative images, n = 3–7/group. (Q) Acetylcholine concentration in iWAT of denervated and sham-denervated burn mice, n = 4/group. (R) mRNA expression of iWAT Chrna2, n = 6–7/group. Data reported as the mean ± SEM. Significance was determined by two-tailed Student’s t test. *p < 0.05, **p < 0.01, ***p < 0.001, ****p < 0.0001.

References

    1. Guilherme A, Henriques F, Bedard AH, and Czech MP (2019). Molecular pathways linking adipose innervation to insulin action in obesity and diabetes mellitus. Nat. Rev. Endocrinol 15, 207–225. - PMC - PubMed
    1. Ikeda K, and Yamada T (2020). UCP1 Dependent and Independent Thermogenesis in Brown and Beige Adipocytes. Front. Endocrinol 11, 498. - PMC - PubMed
    1. Sidossis LS, Porter C, Saraf MK, Børsheim E, Radhakrishnan RS, Chao T, Ali A, Chondronikola M, Mlcak R, Finnerty CC, et al. (2015). Browning of Subcutaneous White Adipose Tissue in Humans after Severe Adrenergic Stress. Cell Metab 22, 219–227. - PMC - PubMed
    1. Patsouris D, Qi P, Abdullahi A, Stanojcic M, Chen P, Parousis A, Amini-Nik S, and Jeschke MG (2015). Burn Induces Browning of the Subcutaneous White Adipose Tissue in Mice and Humans. Cell Rep. 13, 1538–1544. - PMC - PubMed
    1. Xie H, Heier C, Meng X, Bakiri L, Pototschnig I, Tang Z, Schauer S, Baumgartner VJ, Grabner GF, Schabbauer G, et al. (2022). An immune-sympathetic neuron communication axis guides adipose tissue browning in cancer-associated cachexia. Proc Natl Acad Sci USA 119. - PMC - PubMed

Publication types